 Open Access Article
Polyester-based polyurethanes derived from alcoholysis of polylactide as toughening agents for blends with shape-memory properties
Chorney Eang a,
Bunthoeun Nima,
Mantana Opaprakasitb,
Atitsa Petchsukc and
Pakorn Opaprakasit
 *a
*a
aSchool of Integrated Science and Innovation, Sirindhorn International Institute of Technology (SIIT), Thammasat University, Pathum Thani 12121, Thailand. E-mail: pakorn@siit.tu.ac.th
bDepartment of Materials Science, Faculty of Science, Chulalongkorn University, Bangkok, 10330, Thailand
cNational Metal and Materials Technology Center, National Science and Technology Development Agency (NSTDA), Pathum Thani 12120, Thailand
First published on 9th December 2022
Abstract
A process for sizing down and functionalizing commercial polylactide (PLA) resin is developed by alcoholysis with 1,4-butanediol (BDO) and propylene glycol (PG) to medium-sized PLA-based diols, with lower cost than a bottom-up synthesis process. These are subsequently used as polyols in preparing polyurethanes (PU) by reacting with 1,6-diisocyanatohexane (HDI). The PLA-based PU has an excellent elongation at break of 487%. The products are suitable as toughening agents for brittle PLA resin due to their highly elastic properties and high compatibility with PLA. The PU products are blended with PLA resin at various compositions, and their physical and mechanical properties and shape recovery are examined. The tensile tests showed enhancements in elongation at break up to 160% with low modulus. The fracture morphology and FTIR results confirm that the blends show strong interfacial interaction and adhesion between the PLA-based PU disperse phase and the PLA matrix. The PLA/PU blends exhibit a high shape recovery efficiency, and their recovery mechanisms are identified. These flexible PLA/PU blends are promising for various applications where bio-compatibility/degradability and high ductility are required, especially as filaments for 3D bio-printing.
1. Introduction
Polylactide (PLA) is a degradable polymer of great interest in various commercial applications to replace non-degradable plastics. Owing to the stringent emphasis on sustainable polymer research, PLA as a biodegradable polymer has attracted vast attention from researchers and industries.1 The polymer is synthesized from lactic acid, originating from the fermentation pathways of sugar or starch, by microorganism activity.2,3 The polymer and its derivatives are used in many applications, especially functional films, packaging, 3D-printing filaments, medical devices, fibers, and hot-melt adhesives. Although PLA is degradable, its waste is also considered a critical environmental concern due to its slow degradation rate under ambient conditions. In contrast, industrial composting conditions are required.4,5 Post-consumer PLA products can be collected and treated using mechanical or chemical recycling.6 However, deterioration in the properties of the recycling products is a major limitation of mechanical recycling as the polymer is prone to degradation and oxidation. Alternatively, chemical recycling is a promising process to depolymerize PLA into small-sized compounds with functional groups for synthesizing other value-added products, such as lactate oligomers or ester-based polyols.7–10Alcoholysis is practically employed in the chemical recycling of PLA waste using various alcohols, e.g., methanol, ethanol, ethylene glycol, propane-1,3-diol, butane-1,4-diol, and pentaerythritol.8,10–17 In addition, the process can be applied to virgin PLA resin for sizing down the commercial high-molecular weight PLA to medium-sized products, which are suitable for specific applications, e.g., adhesives, food-contact packaging, and cosmetics. These provide high-purity functional materials, with easy processing and lower price starting materials, compared to those bottom-up synthesis processes from lactic acid or lactide. The major products of the alcoholysis process are small to medium-sized alkyl lactate esters, diols, and polyols, which can be used as solvents or starting materials for other degradable polymers.16–19 The multi-hydroxyl products are promising as hydroxyl-containing compounds in various applications, such as polymer blends, adhesives, and coating. For instance, elastomeric PLA-based polyurethane (PU) was generated from a reaction between alcoholized PLA-diol with 1,6-diisocyanatohexane (HDI). These flexible PU materials have high elasticity with low modulus and adequate strength compared to neat PLA.16,17 The PLA-based PU is promising as single-component functional material or additive to improve the mechanical properties of other bioplastics through a blending process.
The interfacial adhesion and compatibility between PLA and elastomeric polymers are the key factors in improving the mechanical property of PLA. Neat PLA is highly brittle and rigid.20 This has inherent low elasticity, flexibility, toughness, slow crystallization rate, heat resistance, and short-term durability, limiting its use in some applications.21 Semicrystalline PLA possesses a tensile strength of approximately 50–70 MPa, a tensile modulus of 3.0–4.0 GPa, elongation at break of 2–10%, a flexural strength of around 100 MPa, and flexural modulus of 4.0–5.0 GPa, which vary with its molecular weights.22,23 Its undesired properties, especially low toughness, can be enhanced by plasticizing, blending, or copolymerizing with other polymers or elastomers.24–28 Elastomers commonly used in PLA blend systems include natural rubber and derivatives, polyurethanes, polyamides, poly(butylene succinate), and star-shaped PDLA.24–26,29–32 This leads to desirable or balance properties of modulus, toughness, and high elasticity. For example, melt blending of PLA and elastomeric PUs converts the rigid PLA to rubbery and tough materials. When the PU content was increased, the elongation at break and impact strength increased. Impact strength and elongation at break of 315 J m−2 and 363% were observed at a PU content of 30%. However, the strength and modulus decreased dramatically compared to neat PLA. From SEM observations, neat PLA showed brittle fracture characteristics with a smooth surface, while PLA/PU blends exhibited high interfacial adhesion with fibril and cavitation fractures.33
In this work, a process for sizing down high molecular weight PLA resin by alcoholysis is developed utilizing microwave irradiation. The effects of diol types on the structures and properties of the resulting medium-sized alcoholyzed products are examined using 1,4-butanediol (BDO) and propylene glycol (PG). The resulting OH-capped alcoholized PLA products with designed structures and compositions are employed as polyols for preparing highly elastic PLA-based PUs by reacting with HDI, as summarized in Fig. 1. The PLA-based PUs are used as a toughening agent for PLA resin, owing to their highly elastic properties and high miscibility with the PLA matrix by a hot-melt blend technique at various blend compositions. The physical and mechanical properties and structural recovery efficiency of the resulting blends are examined. Insights into the toughening and shape recovery mechanisms are investigated for developing suitable materials and fabrication processes for practical applications.
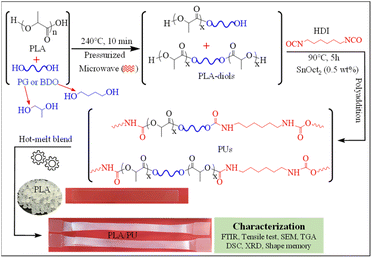 | ||
| Fig. 1 Overview of the synthesis of PLA-based PUs from the products of the sizing down and functionalization of PLA, and utilizing them as a toughening agent for brittle PLA resin. | ||
2. Results and discussion
2.1 Chemical structures and properties of PLA-based PUs
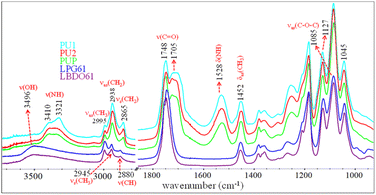
PLA-OH oligomers obtained from the alcoholysis of PLA with BDO and PG are used as raw materials for preparing elastomeric PLA-based PUs. FTIR spectroscopy is utilized to characterize the chemical structures of the PLA-OH oligomers, i.e., LBDO61 and LPG61, as shown in Fig. 2. The characteristic bands of νas(CH3), νs(CH3), ν(CH), and ν(C![[double bond, length as m-dash]](https://www.rsc.org/images/entities/char_e001.gif) O) modes are observed at 2995, 2945, 2880, and 1748 cm−1. These are similar to those of neat PLA, reflecting lactate oligomers. In contrast, a strong band of ν(OH) is observed at 3496 cm−1, reflecting a formation of hydroxyl end groups and the presence of unreacted diols. This agrees with a relative decrease in intensity of the νas(C–O–C) band at 1085 cm−1 compared to the 1045 and 1127 cm−1 bands. The results confirm chain scissions at the ester bonds due to alcoholysis or transesterification, leading to shorter chains with higher hydroxyl terminal contents. PLA-based PUs is generated from the reaction between PLA-OH and HDI, whose FTIR spectra are also compared in Fig. 2. The reaction is confirmed by the urethane (–NH–COO–) bands, i.e., ν(NH), ν(C
O) modes are observed at 2995, 2945, 2880, and 1748 cm−1. These are similar to those of neat PLA, reflecting lactate oligomers. In contrast, a strong band of ν(OH) is observed at 3496 cm−1, reflecting a formation of hydroxyl end groups and the presence of unreacted diols. This agrees with a relative decrease in intensity of the νas(C–O–C) band at 1085 cm−1 compared to the 1045 and 1127 cm−1 bands. The results confirm chain scissions at the ester bonds due to alcoholysis or transesterification, leading to shorter chains with higher hydroxyl terminal contents. PLA-based PUs is generated from the reaction between PLA-OH and HDI, whose FTIR spectra are also compared in Fig. 2. The reaction is confirmed by the urethane (–NH–COO–) bands, i.e., ν(NH), ν(C![[double bond, length as m-dash]](https://www.rsc.org/images/entities/char_e001.gif) O), and δ(NH) modes, at 3321–3388, 1705, 1528 cm−1. The νas(CH2) and νs(CH2) bands of methylene from HDI segments are observed at 2938 and 2865 cm−1.
O), and δ(NH) modes, at 3321–3388, 1705, 1528 cm−1. The νas(CH2) and νs(CH2) bands of methylene from HDI segments are observed at 2938 and 2865 cm−1.
2.2 Thermal properties of alcoholized PLA products and PLA-based PUs
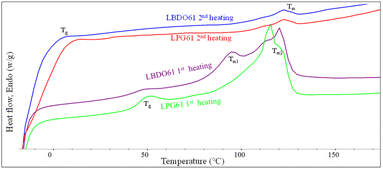
The thermal properties of the alcoholized PLA products are examined by DSC, as shown in Fig. 3 and summarized in Table 1. The 1st heating scan thermograms of LBDO61 and LPG61 products show a glass transition (Tg) and two melting temperatures (Tm), reflecting a mixture of lactate sequences with different chain lengths attached to the diols. The Tg was observed at 43.6 and 46.0 °C for LBDO61 and LPG61. However, these Tg values are lower than neat PLA (59.3 °C), reflecting their shorter lactate sequences and the presence of respective unreacted diols, which may act as a plasticizer. Given that the two alcoholized PLA samples have similar average molecular weights, the higher Tg of LPG61 is likely due to the steric effect from the methyl side group on the PG structure, which leads to a more rigid segmental structure, and a lower content of unreacted PG in the mixture, as summarized in Table 1. Two different melting characteristics were observed at 119.4 and 93.5 °C, indicating 2 domains of lactate sequences with different lengths, which phase-separate due to their different solubility parameters after the reaction completion and a long storage time. In contrast, the 2nd heating scan thermograms of both samples showed only a weak single melting peak at 121.5 °C, and lower Tg values at −10.7 and −1.5 °C, with higher heat capacities than those from the first scans, reflecting lower crystallinity with higher contents of amorphous domains. These imply that after the complete melting from the 1st cycle scan, the chains with different sizes are forced to mix, leading to retardation of the crystallization. The lower Tg values are likely because of the higher degree of plasticizing effect.| Sample | 1st heating | ||||
|---|---|---|---|---|---|
| Tg (°C) | Tm1 (°C) | Tm2 (°C) | ΔHm1 (J g−1) | ΔHm2 (J g−1) | |
| LBDO61 | 43.7 | 93.5 | 119.4 | 1.7 | 7.5 |
| LPG61 | 46.0 | — | 113.8 | — | 2.3 |
| Sample | 2nd heating | ||
|---|---|---|---|
| Tg (°C) | Tm (°C) | ΔHm (J g−1) | |
| LBDO61 | −10.7 | 121.5 | 0.5 |
| LPG61 | −1.5 | 121.7 | 0.6 |
The thermal properties of the resulting PU samples were also examined. DSC thermograms of solvent-cast PU samples are illustrated in Fig. 4 and Table 2. The 1st scan thermograms of PU1, PU2, and PUP showed Tg values ranging from 6.1 to 21.0 °C, with 2 regions of melting peaks in the ranges of 56.1–72.3 and 90.3–119.3 °C. These are likely due to the plasticizing effect of residue solvents remaining in the solvent-cast samples. This agrees with the results from the 2nd scan thermograms, in which the Tg values increased to 28.6–37.6 °C, after the solvent was evaporated at the end of the first heating scan. It is noted that additional reactions to further generate urethane bonds may also contribute to the increase in the Tg value, as evidenced in a series of endothermic peaks in the 1st scan thermogram of PUP. The lower Tg of PLA-based PUs, compared to neat PLA, firmly indicates the elastomeric nature of the materials, suitable for use as a PLA-based toughening agent.
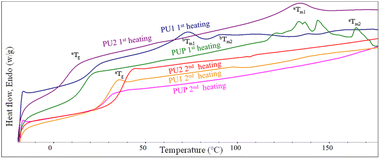 | ||
| Fig. 4 The 1st and 2nd heating DSC thermograms of PUs obtained from the reactions between HDI with LBDO61 and LPG61 diols. | ||
| Samples | 1st heating | 2nd heating | ||||||||
|---|---|---|---|---|---|---|---|---|---|---|
| Tga (°C) | Tm1b (°C) | Tm2b (°C) | ΔHm1b (J g−1) | ΔHm2b (J g−1) | Tm1a (°C) | Tm2a (°C) | ΔHm1a (J g−1) | ΔHm2a (J g−1) | Tga (°C) | |
| a PLA-urethane.b BDO-urethane. | ||||||||||
| PU1 | 21.0 | 72.3 | 90.3 | 3.1 | 0.4 | 137.7 | — | 0.2 | — | 28.6 |
| PU2 | 6.2 | 56.1 | — | 0.1 | — | 132.3 | — | 4.8 | — | 37.6 |
| PUP | 16.1 | — | 119.3 | — | 0.3 | 132.9 | 164.6 | 2.7 | 1.6 | 29.2 |
2.3 Mechanical properties of PLA/PU blends
PLA has some disadvantages, i.e., high brittleness and rigidity and low elasticity, which limit its use in certain applications. In contrast, the resulting PU1, PU2, and PUP samples showed soft and highly elastic behavior with an elongation at break as high as 487%, as summarized in Table 5. Given that these materials contain medium-sized lactate sequences in their structures, they have a high potential for use as toughening agents for brittle PLA resin, with high compatibility. The resulting elastomeric PLA-based PUs are therefore blended with PLA by a melt blend technique.The effects of the structures of PUs (PU1, PU2, PUP) and their compositions on the blend's properties are summarized in Table 5. Neat PLA is highly rigid, with a modulus of 2480 MPa and tensile strength of 60.5 MPa, but highly brittle with elongation at break of only 3.1%. When PLA-based PU was introduced, the mechanical properties of PU1-10 were slightly improved. The elastic property was further enhanced by increasing the PU1 content from 30 to 50 wt%, while the tensile strength and modulus decreased. As illustrated in Fig. 5, the elongation at break increased to 85% for PU1-30, while the tensile strength and modulus slightly reduced to 34.6 MPa and 1747 MPa, respectively. With a further increase in the PU1 composition to 70 wt%, the flexibility was largely enhanced, but a rapid drop in the strength and modulus was observed. This is because of the domination of the elastomeric PU domains.
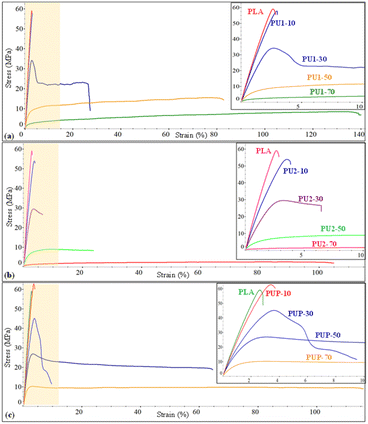 | ||
| Fig. 5 The stress–strain curves of (a) PLA/PU1, (b) PLA/PU2, and (c) PLA/PUp blends as a function of the blend compositions. | ||
The blends of brittle PLA with PU2 and PUP were further examined by varying the PLA/PU feed ratios from 90/10, 70/30, 50/50, and 30/70 wt/wt. The mechanical properties are summarized in Table 5 and Fig. 5. PLA/PU2 blends showed a dramatic decrease in tensile strength from 52.7 to 2.6 MPa and modulus from 2113 to 49 MPa when PU2 was varied from 10 to 70 wt%. In contrast, the elongation at break was largely improved from 3.8 to 137.9%. By introducing this PU2 elastomer into the blends, rigidity reduction and flexibility enhancement were significantly obtained for PU2-30 and PU2-50. For PU2-70, a large improvement in elongation at break was observed, but the material has low tensile strength and modulus. Additionally, PLA/PUP blends have greater improvements in mechanical properties. The tensile strength and modulus decreased from 62.2 to 10.7 MPa and 2330 to 1037 MPa, respectively, when the PUP contents varied from 10 to 70 wt%. The elongation at break was increased from 3.7 to 102.2%. This PUP can effectively improve the mechanical properties of the blends to desirable tensile strength, modulus, and elongation at break.
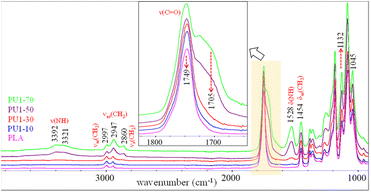
FTIR spectra of PLA/PU1 blends as a function of the PU1 content are compared in Fig. 6. The characteristic bands of PLA domain in the blends are similar to neat PLA, whose intensities depend on its compositions. The bands of PU1 were observed at 1705 ν(C![[double bond, length as m-dash]](https://www.rsc.org/images/entities/char_e001.gif) O) and 1529 cm−1 δ(NH). The intensity of the ν(NH) bands at 3410–3320 cm−1 increased with the PU1 content. A close examination of these modes indicated a red shift in the band center from 3410 cm−1 for PU1 to 3392 cm−1 for PU1-40, indicating stronger hydrogen bonding of the urethane groups with the carbonyl, leading to the improved miscibility of the PU domains and the PLA matrix.
O) and 1529 cm−1 δ(NH). The intensity of the ν(NH) bands at 3410–3320 cm−1 increased with the PU1 content. A close examination of these modes indicated a red shift in the band center from 3410 cm−1 for PU1 to 3392 cm−1 for PU1-40, indicating stronger hydrogen bonding of the urethane groups with the carbonyl, leading to the improved miscibility of the PU domains and the PLA matrix.
2.4 Surface morphology of PLA/PU blends
The surface morphology of PLA/PU blends was examined using SEM at 500× and 3000× magnifications. The cryogenic crack morphology of neat PLA, PLA/PU1 blends, and PU1 is illustrated in Fig. 7. Neat PLA and PU1 showed brittle and smooth fracture characteristics. The corresponding features of PLA/PU1 blends at various PU1 contents from 10 to 70 wt% were investigated. Small domains of PU1 with irregular shape dispersed in the PLA matrix was observed in PU1-10. This indicates partial compatibility of the PLA-based PU domains and the PLA matrix. When increasing the PU1 content from PU1-30 to PU1-50, more PU domains with spherical shapes dispersed in the PLA matrix were observed. This confirms the toughening effect of the PLA matrix by the uniform distribution of the elastic PU dispersed domains. When the PU1 content was increased to 70%, an inverse morphology was evidenced, in which spherical crystal domains of PLA are observed in the amorphous PU matrix. High shear yielding and ductile fracture patterns were observed in PU1-70, similar to neat PU1.34 The results agree with the mechanical properties of the blends, which are toughened materials with good shear yielding and shear strength.35,36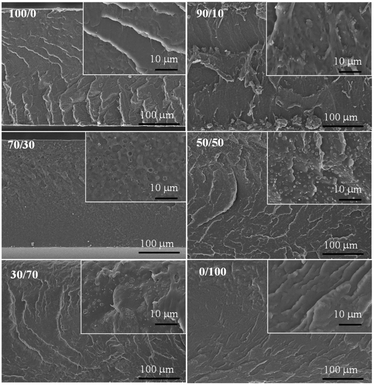 | ||
| Fig. 7 The cryogenic crack morphology of neat PLA, PLA/PU1 blends at different blend compositions, and PU1 original films. | ||
2.5 Thermal properties of PLA/PU1 blends
The thermal properties of neat PLA and PLA/PU1 blends as a function of the blend compositions were examined. The 1st heating DSC thermograms of the samples prepared from melt blending and fabricated by a compression molding technique are illustrated in Fig. 8(a) and summarized in Table 3. Neat PLA showed Tg, exothermic crystallization (Tc), and Tm at the following temperatures: 59.3, 113.7, and 148.0 °C. PU1 showed Tg at 21.0 and Tm at 72.8 °C. When PU1 was introduced to the PLA matrix, 2 separate Tg's of both components were observed, whose positions vary with the blend compositions. The PU1 domains exhibit Tg at 29.0 to 26.5 °C, while that of PLA domains decreased from 59.3 to 53.2 °C when the PU1 contents were increased from 10 to 40%. This reflects the partial miscibility of PU1 and the PLA matrix, especially at the interface, due to their similar lactate sequences but different polarity between the urethane sequences. Given the excellent toughness and flexibility of PU1, the improved compatibility with the PLA matrix confirms their high potential as a toughening agent for the biopolymer. It is noted that an aging pattern is observed at this transition temperature, as the samples were stored for some time before DSC measurements. The normalized ΔHm values were comparable among all blends and neat PLA at around 29 J g−1, as summarized in Table 3. This indicates an upper limit of crystallinity of this commercial PLA formulation. However, the ΔHc value decreased with increasing PU1 content. This implies that the PU1 domains play a role as nucleating agents in promoting partial melt crystallization during the cooling step of the sample preparation, likely because of the strong hydrogen bonding interaction between the urethane groups and lactates of PLA, as observed in FTIR results. When the blend samples were subsequently heated above their Tg, therefore, a lower degree of cold crystallization was observed.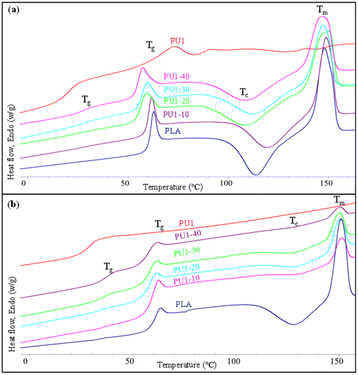 | ||
| Fig. 8 The 1st (a) and 2nd heating (b) DSC thermograms of neat PLA and PLA/PU1 blends as a function of the blend composition. | ||
| PLA/PU | Tg PU (°C) | Tg PLA (°C) | Tc PLA (°C) | ΔHc PLA (J g−1) | *ΔHc PLA (J g−1) | Tm PLA (°C) | ΔHm PLA (J g−1) | *ΔHm PLA (J g−1) | Crystallinityb (%) |
|---|---|---|---|---|---|---|---|---|---|
| a Normalized with the PLA content in the blend.b (*ΔHm − *ΔHc) × 100/ΔH°; ΔH° = 93 J g−1. | |||||||||
| 1st heating scan | |||||||||
| PLA | — | 59.3 | 113.7 | −27.2 | −27.2 | 148.0 | 29.3 | 29.3 | 2.3 |
| PU1-10 | 29.0 | 58.3 | 119.3 | −23.4 | −26.0 | 148.7 | 24.0 | 26.7 | 0.7 |
| PU1-20 | 28.1 | 54.6 | 109.3 | −24.5 | −30.6 | 150.0 | 23.1 | 28.9 | 0.0 |
| PU1-30 | 28.6 | 55.0 | 112.3 | −19.2 | −27.5 | 147.0 | 20.5 | 29.3 | 2.0 |
| PU1-40 | 26.5 | 53.2 | 108.7 | −14.9 | −24.8 | 146.3 | 17.6 | 29.3 | 4.8 |
| PU1 | 21.0 | — | — | — | — | 72.8 | — | — | — |
![[thin space (1/6-em)]](https://www.rsc.org/images/entities/char_2009.gif) |
|||||||||
| 2nd heating scan | |||||||||
| PLA | — | 59.2 | 128.0 | −14.1 | −14.1 | 150.7 | 15.5 | 15.5 | 1.4 |
| PU1-10 | 35.1 | 58.9 | 130.7 | −2.3 | −2.5 | 151.0 | 2.4 | 2.6 | 0.1 |
| PU1-20 | 32.8 | 57.6 | 129.0 | −4.5 | −5.6 | 150.3 | 4.2 | 5.2 | 0.0 |
| PU1-30 | 34.7 | 57.9 | 128.3 | −3.2 | −4.6 | 150.0 | 3.1 | 4.4 | 0.0 |
| PU1-40 | 36.2 | 57.1 | 129.3 | −0.7 | −1.2 | 150.0 | 1.2 | 1.9 | 0.7 |
| PU1 | 28.6 | — | — | — | — | — | — | — | — |
The 2nd heating DSC thermograms are illustrated in Fig. 8(b) and summarized in Table 3. After the 1st heating cycle, the Tg of PU1 segments was observed at 33–36 °C. This is higher than those in the 1st scan thermograms, implying higher miscibility of the PU1 dispersed domains. The Tg, Tc, and Tm of the PLA segments remained significantly unchanged, similar to neat PLA. However, the normalized ΔHc and ΔHm values decreased with increasing PU1 content due to the increased miscibility, which in turn retard the PLA crystallization.37 This is also reflected by a decrease in the crystallinity of PLA (Xc) as a function of PU1 content. It is noted that Xc was calculated according to the equation of ((*ΔHm − *ΔHc) × 100/ΔH°, where ΔH° of 93 J g−1) was employed.38,39
2.6 Thermal stability of PLA/PU1 blends
The thermal stability of neat PLA and PLA/PU1 blends at different blend contents was examined by thermogravimetric analysis (TGA), as illustrated in Fig. 9. A single-step degradation was observed in neat PLA at 360 °C. Upon introducing PU1, the blends showed a decrease in thermal degradation temperature. This agrees with DSC results that the partial miscibility of the PLA-based PU1 interrupts the crystalline formation of the PLA matrix, lowering its thermal stability. The degradation temperature varied with the PU1 content, from 305 to 280 °C when the PU1 content was increased from 10 to 40% wt/wt. Moreover, an additional weight loss step was observed in a region of 120–150 °C. The temperature is independent of the blend content and likely due to the shorter chain PU1 segments. The weight loss was 2–4 wt%, which slightly depends on the blend content. This is likely associated with the excess urethane segments segregated from the PLA matrix.40,41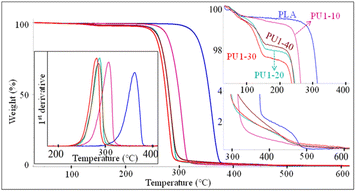 | ||
| Fig. 9 TGA thermograms and 1st derivative TGA (DTGA) curves of PLA/PU1 blends as a function of the blend composition. | ||
2.7 Crystalline structures of PLA/PU1 blends
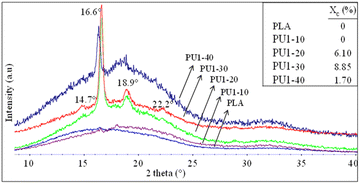
The crystalline structures of neat PLA and PLA/PU1 blends were examined by X-ray diffraction (XRD), as shown in Fig. 10. XRD patterns of neat PLA are dominated by a broad baseline, with only a weak crystal peak at 2θ of 16.1°, corresponding to a d-spacing of 5.49 Å. This implies an amorphous structure of PLA, likely due to the incorporation of additives to this commercial resin and a fast cooling rate during the compression of the film sample.42,43 Similar to neat PLA, PU1-10 was almost completely amorphous, as only a weak crystalline peak was observed at 16.6° (d-spacing of 5.33 Å).29,44 However, the blends at 20 and 30% of PU1 showed strong crystalline signals at 14.7° (010), 16.6° (200/110), 18.9° (203), and 22.2° (210), corresponding to the d-spacing of 6.02, 5.33, 4.69, and 4.00 Å, respectively.45,46 This indicates the formation of PLA's α-form crystalline structure, i.e., two 103 helical chains in the orthorhombic unit cell.47–50 The crystallite dimensions calculated using the Bragge's law, i.e (1/dhkl)2 = (h/a)2 + (k/b)2 + (l/c)2, revealed the values of a = 1.068, b = 0.595, and c = 2.953 nm. These are slightly higher than those of neat PLA (a = 1.070, b = 0.595, and c = 2.780 nm).49–51 The results confirm that the incorporation of PLA-based PU1 at an appropriate composition can effectively induce the crystallization of this commercial PLA, likely due to strong interactions between the PLA's carbonyl and hydroxyl terminals or the urethane groups. A further increase in the PU1 content to 40%, however, led to a weakening of the crystalline peaks and a stronger amorphous halo. This implies the domination of PLA-based PU characteristics.2.8 Heat treatments and structure recovery of PLA/PU blends
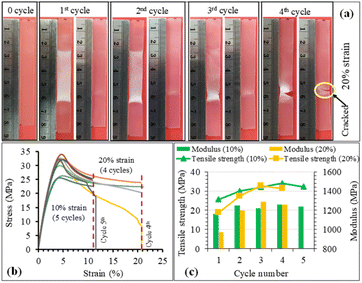
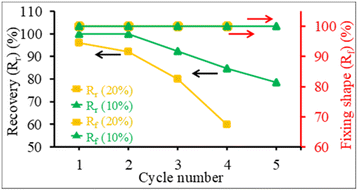
The structure recovery behavior of PLA/PU blend films was examined using a tensile test at room temperature (25 °C). PUP-50 film (0.22 mm thickness) was chosen and subjected to fixed strains of 10 and 20%, which are higher than the elongation at break and elongation at yield of neat PLA. Upon applying the strains, the blends showed ductile plastic deformation (whitening after the yield point due to chain extending alignment), reflecting the toughening of the PLA matrix by the PU phase, as illustrated in Fig. 11(a). After heat treatments at 50 °C for 5 min, the film showed structure recovery by returning to its original shape and changing from ductile deformation (white) to transparent. At a 10% fixed strain, the deformation/recovery can be repeated for up to 5 cycles, before a crack point develops. The repeatability decreased to 4 cycles at 20% applied strain. The corresponding stress–strain curves of the experiments are shown in Fig. 11(b). The tensile strength and modulus of the samples at 10 and 20% strain tests after structural recovery cycles are compared in Fig. 11(c). The strength and modulus of the film increased as a function of the measurement cycle due to the strain-strengthening process and the heat treatment effect similar to annealing during the structural recovery step at 50 °C, which leads to proper chain orientation, arrangement, and improved interactions. However, the values dropped at the penultimate cycle before the sample break, indicating a permanent change beyond recovery in the material's structure.After applying strains to the film sample, a fixing shape (Rf) was recorded at room temperature, while the recovery (Rr) was measured after thermal activation at 50 °C for 5 min, as summarized in Fig. 12. The Rf value of 100% was observed for all measurement cycles at both 10 and 20% applied strains. The value reflects the relieved stress at room temperature due to the crystalline domain dislocation and molecular chain disentanglement.52 This implies no recovery at room temperature, as these applied strains are beyond the material's yield point, reflected by plastic deformation, as previously discussed. The PLA/PU blend film showed a 100% structural recovery (Rr) after heating at 50 °C in the first cycle, at both applied strains of 10 and 20%. The recovery is likely due to the elastic PU domains and the chain rearrangement of the PLA matrix. When compared with a previous report on PLA/TPU (50/50) blend, a shape recovery of 93.5% was achieved unless a heat treatment was performed at a high temperature as 160 °C.52 The Rr value of the blend film, however, dropped after several cycles. At 10% maximum strain, the value decreased from 100% at the 1st and 2nd cycles to 78.6% at the 5th cycle. When the applied strain was raised to 20%, the Rr recovery value was 95.9% in the 1st cycle, which decreased to 80.1% in the 3rd and 59.9% in the 4th cycle, in which a crack was observed. This reflects that the higher applied strains may lead to stress relaxation and a higher degree of permanent changes, e.g., chain breaking, resulting in a lower recovery ability of the materials.
 | ||
| Fig. 12 The structure recovery (Rr, %) and fixing shape (Rf, %) of PUP-50 films at different applied strains and testing cycles. | ||
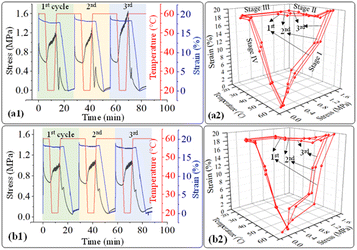
In addition, the structure recovery ability of PLA/PU blend samples in a dog-bone shape was examined. As the blends have a permanent shape at a temperature below their Tg (33–36 °C), the recovery tests were conducted between 20 and 60 °C, where 20 °C is a freezing point, and 60 °C is a recovery temperature. PLA/PU blends were deformed at 60 °C for 20% applied strain and frozen at 20 °C for temporary shape, while recovering at 60 °C. The stress–strain curves of various PLA/PU blends are illustrated in Fig. 13. The materials showed slight differences in tensile strength at the same applied strain (20%) at the 60 °C deformation state. The stress value was noticeably decreased at 0 to 5 min because the samples were held at 60 °C for 5 min, during which the blend was in an elastic state. Afterward, the stress was increased at 7–12 min during the freezing period at 20 °C. Finally, the stress was dramatically decreased to zero when the shape recovery occurred at 60 °C. A similar mechanism was observed for the 2nd and 3rd cycle measurements.
 | ||
| Fig. 13 2d and 3d plot of stress–strain curves as a function of time and temperature of (a1), (a2) PUP-30 and (b1), (b2) PUP-50 during the structure recovery tests. | ||
The stress–strain curves from the structure recovery (dog bone shape) tests are plotted as a function of temperature, as illustrated in Fig. 13. Structure recovery is classified into 4 stages.53 In the initial stage (I) of the 1st cycle, after the sample was heated from 20 to 60 °C, loading stress of 1.6 MPa was applied to elongate the samples to 20% elongation, for PUP-30 in Fig. 13(a1) and (a2). The temperature was then decreased from 60 to 20 °C at stage II with a load reduced from 1.6 to 1.2 MPa, while the strain slightly dropped to 18%. At stage III, the sample was unloaded from 1.2 to 0 MPa at 20 °C with an unchanged strain of 18%. In the final stage IV, the temperature was increased from 20 to 60 °C, leading to a sharp decrease in the strain from 18 to 0.1%, almost similar to the original level before stage I. These results contribute to 99.5% of the structure recovery. A similar observation was observed when the 2nd and 3rd recovery tests were performed. The results in the 2nd cycle indicate that the loading stress of 1.5 MPa was employed to obtain 20% strain in stage I. At stage II, as the temperature was reduced from 60 to 20 °C, the stress decreased from 1.5 to 1.3 MPa, reducing strain from 20 to 18.3%. This strain was maintained in stage III, then reduced to 0.1% at stage IV, reflecting the recovery of 99.5%. In the 3rd cycle, the loading stress was reduced to 1.4 MPa for deforming to 20% strain in stage I. Interestingly, the stress increased from 1.4 to 1.6 MPa in stages II and III, indicating the strain hardening of PLA domains at 20 °C, while the strain reduced from 20 to 18.6%. Finally, the strain reduced from 18.6 to 0.24% at 60 °C in stage IV, attributing to structure recovery of 98.8%. When the PUP content was increased, PUP-50 showed a similar trend of structure recovery within 3 cycles.
The maximum stress at each measurement cycle was observed in stage II, during the cooling step, to 20 °C. In PUP-30, the maximum stress increased from 1.2 MPa in the 1st cycle to 1.3 and 1.6 MPa in cycles 2 and 3, respectively. In contrast, the corresponding value remained significantly unchanged at around 1.0 MPa for PUP-50. The higher starting maximum stress value is due to the lower PUP content in PUP-30. The increase in the value is likely because of the strain hardening of the PLA matrix during the freezing temperature, which becomes insignificant when the content of the elastic PU domains increases to 50%.
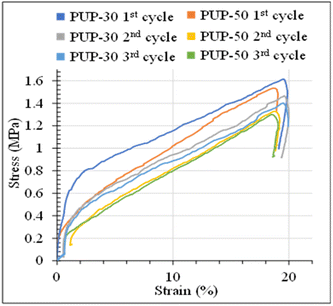
The stress–strain curves of PUP-30 and PUP-50 samples during the structure recovery experiments at 60 °C, with an applied strain of 20%, are examined in Fig. 14. Compared to the results at room temperature, no apparent yield point or necking behavior was observed at 60 °C. The deformation at a high temperature above the Tg of materials caused the polymer chains to dislocate from the crystalline domains and resulting in ease to move with a lower degree of molecular orientation.52 The stress–strain curves showed a high modulus region during the linear elastic region, with a reflection point where the tangent modulus decreased. This reflects no plastic deformation due to higher chain flexibility at this temperature. The stress value was higher in the first cycle and gradually declined because of the increase in residual stress imposed on the materials in the earlier cycles. The stress values of PUP-30 were higher than PUP-50 due to its lower content of elastic PUP.
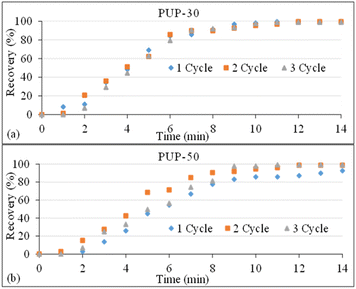
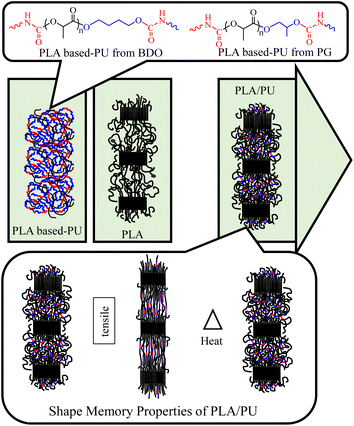
The results on structure recovery efficiency with time dependence of PUP-30 and PUP-50 are shown in Fig. 15. The blends showed similar recovery trends from the 1st to 3rd cycle. Apparent changes in the structure recovery were observed from 0 to 6 min for PUP-30, where the recovery was more significant than 80%. A recovery of as high as 99.5% was obtained at 14 min for the 1st cycle and decreased to 98.8% for the 3rd cycle. When the PUP content was increased for PUP-50, the recovery of more than 80% was obtained at 8 min and further increased to 99% at 14 min. Interestingly, the recovery efficiency increased with the recovery cycle, with values of 92.5, 98.6, and 99.0%, for the 1st, 2nd, and 3rd cycles, respectively. This indicates that when the blend is dominated by the elastic PUP domains, enhancements in the recovery efficiency can be obtained by the strain hardening process at a temperature slightly higher than the Tg of the PLA matrix. The shape recovery mechanism of this PLA/PU blend system is proposed in Fig. 16. Insights into this mechanism are crucial in the industrial fabrication of the material systems to further enhance their mechanical properties.
In comparison with other PLA blends previously reported in the literatures, the PLA/PU blends developed in this work show superior enhancements in mechanical properties, especially toughness and flexibility, with excellent shape memory property. More over, the PLA-based PU starting materials, alcoholized PLA diols, can be the products from a sustainable upcycling process of post-consumer waste PLA. The treatment temperature of PLA/PU blends to proceed the recovery is slightly above Tg of the PLA matrix, which is much lower than that reported in the past literatures, e.g., PLA/TPU blends (80–160 °C).52,54 The mechanical strength and toughness of the blend materials in this work are better than PLA/PBS blends55 and PLA/PHA blends.56 Most importantly, the shape memory property of these blends is significantly superior than previous observations.54,57,58
3. Experimental
3.1 Materials
Polylactide (PLLA, 4043D, Mw ∼150![[thin space (1/6-em)]](https://www.rsc.org/images/entities/char_2009.gif) 000 g mol−1) was purchased from NatureWorks. 1,4-butanediol (BDO) (>99%) and 1,6-diisocyanatohexane (HDI) (>99%) were supplied by Acros Organics. Propylene glycol (PG) (99.5%) and toluene were purchased from Carlo Erba. Stannous octoate (SnOct2) (>99%) catalyst, toluene (>99%), and tetrahydrofuran (THF) were obtained from Sigma-Aldrich. All chemicals were used without further purification.
000 g mol−1) was purchased from NatureWorks. 1,4-butanediol (BDO) (>99%) and 1,6-diisocyanatohexane (HDI) (>99%) were supplied by Acros Organics. Propylene glycol (PG) (99.5%) and toluene were purchased from Carlo Erba. Stannous octoate (SnOct2) (>99%) catalyst, toluene (>99%), and tetrahydrofuran (THF) were obtained from Sigma-Aldrich. All chemicals were used without further purification.
3.2 Alcoholysis of PLA resin
Alcoholysis of PLA resin was conducted in a microwave reactor (Discover SP series, CEM Matthews NC, USA) using BDO and PG, according to the procedure previously described.15–17 The PLA/alcohol feed ratio was fixed at 6![[thin space (1/6-em)]](https://www.rsc.org/images/entities/char_2009.gif) :
:![[thin space (1/6-em)]](https://www.rsc.org/images/entities/char_2009.gif) 1 wt/wt in a non-catalyst system. The samples are coded as LBDO61 and LPG61, according to the types of starting alcohols. The reactions were conducted at 240 °C under a self-generated pressure (<250 PSI) for 10 min. The alcoholized PLA products were then dried overnight in an oven at 80 °C. The chemical structures and compositions of the alcoholized PLA products were characterized by gel permeation chromatography (GPC) and proton nuclear magnetic resonance (1H-NMR) spectroscopy, as summarized in Table 4. The product mixtures contain PLA-OH with medium molecular weight (MW) ranging from 2720 to 5100 g mol−1 and unreacted alcohol of around 2.9 to 9.0 wt%.
1 wt/wt in a non-catalyst system. The samples are coded as LBDO61 and LPG61, according to the types of starting alcohols. The reactions were conducted at 240 °C under a self-generated pressure (<250 PSI) for 10 min. The alcoholized PLA products were then dried overnight in an oven at 80 °C. The chemical structures and compositions of the alcoholized PLA products were characterized by gel permeation chromatography (GPC) and proton nuclear magnetic resonance (1H-NMR) spectroscopy, as summarized in Table 4. The product mixtures contain PLA-OH with medium molecular weight (MW) ranging from 2720 to 5100 g mol−1 and unreacted alcohol of around 2.9 to 9.0 wt%.
| Code | Alcoholized PLA (GPC) | PU feed compositions | |||||||
|---|---|---|---|---|---|---|---|---|---|
| Alcoholized PLA (1H-NMR) | HDI (mol) | PLA-OH![[thin space (1/6-em)]](https://www.rsc.org/images/entities/char_2009.gif) : :![[thin space (1/6-em)]](https://www.rsc.org/images/entities/char_2009.gif) HDI HDI![[thin space (1/6-em)]](https://www.rsc.org/images/entities/char_2009.gif) : :![[thin space (1/6-em)]](https://www.rsc.org/images/entities/char_2009.gif) BDO molar ratio BDO molar ratio |
|||||||
| Sample | Mn (g mol−1) | Mw (g mol−1) | Mw/Mn | PLA-OH (mol) | Unreacted alcohol (mol) % | ||||
| PU1 | LBDO61 | 1930 | 5100 | 2.65 | 0.05 | 0.0045 | 9.0 | 0.05 | 0.84![[thin space (1/6-em)]](https://www.rsc.org/images/entities/char_2009.gif) : :![[thin space (1/6-em)]](https://www.rsc.org/images/entities/char_2009.gif) 1 1![[thin space (1/6-em)]](https://www.rsc.org/images/entities/char_2009.gif) : :![[thin space (1/6-em)]](https://www.rsc.org/images/entities/char_2009.gif) 0.08 0.08 |
| PU2 | LBDO61 | 1930 | 5100 | 2.65 | 0.05 | 0.0045 | 9.0 | 0.06 | 0.73![[thin space (1/6-em)]](https://www.rsc.org/images/entities/char_2009.gif) : :![[thin space (1/6-em)]](https://www.rsc.org/images/entities/char_2009.gif) 1 1![[thin space (1/6-em)]](https://www.rsc.org/images/entities/char_2009.gif) : :![[thin space (1/6-em)]](https://www.rsc.org/images/entities/char_2009.gif) 0.07 0.07 |
| PUP | LPG61 | 1210 | 2720 | 2.58 | 0.07 | 0.0020 | 2.9 | 0.07 | 0.94![[thin space (1/6-em)]](https://www.rsc.org/images/entities/char_2009.gif) : :![[thin space (1/6-em)]](https://www.rsc.org/images/entities/char_2009.gif) 1 1![[thin space (1/6-em)]](https://www.rsc.org/images/entities/char_2009.gif) : :![[thin space (1/6-em)]](https://www.rsc.org/images/entities/char_2009.gif) 0.03 0.03 |
3.3 Preparation of PLA-based polyurethanes
The alcoholized PLA, containing specific amounts of PLA-OH and unreacted alcohol, was used as a starting material to prepare elastomeric PLA-based polyurethanes (PU), as summarized in Table 4. Essentially, alcoholized PLA (30 g), SnOct2 (0.15 g or 0.5 wt%) catalyst, and toluene (200 mL) were mixed in a round bottom flask. The mixture was then heated at 90 °C for 20 min until completely dissolved. The calculated amounts of HDI and BDO chain extender were added to the mixture, corresponding to the total hydroxyl contents from PLA-OH and unreacted alcohols in each system to generate PU1, PU2, and PUP samples. The mixture was continuously stirred at 90 °C for 5 h. The PU1 and PU2 samples were obtained from LBDO61, while PUP was obtained from LPG61. The resulting highly viscous PU suspensions in toluene were cast on a glass surface and dried overnight in an oven at 60 °C to remove the toluene residues.3.4 PLA/PLA-based PU blends
The resulting elastomeric PLA-based PUs were used as toughening agents to blend with neat PLA resin using a CT internal mixer (MX105-D40L50) at 190 °C at a rotor speed of 50 rpm. PLA pellets were melted for 8 min in the internal mixer, followed by adding the respective PUs, i.e., PU1, PU2, and PUP. The PLA/PUs weight ratio was varied from 100/0 to 30/70. The samples are coded with the name of the PU and its blend content, e.g., PU1-30. The melt blending step was completed within 15 min after reaching a constant torque. The blend was dried in an oven for 30 min and then compressed into thin sheets with a thickness of ∼0.20 mm, as summarized in Table 5. Finally, the PLA/PU sheets were cut into a specimen size (150 mm × 15 mm) for a fixed gauge length of 100 mm for tensile tests.| Sample | PLA/PU (wt/wt) | Mechanical properties | ||
|---|---|---|---|---|
| Tensile strength (MPa) | Elongation (%) | Modulus (MPa) | ||
| PLA | 100/0 | 60.5 ± 3.1 | 3.1 ± 0.2 | 2480 ± 40 |
| PU1 | 0/100 | 1.9 ± 0.1 | 415 ± 15.8 | 2 ± 0.3 |
| PU1-10 | 90/10 | 53.9 ± 3.0 | 3.0 ± 0.1 | 2323 ± 128 |
| PU1-30 | 70/30 | 34.6 ± 2.6 | 26.3 ± 2.1 | 1747 ± 86 |
| PU1-50 | 50/50 | 14.6 ± 0.7 | 83.0 ± 13.3 | 573 ± 97 |
| PU1-70 | 30/70 | 8.4 ± 0.5 | 136.0 ± 12.4 | 133 ± 49 |
![[thin space (1/6-em)]](https://www.rsc.org/images/entities/char_2009.gif) |
||||
| PU2 | 0/100 | 5.5 ± 0.5 | 216.1 ± 26.1 | 67 ± 13 |
| PU2-10 | 90/10 | 52.7 ± 1.1 | 3.8 ± 0.3 | 2113 ± 21 |
| PU2-30 | 70/30 | 31.1 ± 2.3 | 5.1 ± 1.9 | 1575 ± 163 |
| PU2-50 | 50/50 | 8.7 ± 0.4 | 22.9 ± 1.5 | 593 ± 59 |
| PU2-70 | 30/70 | 2.6 ± 0.4 | 137.9 ± 45.8 | 49 ± 27 |
![[thin space (1/6-em)]](https://www.rsc.org/images/entities/char_2009.gif) |
||||
| PUP | 0/100 | 2.0 ± 0.1 | 487.0 ± 11.1 | 3.7 ± 4 |
| PUP-10 | 90/10 | 62.2 ± 1.2 | 3.7 ± 0.1 | 2330 ± 20 |
| PUP-30 | 70/30 | 47.3 ± 1.9 | 7.4 ± 1.9 | 2040 ± 90 |
| PUP-50 | 50/50 | 26.8 ± 0.5 | 62.8 ± 1.6 | 1727 ± 55 |
| PUP-70 | 30/70 | 10.7 ± 0.8 | 102.2 ± 12.2 | 1037 ± 31 |
3.5 Characterization
Fourier transform infrared (FTIR) spectroscopy in an attenuated total reflectance (ATR) mode was employed to determine the degree of ester bond scissions and the urethane formation mechanisms. The technique was also used to quantitatively analyze the contents of reacted and unreacted alcohols in the alcoholysis. All spectra were recorded on a Nicolet iS5 spectrometer at a resolution of 2 cm−1 by coadding 64 scans. Differential scanning calorimetry (DSC) was employed to examine the thermal properties of PLA-based PU samples, and PLA/PU blends on a DSC822e Mettler Toledo. The samples were heated from −20 to 200 °C under a nitrogen atmosphere at a flow rate of 60 mL min−1. Thermogravimetric analysis (TGA) was conducted on a Mettler Toledo instrument to determine the sample's thermal stability and compositions. All PLA/PLA-based PU blends were heated from 30 to 800 °C under a nitrogen atmosphere with a 60 mL min−1 flow rate. The crystallinity and amorphous contents were examined using X-ray diffraction (XRD) (RIGAKU TTRAX III). All samples were analyzed using Cu Kα radiation at 30 mA and 40 kV, from 4 to 80° at a scan rate of 2° min−1. The cryogenic crack morphology of all blend samples was observed on a field-emission scanning electron microscopy (FE-SEM) (SU5000) using field emission and an accelerating voltage of 10 kV. The samples were prepared by cracking after dipping in liquid nitrogen for 10 min, followed by gold coating in a vacuum oven before measurements.3.6 Mechanical properties tests
Mechanical properties of PUs and PLA/PU blend samples were measured on a tensile machine (Tinius Olsen H5KT) equipped with a load cell of 1000 N, at a 50 mm min−1 speed. The sample sheets were cut into a standard size of 150 mm × 15 mm for a maximum gauge length of 100 mm. The tensile test was conducted at room temperature (25 °C) with at least 5 repeats for each sample.3.7 Heat treatments and shape recovery
The shape-memory property of PLA/PU blend samples was examined by selecting PUP-30 and PUP-50. The samples were prepared in a dog-bone shape with a standard dimension of 63 mm × 3.5 mm × 3.63 mm, for a fixed gauge length of 7.5 mm. The specimen was analyzed on a Shimadzu AGX-V, with a temperature controller program at a 20 °C min−1 heating rate. The specimen was heated to 60 °C and stressed at a 50 mm min−1 speed to 20% strain with a 5 min holding time. The sample was cooled at 20 °C for 5 min to observe the fixing shape property. Finally, the sample was heated to 60 °C, followed by a release of the applied load at a 0.5 mm min−1 speed for a shape recovery mechanism. The shape memory test was repeated for at least 3 cycles.The shape-memory property of PUP-50 film sample was also examined on a tensile machine (Tinius Olsen H5KT) at fixed elongations of 10 and 20%. The film was cut to 80 mm × 10 mm × 0.20 mm for a gauge length of 30 mm. The sample was stressed at 20 mm min−1 speed at 25 °C. The fixing shape at 25 °C was calculated using eqn (1). The shape recovery was observed after heating the sample at 50 °C for 5 min. The recovery efficiency was calculated by eqn (2).
| Fixing shape(Rf, %) = FL × 100/L | (1) |
| Shape-memory(Rr, %) = RL × 100/L | (2) |
4. Conclusions
A process for sizing down and functionalizing high MW PLA resin is successfully developed to convert the polymer to value-added PLA-OH with optimum MW, with a lower cost than a bottom-up synthesis process. The process utilizes alcoholysis with BDO and PG in a microwave reactor. The product mixtures containing PLA-OH and excess diols react with HDI to produce elastomeric PLA-based polyurethanes (PU), with excellent elongation at break as high as 487%. The resulting PLA-based PUs are used as a toughening agent for brittle and rigid PLA resin by a melt-blending technique. Large improvements in toughness can be achieved. An increase in elongation at break to 160% with 29.8 MPa tensile strength was observed in a blend containing 70% PUP. The fracture morphology indicates that the blends have high interfacial interaction and adhesion between the PLA-based PU disperse phase and the PLA matrix, due to their improved compatibility. Additionally, the PLA/PU blends exhibit a high shape recovery efficiency. The insights into these recovery mechanisms are crucial in the industrial fabrication of the material systems to further enhance their mechanical properties. These flexible PLA/PUs blends are promising for various applications, especially as filaments for 3D bio-printing.Author contributions
Conceptualization, M.O. and P.O.; methodology, C.E., B.N. and P.O.; formal analysis, C.E., B.N., M.O., A.P. and P.O.; investigation, C.E. and B.N.; resources, M.O., A.P. and P.O.; writing – original draft preparation, C.E. and B.N.; writing – review and editing, M.O., A.P. and P.O.; visualization, B.N. and P.O.; supervision, P.O.; funding acquisition, M.O., A.P. and P.O. All authors have read and agreed to the published version of the manuscript.Conflicts of interest
The authors declare no conflict of interest.Acknowledgements
This work is supported by the Thailand Science Research and Innovation Fundamental Fund. The partial support from Thammasat university through the Center of Excellence in Materials and Plasma Technology (CoE M@P Tech), a Thammasat University-Fast Track grant, and a Thammasat Postdoctoral Fellow grant to B.N. are gratefully acknowledged. C. E. is grateful for the scholarship support from the Excellent Foreign Student (EFS) scholarship from SIIT.Notes and references
- K. J. Jem and B. Tan, The development and challenges of poly (lactic acid) and poly (glycolic acid), Adv. Ind. Eng. Polym. Res., 2020, 3, 60–70 Search PubMed.
- J. Lunt, Large-scale production, properties and commercial applications of polylactic acid polymers, Polym. Degrad. Stab., 1998, 59, 145–152 CrossRef CAS.
- K. Shibata, D. M. Flores, G. Kobayashi and K. Sonomoto, Direct l-lactic acid fermentation with sago starch by a novel amylolytic lactic acid bacterium, Enterococcus faecium, Enzyme Microb. Technol., 2007, 41, 149–155 CrossRef CAS.
- J. J. Kolstad, E. T. H. Vink, B. De Wilde and L. Debeer, Assessment of anaerobic degradation of Ingeo™ polylactides under accelerated landfill conditions, Polym. Degrad. Stab., 2012, 97, 1131–1141 CrossRef CAS.
- P. K. Samantaray, A. Little, A. M. Wemyss, E. Iacovidou and C. Wan, Design and Control of Compostability in Synthetic Biopolyesters, ACS Sustainable Chem. Eng., 2021, 9, 9151–9164 CrossRef CAS.
- E. Castro-Aguirre, F. Iñiguez-Franco, H. Samsudin, X. Fang and R. Auras, Poly(lactic acid)—mass production, processing, industrial applications, and end of life, Adv. Drug Delivery Rev., 2016, 107, 333–366 CrossRef CAS PubMed.
- S. M. Al-Salem, P. Lettieri and J. Baeyens, Recycling and recovery routes of plastic solid waste (PSW): a review, Waste Manage., 2009, 29, 2625–2643 CrossRef CAS PubMed.
- K. Hirao, Y. Nakatsuchi and H. Ohara, Alcoholysis of poly(l-lactic acid) under microwave irradiation, Polym. Degrad. Stab., 2010, 95, 925–928 CrossRef CAS.
- F. A. Leibfarth, N. Moreno, A. P. Hawker and J. D. Shand, Transforming polylactide into value-added materials, J. Polym. Sci., Part A: Polym. Chem., 2012, 50, 4814–4822 CrossRef CAS.
- X. Song, X. Zhang, H. Wang, F. Liu, S. Yu and S. Liu, Methanolysis of poly(lactic acid) (PLA) catalyzed by ionic liquids, Polym. Degrad. Stab., 2013, 98, 2760–2764 CrossRef CAS.
- O. Torpanyacharn, P. Sukpuang, A. Petchsuk, P. Opaprakasit and M. Opaprakasit, Curable precursors derived from chemical recycling of poly(ethylene terephthalate) and polylactic acid and physical properties of their thermosetting (co)polyesters, Polym. Bull., 2018, 75, 395–414 CrossRef CAS.
- A. Musidang and N. Jiratumnukul, Preparation of poly(lactic acid) acrylate for UV-curable coating applications, Key Eng. Mater., 2015, 659, 570–574 Search PubMed.
- A. Plichta, P. Lisowska, A. Kundys, A. Zychewicz, M. Dębowski and Z. Florjańczyk, Chemical recycling of poly(lactic acid) via controlled degradation with protic (macro)molecules, Polym. Degrad. Stab., 2014, 108, 288–296 CrossRef CAS.
- W.-J. Yi, L.-J. Li, Z. Hao, M. Jiang, C. Lu, Y. Shen and Z.-S. Chao, Synthesis of L-lactide via degradation of various telechelic oligomeric poly(L-lactic acid) intermediates, Ind. Eng. Chem. Res., 2017, 56, 4867–4877 CrossRef CAS.
- C. Eang, B. Nim, P. Sreearunothai, A. Petchsuk and P. Opaprakasit, Chemical upcycling of polylactide (PLA) and its use in fabricating PLA-based super-hydrophobic and oleophilic electrospun nanofibers for oil absorption and oil/water separation, New J. Chem., 2022, 46(31), 14933–14943 RSC.
- B. Nim and P. Opaprakasit, Quantitative analyses of products from chemical recycling of polylactide (PLA) by alcoholysis with various alcohols and their applications as healable lactide-based polyurethanes, Spectrochim. Acta, Part A, 2021, 255, 119684 CrossRef CAS PubMed.
- B. Nim, M. Opaprakasit, A. Petchsuk and P. Opaprakasit, Microwave-assisted chemical recycling of polylactide (PLA) by alcoholysis with various diols, Polym. Degrad. Stab., 2020, 181, 109363 CrossRef CAS.
- P. Coszach, J. C. Bogaert and J. Willocq, Chemical recycling of PLA by alcoholysis, US-8481675-B2, 2013.
- R. Petrus, D. Bykowski and P. Sobota, Solvothermal alcoholysis routes for recycling polylactide waste as lactic acid esters, ACS Catal., 2016, 6, 5222–5235 CrossRef CAS.
- J. E. Mark, L. Lu and A. G. Mikos, Poly(lactic acid), in Polymer data handbook, Oxford University Press, 1999 Search PubMed.
- M. Hakkarainen, Áliphatic polyesters: abiotic and biotic degradation and degradation products', degradable aliphatic polyesters, in Advances in polymer science, Springer-Verlag Berlin Heidelberg, 2002, vol. 157, pp. 113–138 Search PubMed.
- R. A. Auras, L. T. Lim, S. E. M. Selke and H. Tsuji, Poly(lactic acid): synthesis, structures, properties, processing, and applications, Wiley, 2010 Search PubMed.
- G. Perego and G. D. Cella, Poly(Lactic Acid), 2010, 141–153, DOI:10.1002/9780470649848.ch11.
- P. Sukpuang, M. Opaprakasit, A. Petchsuk, P. Tangboriboonrat, P. Sojikul and P. Opaprakasit, Polylactic acid glycolysate as a cross-linker for epoxidized natural rubber, J. Elastomers Plast., 2016, 48, 105–121 CrossRef CAS.
- P. Sukpuang, M. Opaprakasit, A. Petchsuk and P. Opaprakasit, Toughness enhancement of polylactic acid by employing lycolyzed polylactic acid-cured epoxidized natural rubber, Adv. Mater. Res., 2014, 1025–1026, 580–584 Search PubMed.
- A. Petchsuk, S. Buchatip, W. Supmak, M. Opaprakasit and P. Opaprakasit, Preparation and properties of multi-branched poly(D-lactide) derived from polyglycidol and its stereocomplex blends, Express Polym. Lett., 2014, 8, 779–789 CrossRef.
- P. Sriromreun, M. Opaprakasit, A. Petchsuk and P. Opaprakasit, Synthesis and characterization of degradable poly(ethylene terephthalate-co-lactic acid) and its blends, Adv. Mater. Res., 2008, 55–57, 789–792 CAS.
- M. Namkajorn, A. Petchsuk, M. Opaprakasit and P. Opaprakasit, Synthesis and characterization of PLA-based aliphatic-aromatic copolyesters: effect of diols, Adv. Mater. Res., 2008, 55–57, 785–788 CAS.
- R. Wang, S. Wang, Y. Zhang, C. Wan and P. Ma, Toughening modification of PLLA/PBS blends via in situ compatibilization, Polym. Eng. Sci., 2009, 49, 26–33 CrossRef CAS.
- F. Yu and H.-X. Huang, Simultaneously toughening and reinforcing poly(lactic acid)/thermoplastic polyurethane blend via enhancing interfacial adhesion by hydrophobic silica nanoparticles, Polym. Test., 2015, 45, 107–113 CrossRef CAS.
- E. Ruckenstein and Y. Yuan, Molten ring-open copolymerization of L-lactide and cyclic trimethylene carbonate, J. Appl. Polym. Sci., 1998, 69, 1429–1434 CrossRef CAS.
- Y. Shikinami and M. Okuno, Bioresorbable devices made of forged composites of hydroxyapatite (HA) particles and poly-L-lactide (PLLA): part I. basic characteristics, Biomaterials, 1999, 20, 859–877 CrossRef CAS PubMed.
- Y. Li and H. Shimizu, Toughening of Polylactide by melt blending with a biodegradable poly(ether)urethane elastomer, Macromol. Biosci., 2007, 7, 921–928 CrossRef CAS PubMed.
- Y. Jiang, C. Yan, K. Wang, D. Shi, Z. Liu and M. Yang, Super-toughed PLA blown film with enhanced gas barrier property available for packaging and agricultural applications, Materials, 2019, 12, 1663 CrossRef CAS PubMed.
- W.-J. Si, L. Yang, Y.-X. Weng, J. Zhu and J.-B. Zeng, Poly(lactic acid)/biobased polyurethane blends with balanced mechanical strength and toughness, Polym. Test., 2018, 69, 9–15 CrossRef CAS.
- L. C. Arruda, M. Magaton, R. E. S. Bretas and M. M. Ueki, Influence of chain extender on mechanical, thermal and morphological properties of blown films of PLA/PBAT blends, Polym. Test., 2015, 43, 27–37 CrossRef CAS.
- T. Gurunathan, S. Mohanty and S. K. Nayak, Preparation and performance evaluation of castor oil-based polyurethane prepolymer/polylactide blends, J. Mater. Sci., 2014, 49, 8016–8030 CrossRef CAS.
- X.-Z. Mo, F.-X. Wei, D.-F. Tan, J.-Y. Pang and C.-B. Lan, The compatibilization of PLA-g-TPU graft copolymer on polylactide/thermoplastic polyurethane blends, J. Polym. Res., 2020, 27, 1–13 CrossRef.
- W. Shuhua, X. Qiaoli, L. Fen, D. Jinming, J. Husheng and X. Bingshe, Preparation and properties of cellulose-based carbon microsphere/poly (lactic acid) composites, J. Compos. Mater., 2014, 48, 1297–1302 CrossRef.
- M. Raja, S. H. Ryu and A. Shanmugharaj, Thermal, mechanical and electroactive shape memory properties of polyurethane (PU)/poly(lactic acid)(PLA)/CNT nanocomposites, Eur. Polym. J., 2013, 49, 3492–3500 CrossRef CAS.
- H. Jeong, J. Rho, J.-Y. Shin, D. Y. Lee, T. Hwang and K. J. Kim, Mechanical properties and cytotoxicity of PLA/PCL films, Biomed. Eng. Lett., 2018, 8, 267–272 CrossRef PubMed.
- Z. Ren, L. Dong and Y. Yang, Dynamic mechanical and thermal properties of plasticized poly(lactic acid), J. Appl. Polym. Sci., 2006, 101, 1583–1590 CrossRef CAS.
- V. S. G. Silverajah, N. Ibrahim, W. Yunus, H. Hassan and B. W. Chieng, A comparative study on the mechanical, thermal and morphological characterization of poly(lactic acid)/epoxidized palm oil blend, Int. J. Mol. Sci., 2012, 13, 5878–5898 CrossRef CAS PubMed.
- W. Wang, P. Ping, H. Yu, X. Chen and X. Jing, Synthesis and characterization of a novel biodegradable, thermoplastic polyurethane elastomer, J. Polym. Sci., Part A: Polym. Chem., 2006, 44, 5505–5512 CrossRef CAS.
- M. Raja, A. M. Shanmugharaj, S. H. Ryu and J. Subha, Influence of metal nanoparticle decorated CNTs on polyurethane based electro active shape memory nanocomposite actuators, Mater. Chem. Phys., 2011, 129, 925–931 CrossRef CAS.
- S.-D. Lee, O.-J. Kwon, B. C. Chun, J. W. Cho and J.-S. Park, Effects of mechanical strain on the electric conductivity of multiwalled carbon nanotube (MWCNT)/polyurethane (PU) composites, Fibers Polym., 2009, 10, 71–76 CrossRef CAS.
- R. Kusumi, S. Teranishi, F. Kimura, M. Wada, T. Kimura, Y. Horikawa and T. Kawai, Crystal orientation of poly (L-lactic acid) induced by magnetic alignment of a nucleating agent, Polymers, 2018, 10, 653 CrossRef PubMed.
- K. Wasanasuk, K. Tashiro, M. Hanesaka, T. Ohhara, K. Kurihara, R. Kuroki, T. Tamada, T. Ozeki and T. Kanamoto, Crystal structure analysis of poly(L-lactic acid) α Form on the basis of the 2-dimensional wide-angle synchrotron X-ray and neutron diffraction measurements, Macromolecules, 2011, 44, 6441–6452 CrossRef CAS.
- H. Tsuji, Poly(lactide) stereocomplexes: formation, structure, properties, degradation, and applications, Macromol. Biosci., 2005, 5, 569–597 CrossRef CAS PubMed.
- T. Okihara, M. Tsuji, A. Kawaguchi, K.-I. Katayama, H. Tsuji, S.-H. Hyon and Y. Ikada, Crystal structure of stereocomplex of poly (L-lactide) and poly (D-lactide), J. Macromol. Sci., Part B: Phys., 1991, 30, 119–140 CrossRef CAS.
- T. Farid, V. Herrera and O. Kristiina, IOP Conf. Ser.: Mater. Sci. Eng., 2018, 369, 012031 Search PubMed.
- S.-M. Lai and Y.-C. Lan, Shape memory properties of melt-blended polylactic acid (PLA)/thermoplastic polyurethane (TPU) bio-based blends, J. Polym. Res., 2013, 20, 1–8 CAS.
- T. Sui, E. Salvati, H. Zhang, K. Nyaza, F. S. Senatov, A. I. Salimon and A. M. Korsunsky, Probing the complex thermo-mechanical properties of a 3D-printed polylactide-hydroxyapatite composite using in situ synchrotron X-ray scattering, J. Adv. Res., 2019, 16, 113–122 CrossRef CAS PubMed.
- S.-M. Lai, W.-L. Wu and Y.-J. Wang, Annealing effect on the shape memory properties of polylactic acid (PLA)/thermoplastic polyurethane (TPU) bio-based blends, J. Polym. Res., 2016, 23, 99 CrossRef.
- D. Lascano, L. Quiles-Carrillo, R. Balart, T. Boronat and N. Montanes, Toughened poly (lactic acid)—PLA formulations by binary blends with poly (butylene succinate-co-adipate)—PBSA and their shape memory behaviour, Materials, 2019, 12, 622 CrossRef CAS PubMed.
- J. C. C. Yeo, X. Y. Ong, J. J. Koh, J. Kong, X. Zhang, W. Thitsartarn, Z. Li and C. He, Dual-phase poly (lactic acid)/poly (hydroxybutyrate)-rubber copolymer as high-performance shape memory materials, ACS Appl. Polym. Mater., 2020, 3, 389–399 CrossRef.
- X. Jing, H.-Y. Mi, X.-F. Peng and L.-S. Turng, The morphology, properties, and shape memory behavior of polylactic acid/thermoplastic polyurethane blends, Polym. Eng. Sci., 2015, 55, 70–80 CrossRef CAS.
- M. Amini and S. Wu, Designing a polymer blend nanocomposite with triple shape memory effects, Compos. Commun., 2021, 23, 100564 CrossRef.
| This journal is © The Royal Society of Chemistry 2022 |

