 Open Access Article
Microstructure and high frequency electromagnetic parameters of the soft/soft (CoFe2O4)x![[thin space (1/6-em)]](https://www.rsc.org/images/entities/h2_char_2009.gif) :
:![[thin space (1/6-em)]](https://www.rsc.org/images/entities/h2_char_2009.gif) (Ni0.4Cu0.2Zn0.4Fe2O4)y nanocomposites
(Ni0.4Cu0.2Zn0.4Fe2O4)y nanocomposites
Alex V. Trukhanov *ab,
Munirah A. Almessierecd,
Abdulhadi Baykale,
Yassine Slimani
 c,
Ekaterina L. Trukhanovaab,
Daria I. Tishkevich
 ab,
Svetlana V. Podgornayaa,
Egor Kaniukova and
Sergei V. Trukhanovab
aNational University of Science and Technology MISiS, 119049 Moscow, Russia
bScientific-Practical Materials Research Centre of NAS of Belarus, 220072 Minsk, Belarus. E-mail: truhanov86@mail.ru
cDepartment of Biophysics, Institute for Research and Medical Consultations (IRMC), Imam Abdulrahman Bin Faisal University, P. O. Box 1982, Dammam 31441, Saudi Arabia
dDepartment of Physics, College of Science, Imam Abdulrahman Bin Faisal University, P. O. Box 1982, Dammam 31441, Saudi Arabia
eDepartment of Nanomedicine Research, Institute for Research and Medical Consultations (IRMC), Imam Abdulrahman Bin Faisal University, P. O. Box 1982, Dammam 31441, Saudi Arabia
First published on 29th November 2022
Abstract
The soft/soft (CoFe2O4)x![[thin space (1/6-em)]](https://www.rsc.org/images/entities/char_2009.gif) :
:![[thin space (1/6-em)]](https://www.rsc.org/images/entities/char_2009.gif) (Ni0.4Cu0.2Zn0.4Fe2O4)y (CFOx/NCZOy) nanocomposites (NCs) based on spinel ferrites were produced by the sol–gel method with varying phase's ratio (x
(Ni0.4Cu0.2Zn0.4Fe2O4)y (CFOx/NCZOy) nanocomposites (NCs) based on spinel ferrites were produced by the sol–gel method with varying phase's ratio (x![[thin space (1/6-em)]](https://www.rsc.org/images/entities/char_2009.gif) :
:![[thin space (1/6-em)]](https://www.rsc.org/images/entities/char_2009.gif) y = 0
y = 0![[thin space (1/6-em)]](https://www.rsc.org/images/entities/char_2009.gif) :
:![[thin space (1/6-em)]](https://www.rsc.org/images/entities/char_2009.gif) 1; 1
1; 1![[thin space (1/6-em)]](https://www.rsc.org/images/entities/char_2009.gif) :
:![[thin space (1/6-em)]](https://www.rsc.org/images/entities/char_2009.gif) 1; 2
1; 2![[thin space (1/6-em)]](https://www.rsc.org/images/entities/char_2009.gif) :
:![[thin space (1/6-em)]](https://www.rsc.org/images/entities/char_2009.gif) 1; 3
1; 3![[thin space (1/6-em)]](https://www.rsc.org/images/entities/char_2009.gif) :
:![[thin space (1/6-em)]](https://www.rsc.org/images/entities/char_2009.gif) 1; 1
1; 1![[thin space (1/6-em)]](https://www.rsc.org/images/entities/char_2009.gif) :
:![[thin space (1/6-em)]](https://www.rsc.org/images/entities/char_2009.gif) 3; 1
3; 1![[thin space (1/6-em)]](https://www.rsc.org/images/entities/char_2009.gif) :
:![[thin space (1/6-em)]](https://www.rsc.org/images/entities/char_2009.gif) 2 and 1
2 and 1![[thin space (1/6-em)]](https://www.rsc.org/images/entities/char_2009.gif) :
:![[thin space (1/6-em)]](https://www.rsc.org/images/entities/char_2009.gif) 0). All NCs consisted of 2 single phases (initial spinels) without any impurities and the absence of chemical interaction between phases. Structural features were investigated and analyzed. The varying of the structural parameters was non-linear and correlated well with the lattice parameter for initial components. There were two maxima observed for all NCs on particle size distribution. It was demonstrated that an increase in the CFO content leads to an increase in the most probable size of the coarse fraction and a decrease in the most probable grain size of the fine fraction. An increase in the NCZO content leads to a decrease in the average size of both fine and coarse fractions. This is obviously due to the large number of defects in the NCZO crystal lattice. The high frequency electromagnetic parameters (real and imaginary parts of the permittivity and permeability, reflection losses) were analyzed in the range of 2–10 GHz. The increase of the energy losses with frequency increase was observed. The nature of the attenuation of the reflected energy associated with the electromagnetic absorption processes due to magnetic losses. Maximal values of the electromagnetic absorption were observed for CFO2/NCZO1 (−18.9 dB). This correlates with the lattice parameters of the composites. The result of the electromagnetic characteristics opens broad perspectives for practical applications such kind of NCs for antenna technology (5G technology) and for electromagnetic absorbing coatings.
0). All NCs consisted of 2 single phases (initial spinels) without any impurities and the absence of chemical interaction between phases. Structural features were investigated and analyzed. The varying of the structural parameters was non-linear and correlated well with the lattice parameter for initial components. There were two maxima observed for all NCs on particle size distribution. It was demonstrated that an increase in the CFO content leads to an increase in the most probable size of the coarse fraction and a decrease in the most probable grain size of the fine fraction. An increase in the NCZO content leads to a decrease in the average size of both fine and coarse fractions. This is obviously due to the large number of defects in the NCZO crystal lattice. The high frequency electromagnetic parameters (real and imaginary parts of the permittivity and permeability, reflection losses) were analyzed in the range of 2–10 GHz. The increase of the energy losses with frequency increase was observed. The nature of the attenuation of the reflected energy associated with the electromagnetic absorption processes due to magnetic losses. Maximal values of the electromagnetic absorption were observed for CFO2/NCZO1 (−18.9 dB). This correlates with the lattice parameters of the composites. The result of the electromagnetic characteristics opens broad perspectives for practical applications such kind of NCs for antenna technology (5G technology) and for electromagnetic absorbing coatings.
Introduction
Complex magnetic oxides based on transition metal ions attract great attention due to their scientific importance and practical perspectives.1–6 This is associated with a combination of unique magnetic, electrical, and optical properties and can be explained by the strong correlation between chemical composition (substitution effects, cation and anion non-stoichiometry), structural peculiarities, and physical properties. Among the magnetic complex oxides, the most interesting objects are iron oxides–ferrites with different structures.7 There are 4 main classes of different ferrite types: orthoferrites with perovskite-like structure and general formula AFeO3 (where A – rare-earth cation),8–11 spinels with cubic structure and general formula AFe2O4 (where A – divalent cation),12–16 garnets with cubic structure and general formula A3Fe5O12 (where A – rare-earth cation from Sm–Lu range),17–19 hexaferrites with hexagonal structure and general formula AFe12O19 (where A – Ba2+, Sr2+, Pb2+ cations).20–25 These classes of ferrites have different magnetic and electrical properties. Spinels can be characterized by soft magnetic behavior (high magnetization saturation and low coercivity) with a semiconducting type of conductivity.26–28 Spinels attract attention for many reasons. This is perspective material for optical29 and sensing applications,30 for high-frequency applications (microwave absorber and magnetic recording material and for hyperthermia).31When soft and hard magnetic phases do exchange coupled with each other, an exchange-spring magnet (with high Hc and high Ms) can be produced. By adjusting the microstructure between hard and soft phases, the magnetic properties of an exchange-spring magnet can be easily tuned. Therefore, they can be used for different applications. The hard phase is difficult to reverse under the lower applied field due to its large anisotropy. But the magnetization of soft grains will be sufficiently exchange-coupled with that of the neighbouring hard grains and will align in the magnetization. So an exchange-coupled magnet nanocomposite (NC) is the combination of high saturation magnetization of the soft with high coercivity of the hard phase.32 The exchange-coupling interaction between the hard and soft magnetic phases will bring about additional flexibility and an opportunity to tailor the overall properties of the materials33 and give rise to unique physical characteristics as well as superior properties, making these NCs exceptional compared to their individual component counterparts for biomedicine, spintronics, optoelectronics, and nanoelectronics applications.34
The BHmax, which is associated with remnant magnetization, Ms, and Hc of the material, shows the energy density storage capacity of magnetic material. To improve BHmax for this purpose, exchange-spring composites are beginning to be synthesized for advanced applications.35 The exchange-coupling interaction between the hard and soft magnetic phases can improve microwave absorption capability.33
Fei et al. have been successful in synthesizing CoFe2O4/Fe3O4 exchange-spring magnets using Spark Plasma Sintering (SPS) and found the appropriate sintering temperature to be 500 °C.36,37 Safi et al. studied the role of shell thickness on the exchange spring mechanism of cobalt ferrite/iron cobalt magnetic NCs and their exchange coupled NCs exhibit a significant enhancement of the maximum energy product.38 Almessiere et al. successfully synthesized39 the hard/soft CoFe2O4/(NiSc0.03Fe1.97O4)x (0 ≤ x ≤ 5) NCs via sol–gel auto-combustion technique and investigated the supercapacitor property of the products. It was observed that the device also displayed excellent stability as it was tested for 5000 charge–discharge cycles. Wang et al.40 synthesized the hard and soft magnetic NCs of CoFe2O4/Fe3O4 through a co-precipitation route. The presence of a good exchange-coupling interaction between the hard and soft magnetic phases results in a 35% and 842% higher value of (BH)max than those of the pure CoFe2O4 at 300 K and 77, respectively. In another study,34 Almessiere et al. presented the electrical and dielectric properties of rare earth substituted hard–soft ferrite (Co0.5Ni0.5Ga0.01Gd0.01Fe1.98O4)x/(ZnFe2O4)y NCs.
The objectives of the current study are to synthesize and investigate the features of the structural parameters and microwave properties under exchange coupling in functional soft/soft (CoFe2O4)x![[thin space (1/6-em)]](https://www.rsc.org/images/entities/char_2009.gif) :
:![[thin space (1/6-em)]](https://www.rsc.org/images/entities/char_2009.gif) (Ni0.4Cu0.2Zn0.4Fe2O4)y (x
(Ni0.4Cu0.2Zn0.4Fe2O4)y (x![[thin space (1/6-em)]](https://www.rsc.org/images/entities/char_2009.gif) :
:![[thin space (1/6-em)]](https://www.rsc.org/images/entities/char_2009.gif) y = 0
y = 0![[thin space (1/6-em)]](https://www.rsc.org/images/entities/char_2009.gif) :
:![[thin space (1/6-em)]](https://www.rsc.org/images/entities/char_2009.gif) 1; 1
1; 1![[thin space (1/6-em)]](https://www.rsc.org/images/entities/char_2009.gif) :
:![[thin space (1/6-em)]](https://www.rsc.org/images/entities/char_2009.gif) 1; 2
1; 2![[thin space (1/6-em)]](https://www.rsc.org/images/entities/char_2009.gif) :
:![[thin space (1/6-em)]](https://www.rsc.org/images/entities/char_2009.gif) 1; 3
1; 3![[thin space (1/6-em)]](https://www.rsc.org/images/entities/char_2009.gif) :
:![[thin space (1/6-em)]](https://www.rsc.org/images/entities/char_2009.gif) 1; 1
1; 1![[thin space (1/6-em)]](https://www.rsc.org/images/entities/char_2009.gif) :
:![[thin space (1/6-em)]](https://www.rsc.org/images/entities/char_2009.gif) 3; 1
3; 1![[thin space (1/6-em)]](https://www.rsc.org/images/entities/char_2009.gif) :
:![[thin space (1/6-em)]](https://www.rsc.org/images/entities/char_2009.gif) 2 and 1
2 and 1![[thin space (1/6-em)]](https://www.rsc.org/images/entities/char_2009.gif) :
:![[thin space (1/6-em)]](https://www.rsc.org/images/entities/char_2009.gif) 0) or CFOx/NCZOy NCs based on nanosized spinel ferrites CoFe2O4 (CFO) and Ni0.4Cu0.2Zn0.4Fe2O4 (NCZO) with varying ratio (x
0) or CFOx/NCZOy NCs based on nanosized spinel ferrites CoFe2O4 (CFO) and Ni0.4Cu0.2Zn0.4Fe2O4 (NCZO) with varying ratio (x![[thin space (1/6-em)]](https://www.rsc.org/images/entities/char_2009.gif) :
:![[thin space (1/6-em)]](https://www.rsc.org/images/entities/char_2009.gif) y).
y).
Results and discussion
Phase composition and microstructural analysis
Fig. 1 demonstrates the features of the crystal structure of the produced CFOx/NCZOy (x![[thin space (1/6-em)]](https://www.rsc.org/images/entities/char_2009.gif) :
:![[thin space (1/6-em)]](https://www.rsc.org/images/entities/char_2009.gif) y = 0
y = 0![[thin space (1/6-em)]](https://www.rsc.org/images/entities/char_2009.gif) :
:![[thin space (1/6-em)]](https://www.rsc.org/images/entities/char_2009.gif) 1; 1
1; 1![[thin space (1/6-em)]](https://www.rsc.org/images/entities/char_2009.gif) :
:![[thin space (1/6-em)]](https://www.rsc.org/images/entities/char_2009.gif) 1; 2
1; 2![[thin space (1/6-em)]](https://www.rsc.org/images/entities/char_2009.gif) :
:![[thin space (1/6-em)]](https://www.rsc.org/images/entities/char_2009.gif) 1; 3
1; 3![[thin space (1/6-em)]](https://www.rsc.org/images/entities/char_2009.gif) :
:![[thin space (1/6-em)]](https://www.rsc.org/images/entities/char_2009.gif) 1; 1
1; 1![[thin space (1/6-em)]](https://www.rsc.org/images/entities/char_2009.gif) :
:![[thin space (1/6-em)]](https://www.rsc.org/images/entities/char_2009.gif) 3; 1
3; 1![[thin space (1/6-em)]](https://www.rsc.org/images/entities/char_2009.gif) :
:![[thin space (1/6-em)]](https://www.rsc.org/images/entities/char_2009.gif) 2, and 1
2, and 1![[thin space (1/6-em)]](https://www.rsc.org/images/entities/char_2009.gif) :
:![[thin space (1/6-em)]](https://www.rsc.org/images/entities/char_2009.gif) 0) NCs. In Fig. 1b, we can observe 6–7 intensive diffraction maximums that correspond to the spinel-like ferrite structure. The Space Group (SG) of the spinel-like ferrite structure is Fd
0) NCs. In Fig. 1b, we can observe 6–7 intensive diffraction maximums that correspond to the spinel-like ferrite structure. The Space Group (SG) of the spinel-like ferrite structure is Fd![[3 with combining macron]](https://www.rsc.org/images/entities/char_0033_0304.gif) m, which consists of bivalent cations and Fe3+ cations placed in tetrahedral (Th) and octahedral (Oh) coordination or oxygen surrounding (Fig. 1a). The main diffraction peaks that can be observed on XRD patterns correspond to the following (hkl): (202) at ∼30.4 degree; (311) at ∼35.8 degree; (222) at ∼37.3 degree; (400) at ∼43.3 degree; (422) at ∼53.6 degree; (511) at ∼57.2 degree and (440) at ∼62.9 degree. The most intensive peaks are (311) and (440). The absence of other direction maximums that do not belong to the SG: Fd
m, which consists of bivalent cations and Fe3+ cations placed in tetrahedral (Th) and octahedral (Oh) coordination or oxygen surrounding (Fig. 1a). The main diffraction peaks that can be observed on XRD patterns correspond to the following (hkl): (202) at ∼30.4 degree; (311) at ∼35.8 degree; (222) at ∼37.3 degree; (400) at ∼43.3 degree; (422) at ∼53.6 degree; (511) at ∼57.2 degree and (440) at ∼62.9 degree. The most intensive peaks are (311) and (440). The absence of other direction maximums that do not belong to the SG: Fd![[3 with combining macron]](https://www.rsc.org/images/entities/char_0033_0304.gif) m for all investigated CFOx/NCZOy composites confirmed the single phase state of each phase (CFO and NCZO) without any impurities and the absence of any chemical interaction between phases. The analysis of the XRD patterns was performed using FullProf (Rietveld's method). The lattice parameter (a), volume of the unit cell (V), and average size of crystallite (DXRD) or average size of the coherent scattering region were determined. The concentration dependences of the main structural parameters that were established from XRD data analysis are presented in Fig. 2. The DXRD value changed non-linearly. A minimum value (23.6 nm) was observed for CFO1/NCZO1 (1
m for all investigated CFOx/NCZOy composites confirmed the single phase state of each phase (CFO and NCZO) without any impurities and the absence of any chemical interaction between phases. The analysis of the XRD patterns was performed using FullProf (Rietveld's method). The lattice parameter (a), volume of the unit cell (V), and average size of crystallite (DXRD) or average size of the coherent scattering region were determined. The concentration dependences of the main structural parameters that were established from XRD data analysis are presented in Fig. 2. The DXRD value changed non-linearly. A minimum value (23.6 nm) was observed for CFO1/NCZO1 (1![[thin space (1/6-em)]](https://www.rsc.org/images/entities/char_2009.gif) :
:![[thin space (1/6-em)]](https://www.rsc.org/images/entities/char_2009.gif) 1) – Fig. 2a. It is interesting that the DXRD of the NCZO (41.1 nm) is larger than that of the CFO (30.3 nm). Crystallite size for CFOx/NCZOy composites correlates well with the size of the initial components (CFO and NCZO) and their ratio (x
1) – Fig. 2a. It is interesting that the DXRD of the NCZO (41.1 nm) is larger than that of the CFO (30.3 nm). Crystallite size for CFOx/NCZOy composites correlates well with the size of the initial components (CFO and NCZO) and their ratio (x![[thin space (1/6-em)]](https://www.rsc.org/images/entities/char_2009.gif) :
:![[thin space (1/6-em)]](https://www.rsc.org/images/entities/char_2009.gif) y = 0
y = 0![[thin space (1/6-em)]](https://www.rsc.org/images/entities/char_2009.gif) :
:![[thin space (1/6-em)]](https://www.rsc.org/images/entities/char_2009.gif) 1; 1
1; 1![[thin space (1/6-em)]](https://www.rsc.org/images/entities/char_2009.gif) :
:![[thin space (1/6-em)]](https://www.rsc.org/images/entities/char_2009.gif) 1; 2
1; 2![[thin space (1/6-em)]](https://www.rsc.org/images/entities/char_2009.gif) :
:![[thin space (1/6-em)]](https://www.rsc.org/images/entities/char_2009.gif) 1; 3
1; 3![[thin space (1/6-em)]](https://www.rsc.org/images/entities/char_2009.gif) :
:![[thin space (1/6-em)]](https://www.rsc.org/images/entities/char_2009.gif) 1; 1
1; 1![[thin space (1/6-em)]](https://www.rsc.org/images/entities/char_2009.gif) :
:![[thin space (1/6-em)]](https://www.rsc.org/images/entities/char_2009.gif) 3; 1
3; 1![[thin space (1/6-em)]](https://www.rsc.org/images/entities/char_2009.gif) :
:![[thin space (1/6-em)]](https://www.rsc.org/images/entities/char_2009.gif) 2 and 1
2 and 1![[thin space (1/6-em)]](https://www.rsc.org/images/entities/char_2009.gif) :
:![[thin space (1/6-em)]](https://www.rsc.org/images/entities/char_2009.gif) 0). First, it decreases from pure NCZO 0
0). First, it decreases from pure NCZO 0![[thin space (1/6-em)]](https://www.rsc.org/images/entities/char_2009.gif) :
:![[thin space (1/6-em)]](https://www.rsc.org/images/entities/char_2009.gif) 1 to 1
1 to 1![[thin space (1/6-em)]](https://www.rsc.org/images/entities/char_2009.gif) :
:![[thin space (1/6-em)]](https://www.rsc.org/images/entities/char_2009.gif) 1 with a decrease in the NCZO content. Following that, it increases from 1
1 with a decrease in the NCZO content. Following that, it increases from 1![[thin space (1/6-em)]](https://www.rsc.org/images/entities/char_2009.gif) :
:![[thin space (1/6-em)]](https://www.rsc.org/images/entities/char_2009.gif) 1 to 3
1 to 3![[thin space (1/6-em)]](https://www.rsc.org/images/entities/char_2009.gif) :
:![[thin space (1/6-em)]](https://www.rsc.org/images/entities/char_2009.gif) 1 as the CFO content increases. The variation of the a and V values is also non-linear and correlates well with the lattice parameter for initial components (pure spinels). Minimal values were observed for the 2
1 as the CFO content increases. The variation of the a and V values is also non-linear and correlates well with the lattice parameter for initial components (pure spinels). Minimal values were observed for the 2![[thin space (1/6-em)]](https://www.rsc.org/images/entities/char_2009.gif) :
:![[thin space (1/6-em)]](https://www.rsc.org/images/entities/char_2009.gif) 1 ratio. It is an interesting fact that the lattice parameter (as well as volume) for NCZO (8.404 Å) is higher than for CFO (8.372 Å). This is strange due to the ionic radius of Co2+ (RCo2+ = 0.0745 nm for Oh-coordination or coordination number CN = 6 and RCo2+ = 0.0585 nm for Th-coordination or CN = 4) is larger in comparison with the ionic radius of Ni2+ (RNi2+ = 0.069 nm for Oh-coordination or CN = 6 and RNi2+ = 0.055 nm for Th-coordination or CN = 4), Zn2+ (RZn2+ = 0.074 nm for Oh-coordination or CN = 6 and RZn2+ = 0.054 nm for Th-coordination or CN = 4) and Cu2+ (RCu2+ = 0.073 nm for Oh-coordination or CN = 6 and RCu2+ = 0.057 nm for Th-coordination or CN = 4). It can be explained for two reasons: (i) the effect of surface compression of crystallites at the nanolevel (with an increase in surface compression, a slight decrease in lattice parameters is observed)—because the size of crystallites for CFO is smaller than for NCZN – and the specific surface area of CFO crystallites is larger—the effect of surface compression should be more pronounced for CFO; (ii) partial oxidation of Co2+ ions on the surface of nanoparticles with a change in the degree of oxidation to Co3+ (RCo3+ = 0.061 nm for CN = 6 that is smaller than is smaller than RNi2+ = 0.069 nm, RZn2+ = 0.074 nm and RCu2+ = 0.073 nm for CN = 6). In present paper we didn't take into account defects analysis of oxygen site (deviation from oxygen stoichiometry). But investigation of the defect influence on structural parameters, magnetic and electrical properties for complex oxides is very important. Defect formation on the grain boundaries impact great on properties especially for nanosized materials. Non-stoichiometric phases are ubiquitous and extensively found in the transition metal, rare earth, and actinide oxides (in particular for nanocrystals with enhanced surface disorder, etc.), resulting in the formation of intrinsic or native defects. For example, elucidated partial cationic inversion-induced magnetic hardening of nickel ferrite nanowires41 and the possible so-called orthorhombic distortion variations in spinels with cubic structure and general formula AFe2O4 (where A – divalent cation) perovskite oxides. Recent results confirm that the Raman spectroscopy is helpful42 and we will plan this experiment in further investigations.
1 ratio. It is an interesting fact that the lattice parameter (as well as volume) for NCZO (8.404 Å) is higher than for CFO (8.372 Å). This is strange due to the ionic radius of Co2+ (RCo2+ = 0.0745 nm for Oh-coordination or coordination number CN = 6 and RCo2+ = 0.0585 nm for Th-coordination or CN = 4) is larger in comparison with the ionic radius of Ni2+ (RNi2+ = 0.069 nm for Oh-coordination or CN = 6 and RNi2+ = 0.055 nm for Th-coordination or CN = 4), Zn2+ (RZn2+ = 0.074 nm for Oh-coordination or CN = 6 and RZn2+ = 0.054 nm for Th-coordination or CN = 4) and Cu2+ (RCu2+ = 0.073 nm for Oh-coordination or CN = 6 and RCu2+ = 0.057 nm for Th-coordination or CN = 4). It can be explained for two reasons: (i) the effect of surface compression of crystallites at the nanolevel (with an increase in surface compression, a slight decrease in lattice parameters is observed)—because the size of crystallites for CFO is smaller than for NCZN – and the specific surface area of CFO crystallites is larger—the effect of surface compression should be more pronounced for CFO; (ii) partial oxidation of Co2+ ions on the surface of nanoparticles with a change in the degree of oxidation to Co3+ (RCo3+ = 0.061 nm for CN = 6 that is smaller than is smaller than RNi2+ = 0.069 nm, RZn2+ = 0.074 nm and RCu2+ = 0.073 nm for CN = 6). In present paper we didn't take into account defects analysis of oxygen site (deviation from oxygen stoichiometry). But investigation of the defect influence on structural parameters, magnetic and electrical properties for complex oxides is very important. Defect formation on the grain boundaries impact great on properties especially for nanosized materials. Non-stoichiometric phases are ubiquitous and extensively found in the transition metal, rare earth, and actinide oxides (in particular for nanocrystals with enhanced surface disorder, etc.), resulting in the formation of intrinsic or native defects. For example, elucidated partial cationic inversion-induced magnetic hardening of nickel ferrite nanowires41 and the possible so-called orthorhombic distortion variations in spinels with cubic structure and general formula AFe2O4 (where A – divalent cation) perovskite oxides. Recent results confirm that the Raman spectroscopy is helpful42 and we will plan this experiment in further investigations.
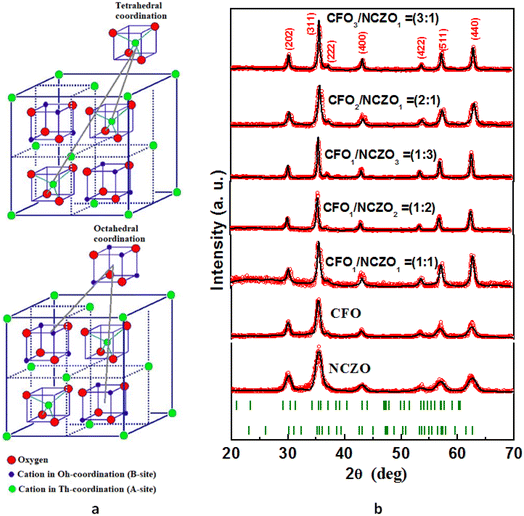 | ||
Fig. 1 Features of the crystal structure of the CFOx/NCZOy composites. (a) Crystal structure of the spinel-like ferrite with SG: Fd![[3 with combining macron]](https://www.rsc.org/images/entities/char_0033_0304.gif) m. (b) XRD patterns of the CFOx/NCZOy composites. m. (b) XRD patterns of the CFOx/NCZOy composites. | ||
 | ||
| Fig. 2 Main structural parameters of the CFOx/NCZOy composites from XRD data analysis. (a) Average size of crystallite. (b) Lattice parameter a. (c) Volume of the unit cell V. | ||
Microstructural parameters
Fig. 3 shows images of CFOx/NCZOy (x![[thin space (1/6-em)]](https://www.rsc.org/images/entities/char_2009.gif) :
:![[thin space (1/6-em)]](https://www.rsc.org/images/entities/char_2009.gif) y = 0
y = 0![[thin space (1/6-em)]](https://www.rsc.org/images/entities/char_2009.gif) :
:![[thin space (1/6-em)]](https://www.rsc.org/images/entities/char_2009.gif) 1; 1
1; 1![[thin space (1/6-em)]](https://www.rsc.org/images/entities/char_2009.gif) :
:![[thin space (1/6-em)]](https://www.rsc.org/images/entities/char_2009.gif) 1; 2
1; 2![[thin space (1/6-em)]](https://www.rsc.org/images/entities/char_2009.gif) :
:![[thin space (1/6-em)]](https://www.rsc.org/images/entities/char_2009.gif) 1; 3
1; 3![[thin space (1/6-em)]](https://www.rsc.org/images/entities/char_2009.gif) :
:![[thin space (1/6-em)]](https://www.rsc.org/images/entities/char_2009.gif) 1; 1
1; 1![[thin space (1/6-em)]](https://www.rsc.org/images/entities/char_2009.gif) :
:![[thin space (1/6-em)]](https://www.rsc.org/images/entities/char_2009.gif) 3; 1
3; 1![[thin space (1/6-em)]](https://www.rsc.org/images/entities/char_2009.gif) :
:![[thin space (1/6-em)]](https://www.rsc.org/images/entities/char_2009.gif) 2, and 1
2, and 1![[thin space (1/6-em)]](https://www.rsc.org/images/entities/char_2009.gif) :
:![[thin space (1/6-em)]](https://www.rsc.org/images/entities/char_2009.gif) 0) and particle size distribution for NCs obtained by SEM.
0) and particle size distribution for NCs obtained by SEM.
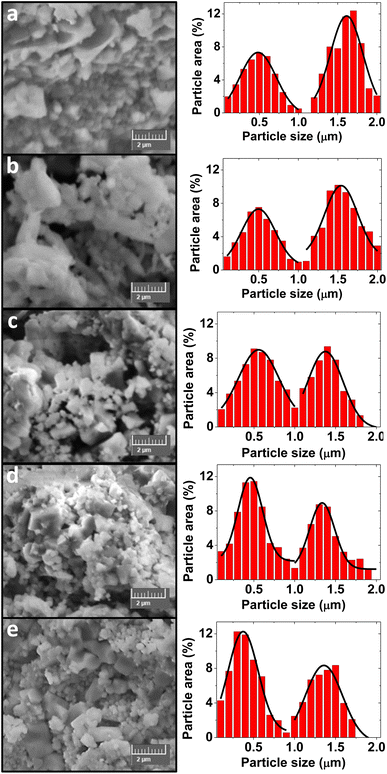 | ||
| Fig. 3 SEM images (left column) and particle size distributions (right column) of the CFOx/NCZOy composites. (a) CFO3/NCZO1. (b) CFO2/NCZO1. (c) CFO1/NCZO1. (d) CFO1/NCZO2. (e) CFO1/NCZO3. | ||
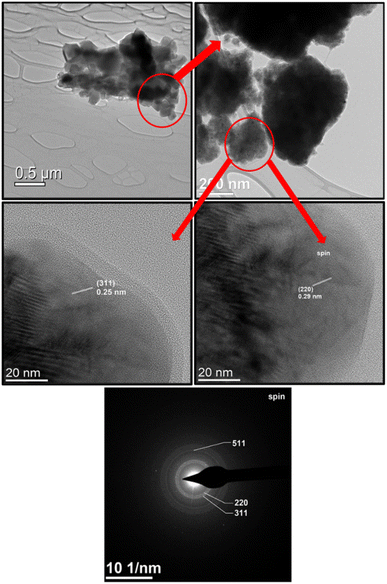
Average particle size analysis for each composite was performed by a standard statistical method using SmartSEM software as in ref. 43. An area of at least 250 μm2 was used to analyze each sample. Particle size distributions are shown for each sample over the SEM images in Fig. 3. All samples are characterized by the presence of two maxima. Thus, the two values of most probably particle sizes were determined for each sample. For better understanding of the microstructure we provide HRTEM images and electron diffraction pattern for CFO1/NCZO1 on Fig. 4.
The dependence of the most probable size on the spinel ratio is shown in Fig. 5.
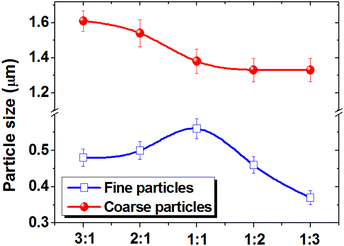 | ||
| Fig. 5 Change in the most probable particle size for fine and coarse phases depending on the CFO and NCZO phase ratio in the CFOx/NCZOy composites. | ||
The results showed that the particle size of the coarse fraction nonlinearly decreases from 1.61 to 1.33 μm. The particle size of the fine fraction varies from 0.37 to 0.56 μm. Moreover, an increase in the CoFe2O4 content leads to an increase in the most probable size of the coarse fraction and a decrease in the most probable grain size of the fine fraction. An increase in the NCZO content leads to a decrease in the average size of both fine and coarse fractions. This is probably due to the large number of defects in the crystal lattice of the complex NCZO spinel, which prevents the growth of particles.
Fig. 6 shows the change in the ratio of coarse and fine fractions with a decrease in the CFO and an increase in the NCZO spinel content. An almost linear increase in the proportion of the fine fraction and a corresponding decrease in the proportion of the coarse fraction were observed.
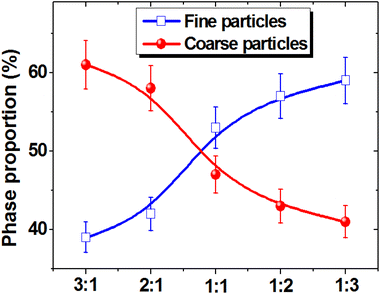 | ||
| Fig. 6 Changes in the proportion of fine and coarse phases depending on the ratio between CFO and NCZO components of the CFOx/NCZOy composites. | ||
Thus, it can be concluded that CFO spinel promotes the growth of coarse grains with an average size of 1 to 2 μm, and the addition of NCZO in nanocomposites causes the formation of particles with an average size of 380–560 nm.
Electrodynamic parameters
The high frequency electromagnetic parameters as well as the main electrodynamic values (real and imaginary parts of the permittivity and permeability) were analyzed in the range of 2–10 GHz at room temperature for CFOx/NCZOy (x![[thin space (1/6-em)]](https://www.rsc.org/images/entities/char_2009.gif) :
:![[thin space (1/6-em)]](https://www.rsc.org/images/entities/char_2009.gif) y = 0
y = 0![[thin space (1/6-em)]](https://www.rsc.org/images/entities/char_2009.gif) :
:![[thin space (1/6-em)]](https://www.rsc.org/images/entities/char_2009.gif) 1; 1
1; 1![[thin space (1/6-em)]](https://www.rsc.org/images/entities/char_2009.gif) :
:![[thin space (1/6-em)]](https://www.rsc.org/images/entities/char_2009.gif) 1; 2
1; 2![[thin space (1/6-em)]](https://www.rsc.org/images/entities/char_2009.gif) :
:![[thin space (1/6-em)]](https://www.rsc.org/images/entities/char_2009.gif) 1; 3
1; 3![[thin space (1/6-em)]](https://www.rsc.org/images/entities/char_2009.gif) :
:![[thin space (1/6-em)]](https://www.rsc.org/images/entities/char_2009.gif) 1; 1
1; 1![[thin space (1/6-em)]](https://www.rsc.org/images/entities/char_2009.gif) :
:![[thin space (1/6-em)]](https://www.rsc.org/images/entities/char_2009.gif) 3; 1
3; 1![[thin space (1/6-em)]](https://www.rsc.org/images/entities/char_2009.gif) :
:![[thin space (1/6-em)]](https://www.rsc.org/images/entities/char_2009.gif) 2 and 1
2 and 1![[thin space (1/6-em)]](https://www.rsc.org/images/entities/char_2009.gif) :
:![[thin space (1/6-em)]](https://www.rsc.org/images/entities/char_2009.gif) 0) composites. The behavior of the permittivity and permeability vs. frequency was determined from the measured S-parameters (S11–S21). Fig. 7 demonstrates the behavior of the permittivity (real permittivity ε′ on Fig. 7a and imaginary permittivity ε′′ on Fig. 7b, respectively). The energy accumulation of an AC electrical field determines the behavior of the real part of permittivity. The energy losses associated with the processes of energy dissipation in materials due to polarization (ionic, electronic, etc.). The energy attenuation due to electromagnetic absorption in materials determines the behavior of the imaginary part of permittivity.
0) composites. The behavior of the permittivity and permeability vs. frequency was determined from the measured S-parameters (S11–S21). Fig. 7 demonstrates the behavior of the permittivity (real permittivity ε′ on Fig. 7a and imaginary permittivity ε′′ on Fig. 7b, respectively). The energy accumulation of an AC electrical field determines the behavior of the real part of permittivity. The energy losses associated with the processes of energy dissipation in materials due to polarization (ionic, electronic, etc.). The energy attenuation due to electromagnetic absorption in materials determines the behavior of the imaginary part of permittivity.
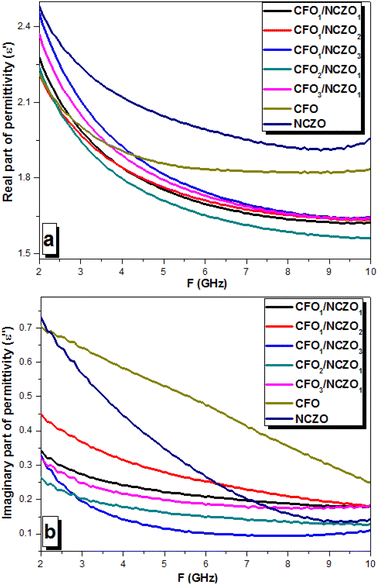 | ||
| Fig. 7 Permittivity behavior vs. frequency for the CFOx/NCZOy composites in the range 2–10 GHz. (a) Real part of the permittivity – ε′. (b) Imaginary part of the permittivity – ε′′. | ||
The values of the ε′ for the initial components CFO and NCZO were in the range of 1.85–2.23 and 1.96–2.49, respectively. The real permittivity of CFO and NCZO decreased rapidly in the frequency ranges of 2–5 and 2–8 GHz, respectively. The features of electrical polarization in materials can explain it. The decrease in real permittivity can be attributed to a decrease in the intensity of charge carrier interaction on grain boundaries. This is an interesting fact that at the lower frequencies (<3 GHz) the behavior of the real permittivity correlates well with the chemical composition of the CFOx/NCZOy. It means that ε′ values for composites were between the values for initial spinels. We have found a synergistic effect with a frequency increase when the additivity principle is violated. This is manifested in the fact that the permittivity value for CFOx/NCZOy NCs was much lower than for the initial components.
This was especially evident at frequencies above 5 GHz (Fig. 7a). The values for CFOx/NCZOy composite materials were in the range, which is noticeably lower than for the original spinels. This behavior may be due to a decrease in the interphase polarization intensity. Similar behavior can be found for imaginary permittivity (Fig. 7b). A rapid increase of the ε′′ from 0.70 to 0.31 and from 0.74 to 0.17 was observed in CFO and NCZO, respectively. Moreover, the values for CFOx/NCZOy NCs were in the range, which is noticeably lower than for the original spinels. As it was mentioned above, the imaginary part of permittivity shows us the energy losses in materials. If in the range of 1 GHz to 1 THz the imaginary part of permittivity is higher than the real part, it corresponds to high-energy losses in materials due to electrical nature. In the present case, the ε′′ values were lower than ε′.
Fig. 8 depicts the behavior of the permeability (real permeability ε′ on Fig. 8a and imaginary permeability ε′′ on Fig. 8b, respectively). Almost all CFOx/NCZOy NCs, as well as initial CFO and NCZO spinels, demonstrated a monotonic decrease in the real part of the permeability. It can be associated with the features of the magnetization processes in magnetic materials. The values of the ε′ for CFOx/NCZOy NCs as well as initial CFO and NCZO spinels were in the range of 1.63–0.02. There was no observed correlation between the composition and real permeability vs. frequency. The opposite behavior was found for imaginary permeability vs. frequency in this range. All composite samples demonstrated a rapid increase of ε′′. The values of the ε′′ for initial components CFO and NCZO were in the range of 0.11–0.35 and 0.18–0.37, respectively. It was observed that the rapid increase of the imaginary permeability occurred in the frequency range of 5–6 GHz for all samples. The increase in the imaginary permeability lets us assert that the energy losses in CFOx/NCZOy composites increase with frequency.
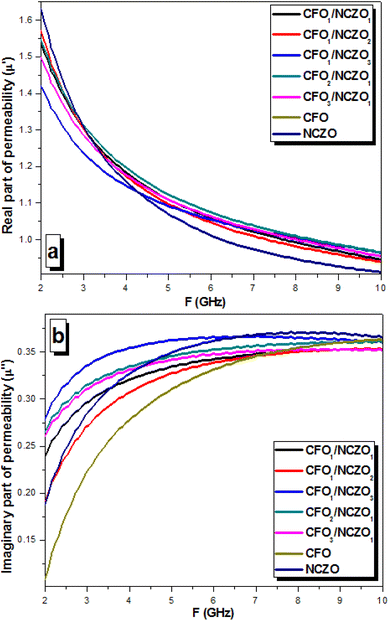 | ||
| Fig. 8 Permeability behavior vs. frequency for the CFOx/NCZOy composites in the range 2–10 GHz. (a) Real part of the permeability – μ′. (b) Imaginary part of the permeability – μ′′. | ||
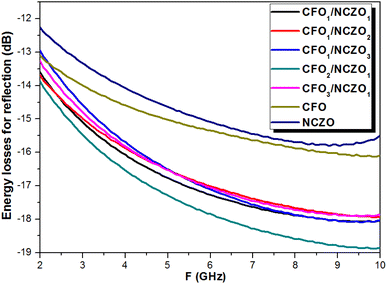
Fig. 9 shows the behavior of the energy losses for reflection vs. frequency. The value of energy losses for all CFOx/NCZOy NCs is negative. This corresponds to the attenuation of the energy of the reflected wave. We should emphasize that all samples demonstrated an increase in losses (as a module) as frequency increased. This correlates well with the μ′′(F) behavior. We can conclude that the nature of the attenuation of the reflected energy is associated with the electromagnetic absorption processes due to magnetic losses. The values of the energy losses for initial components CFO and NCZO were in the range −13.2…−15.4 dB and −12.3…−14.7 respectively. We need to highlight that the values of the energy losses for CFOx/NCZOy composites were larger in comparison with the initial spinels. Thus, CFOx/NCZOy composites with the ratios 1![[thin space (1/6-em)]](https://www.rsc.org/images/entities/char_2009.gif) :
:![[thin space (1/6-em)]](https://www.rsc.org/images/entities/char_2009.gif) 1; 3
1; 3![[thin space (1/6-em)]](https://www.rsc.org/images/entities/char_2009.gif) :
:![[thin space (1/6-em)]](https://www.rsc.org/images/entities/char_2009.gif) 1; 1
1; 1![[thin space (1/6-em)]](https://www.rsc.org/images/entities/char_2009.gif) :
:![[thin space (1/6-em)]](https://www.rsc.org/images/entities/char_2009.gif) 3; and 1
3; and 1![[thin space (1/6-em)]](https://www.rsc.org/images/entities/char_2009.gif) :
:![[thin space (1/6-em)]](https://www.rsc.org/images/entities/char_2009.gif) 2 have similar behavior and values of the energy losses that were in the range of −13.0…−17.7 dB. Maximal values of the energy losses due to electromagnetic absorption were observed for CFO2/NCZO1 or 2
2 have similar behavior and values of the energy losses that were in the range of −13.0…−17.7 dB. Maximal values of the energy losses due to electromagnetic absorption were observed for CFO2/NCZO1 or 2![[thin space (1/6-em)]](https://www.rsc.org/images/entities/char_2009.gif) :
:![[thin space (1/6-em)]](https://www.rsc.org/images/entities/char_2009.gif) 1 (−18.9 dB). This corresponds to the attenuation of the reflected electromagnetic energy by almost 2 orders of magnitude in comparison with the incident energy.
1 (−18.9 dB). This corresponds to the attenuation of the reflected electromagnetic energy by almost 2 orders of magnitude in comparison with the incident energy.
Experimental
Initial components Ni(NO3)2·6H2O, Cu(NO3)2·2H2O, Zn(NO3)2, Fe(NO3)3·9H2O, and Co(NO3)2·6H2O, were used for nanostructured functional CFOx/NCZOy (x![[thin space (1/6-em)]](https://www.rsc.org/images/entities/char_2009.gif) :
:![[thin space (1/6-em)]](https://www.rsc.org/images/entities/char_2009.gif) y = 0
y = 0![[thin space (1/6-em)]](https://www.rsc.org/images/entities/char_2009.gif) :
:![[thin space (1/6-em)]](https://www.rsc.org/images/entities/char_2009.gif) 1; 1
1; 1![[thin space (1/6-em)]](https://www.rsc.org/images/entities/char_2009.gif) :
:![[thin space (1/6-em)]](https://www.rsc.org/images/entities/char_2009.gif) 1; 2
1; 2![[thin space (1/6-em)]](https://www.rsc.org/images/entities/char_2009.gif) :
:![[thin space (1/6-em)]](https://www.rsc.org/images/entities/char_2009.gif) 1; 3
1; 3![[thin space (1/6-em)]](https://www.rsc.org/images/entities/char_2009.gif) :
:![[thin space (1/6-em)]](https://www.rsc.org/images/entities/char_2009.gif) 1; 1
1; 1![[thin space (1/6-em)]](https://www.rsc.org/images/entities/char_2009.gif) :
:![[thin space (1/6-em)]](https://www.rsc.org/images/entities/char_2009.gif) 3; 1
3; 1![[thin space (1/6-em)]](https://www.rsc.org/images/entities/char_2009.gif) :
:![[thin space (1/6-em)]](https://www.rsc.org/images/entities/char_2009.gif) 2 and 1
2 and 1![[thin space (1/6-em)]](https://www.rsc.org/images/entities/char_2009.gif) :
:![[thin space (1/6-em)]](https://www.rsc.org/images/entities/char_2009.gif) 0) NCs. The specifications of the samples are in Table 1. Samples were synthesized via the green sol–gel method.34,35,44 The stoichiometric amounts of metal nitrates dissolved in 40 ml of deionized H2O and 6 de-seeded dates dissolved in 40 ml of deionized H2O separately. The solution containing dates was filtrated and combined with the solution containing metal salts. The final solution was heated at 100 °C until it turns from solution to gel-like consistency, then to powder. The final product is then calcinated at 950 °C for 5 h. The used chemical constituents followed the ratios as in the formula below:
0) NCs. The specifications of the samples are in Table 1. Samples were synthesized via the green sol–gel method.34,35,44 The stoichiometric amounts of metal nitrates dissolved in 40 ml of deionized H2O and 6 de-seeded dates dissolved in 40 ml of deionized H2O separately. The solution containing dates was filtrated and combined with the solution containing metal salts. The final solution was heated at 100 °C until it turns from solution to gel-like consistency, then to powder. The final product is then calcinated at 950 °C for 5 h. The used chemical constituents followed the ratios as in the formula below:
![[thin space (1/6-em)]](https://www.rsc.org/images/entities/char_2009.gif) :
:![[thin space (1/6-em)]](https://www.rsc.org/images/entities/char_2009.gif) (Ni0.4Cu0.2Zn0.4)Fe2O4 composites
(Ni0.4Cu0.2Zn0.4)Fe2O4 composites
| No. | Ratio between phases CoFe2O4/(Ni0.4Cu0.2Zn0.4)Fe2O4 | Acronym where CoFe2O4 – CFO, (Ni0.4Cu0.2Zn0.4)Fe2O4 – NCZO |
|---|---|---|
| 1 | CoFe2O4 (1![[thin space (1/6-em)]](https://www.rsc.org/images/entities/char_2009.gif) : :![[thin space (1/6-em)]](https://www.rsc.org/images/entities/char_2009.gif) 0) 0) |
CFO or (1![[thin space (1/6-em)]](https://www.rsc.org/images/entities/char_2009.gif) : :![[thin space (1/6-em)]](https://www.rsc.org/images/entities/char_2009.gif) 0) 0) |
| 2 | (Ni0.4Cu0.2Zn0.4)Fe2O4 (0![[thin space (1/6-em)]](https://www.rsc.org/images/entities/char_2009.gif) : :![[thin space (1/6-em)]](https://www.rsc.org/images/entities/char_2009.gif) 1) 1) |
NCZO or (0![[thin space (1/6-em)]](https://www.rsc.org/images/entities/char_2009.gif) : :![[thin space (1/6-em)]](https://www.rsc.org/images/entities/char_2009.gif) 1) 1) |
| 3 | CoFe2O4![[thin space (1/6-em)]](https://www.rsc.org/images/entities/char_2009.gif) : :![[thin space (1/6-em)]](https://www.rsc.org/images/entities/char_2009.gif) (Ni0.4Cu0.2Zn0.4)Fe2O4 (1 (Ni0.4Cu0.2Zn0.4)Fe2O4 (1![[thin space (1/6-em)]](https://www.rsc.org/images/entities/char_2009.gif) : :![[thin space (1/6-em)]](https://www.rsc.org/images/entities/char_2009.gif) 1) 1) |
CFO1/NCZO1 or (1![[thin space (1/6-em)]](https://www.rsc.org/images/entities/char_2009.gif) : :![[thin space (1/6-em)]](https://www.rsc.org/images/entities/char_2009.gif) 1) 1) |
| 4 | CoFe2O4![[thin space (1/6-em)]](https://www.rsc.org/images/entities/char_2009.gif) : :![[thin space (1/6-em)]](https://www.rsc.org/images/entities/char_2009.gif) (Ni0.4Cu0.2Zn0.4)Fe2O4 (1 (Ni0.4Cu0.2Zn0.4)Fe2O4 (1![[thin space (1/6-em)]](https://www.rsc.org/images/entities/char_2009.gif) : :![[thin space (1/6-em)]](https://www.rsc.org/images/entities/char_2009.gif) 2) 2) |
CFO1/NCZO2 or (1![[thin space (1/6-em)]](https://www.rsc.org/images/entities/char_2009.gif) : :![[thin space (1/6-em)]](https://www.rsc.org/images/entities/char_2009.gif) 2) 2) |
| 5 | CoFe2O4![[thin space (1/6-em)]](https://www.rsc.org/images/entities/char_2009.gif) : :![[thin space (1/6-em)]](https://www.rsc.org/images/entities/char_2009.gif) (Ni0.4Cu0.2Zn0.4)Fe2O4 (1 (Ni0.4Cu0.2Zn0.4)Fe2O4 (1![[thin space (1/6-em)]](https://www.rsc.org/images/entities/char_2009.gif) : :![[thin space (1/6-em)]](https://www.rsc.org/images/entities/char_2009.gif) 3) 3) |
CFO1/NCZO3 or (1![[thin space (1/6-em)]](https://www.rsc.org/images/entities/char_2009.gif) : :![[thin space (1/6-em)]](https://www.rsc.org/images/entities/char_2009.gif) 3) 3) |
| 6 | CoFe2O4![[thin space (1/6-em)]](https://www.rsc.org/images/entities/char_2009.gif) : :![[thin space (1/6-em)]](https://www.rsc.org/images/entities/char_2009.gif) (Ni0.4Cu0.2Zn0.4)Fe2O4 (2 (Ni0.4Cu0.2Zn0.4)Fe2O4 (2![[thin space (1/6-em)]](https://www.rsc.org/images/entities/char_2009.gif) : :![[thin space (1/6-em)]](https://www.rsc.org/images/entities/char_2009.gif) 1) 1) |
CFO2/NCZO1 or (2![[thin space (1/6-em)]](https://www.rsc.org/images/entities/char_2009.gif) : :![[thin space (1/6-em)]](https://www.rsc.org/images/entities/char_2009.gif) 1) 1) |
| 7 | CoFe2O4![[thin space (1/6-em)]](https://www.rsc.org/images/entities/char_2009.gif) : :![[thin space (1/6-em)]](https://www.rsc.org/images/entities/char_2009.gif) (Ni0.4Cu0.2Zn0.4)Fe2O4 (3 (Ni0.4Cu0.2Zn0.4)Fe2O4 (3![[thin space (1/6-em)]](https://www.rsc.org/images/entities/char_2009.gif) : :![[thin space (1/6-em)]](https://www.rsc.org/images/entities/char_2009.gif) 1) 1) |
CFO3/NCZO1 or (3![[thin space (1/6-em)]](https://www.rsc.org/images/entities/char_2009.gif) : :![[thin space (1/6-em)]](https://www.rsc.org/images/entities/char_2009.gif) 1) 1) |
For CoFe2O4
| Co2+ + 2Fe3+ + 4O2− → CoFe2O4 | (1) |
For (Ni0.4Cu0.2Zn0.4)Fe2O4
| 0.4Ni2+ + 0.2Cu2+ + 0.4Zn2+ + 2Fe3+ + 4O2− → (Ni0.4Cu0.2Zn0.4)Fe2O4 | (2) |
X-ray diffraction investigations were performed using a Rigaku diffractometer in the range of 20°–70° (Benchtop Miniflex in Cu-Kα radiation). The refinement of the XRD patterns was done using FullProf software. The features of the structural parameters (unit cell constant (a), volume (V) and average size of crystallite) were determined by the Rietveld method.1,3 Microstructural parameters (average particle and crystallite size, particle size distribution) were investigated using SEM (scanning electron microscope FEI Titan ST). The SEM images analysis was done to calculate the average particles size and their distribution. The average particle size was estimated using the following equation:45
 | (3) |
Electrodynamic parameters were measured in the range of 2–10 GHz. It was used as a co-axial method for measuring S11 and S21 parameters. The impedance of the co-axial line was evaluated using the following equation:
 | (4) |
The frequency-dependent (in the range of 1–20 GHz) S-parameters were measured by an Agilent network analyzer. The Nicholson–Ross–Weir method (NRW) was used to determine the reflection losses (in dB) following the relation:
 | (5) |
 is the modulus of the reflection coefficient shows the ratio of the amplitude of the reflected wave relative to the incident amplitude in dB.
Conclusion
Complex magnetic oxides based on transition metal ions attract great attention due to their scientific importance and practical perspectives. The functional CFOx/NCZOy composites based on nanosized spinel ferrites were produced by the sol–gel method. All investigated composites consisted of 2 single phases (initial CFO and NCZO spinels) without any impurities and the absence of chemical interaction between phases. The DXRD of the NCZO (41.1 nm) was larger than that of the CFO (30.3 nm) and changed non-linear for composites. But it correlates well with the size of the initial components and their ratio. The variation of the a and V values was also non-linear and correlates well with the lattice parameter for initial components (spinels). Minimal values were observed for the 2![[thin space (1/6-em)]](https://www.rsc.org/images/entities/char_2009.gif) :
:![[thin space (1/6-em)]](https://www.rsc.org/images/entities/char_2009.gif) 1 ratio. On particle size distribution obtained from SEM-images, two maxima were observed for all composite samples. The particle size of the coarse fraction nonlinearly decreases from 1.61 to 1.33 μm. The particle size of the fine fraction varies from 0.37 to 0.56 μm. It was observed that an increase in the CFO content leads to an increase in the most probable size of the coarse fraction and a decrease in the most probable grain size of the fine fraction. An increase in the NCZO content leads to a decrease in the average size of both fine and coarse fractions. This is probably due to the large number of defects in the crystal lattice of the complex NCZO spinel, which prevents the growth of particles. Thus, it can be concluded that CFO spinel promotes the growth of coarse grains with a size of 1 to 2 μm, and the addition of NCZO in nanocomposites causes the formation of particles with an average size of 380–560 nm. The high frequency electromagnetic parameters as well as the main electrodynamic values (real and imaginary parts of the permittivity and permeability) were analyzed in the range of 2–10 GHz. Based on measured S-parameters and calculated real/imaginary permittivity and permeability, we evaluated energy losses for reflection vs. frequency. We demonstrate the attenuation of the energy of the reflected wave (negative value of the value). The increase of the energy losses (as a module) with frequency increase was observed. This correlates well with the μ′′(F) behavior. The nature of the attenuation of the reflected energy associated with the electromagnetic absorption processes due to magnetic losses. We have found a synergistic effect when the additivity principle is violated. It means that the values for initial components CFO and NCZO were lower (as a module) in comparison with the CFOx/NCZOy composites. Maximal values of the energy losses due to electromagnetic absorption were observed for CFO2/NCZO1 or 2
1 ratio. On particle size distribution obtained from SEM-images, two maxima were observed for all composite samples. The particle size of the coarse fraction nonlinearly decreases from 1.61 to 1.33 μm. The particle size of the fine fraction varies from 0.37 to 0.56 μm. It was observed that an increase in the CFO content leads to an increase in the most probable size of the coarse fraction and a decrease in the most probable grain size of the fine fraction. An increase in the NCZO content leads to a decrease in the average size of both fine and coarse fractions. This is probably due to the large number of defects in the crystal lattice of the complex NCZO spinel, which prevents the growth of particles. Thus, it can be concluded that CFO spinel promotes the growth of coarse grains with a size of 1 to 2 μm, and the addition of NCZO in nanocomposites causes the formation of particles with an average size of 380–560 nm. The high frequency electromagnetic parameters as well as the main electrodynamic values (real and imaginary parts of the permittivity and permeability) were analyzed in the range of 2–10 GHz. Based on measured S-parameters and calculated real/imaginary permittivity and permeability, we evaluated energy losses for reflection vs. frequency. We demonstrate the attenuation of the energy of the reflected wave (negative value of the value). The increase of the energy losses (as a module) with frequency increase was observed. This correlates well with the μ′′(F) behavior. The nature of the attenuation of the reflected energy associated with the electromagnetic absorption processes due to magnetic losses. We have found a synergistic effect when the additivity principle is violated. It means that the values for initial components CFO and NCZO were lower (as a module) in comparison with the CFOx/NCZOy composites. Maximal values of the energy losses due to electromagnetic absorption were observed for CFO2/NCZO1 or 2![[thin space (1/6-em)]](https://www.rsc.org/images/entities/char_2009.gif) :
:![[thin space (1/6-em)]](https://www.rsc.org/images/entities/char_2009.gif) 1 (−18.9 dB). This correlates with the lattice parameters of the composites (minimal a and V values were observed for this composition). This opens broad perspectives for practical applications such as composites for antenna technology (5G technology) and for electromagnetic absorbing coatings.
1 (−18.9 dB). This correlates with the lattice parameters of the composites (minimal a and V values were observed for this composition). This opens broad perspectives for practical applications such as composites for antenna technology (5G technology) and for electromagnetic absorbing coatings.
Conflicts of interest
There are no conflicts to declare.Acknowledgements
Investigations and analysis of the electromagnetic parameters were supported by the Russian Science Foundation (Agreement No. 19-72-10071-Π). The authors acknowledge the Institute for Research and Medical Consultations (IRMC) at Imam Abdulrahman Bin Faisal University (Dammam, Saudi Arabia) for using the Lab facilities.References
- A. V. Trukhanov, V. O. Turchenko and I. A. Bobrikov, et al., J. Magn. Magn. Mater., 2015, 393, 253–259 CrossRef CAS.
- U. B. Gawas, V. M. S. Verenkar and S. R. Barman, et al., J. Alloys Compd., 2013, 555, 225–231 CrossRef CAS.
- S. V. Trukhanov, A. V. Trukhanov and A. N. Vasiliev, et al., J. Exp. Theor. Phys., 2011, 113, 819–825 CrossRef CAS.
- A. V. Trukhanov, V. G. Kostishyn and L. V. Panina, et al., J. Alloys Compd., 2018, 754, 247–256 CrossRef CAS.
- S. V. Trukhanov, A. V. Trukhanov and V. G. Kostishin, et al., JETP Lett., 2016, 103(2), 100–105 CrossRef CAS.
- S. V. Trukhanov, A. V. Trukhanov and V. G. Kostishyn, et al., Dalton Trans., 2017, 46(28), 9010–9021 RSC.
- S. C. Tolani, A. R. Golhar and K. G. Rewatkar, AIP Conference Proceedings, AIP Publishing LLC, 2019, vol. 2104, iss. 1, p. 030032 Search PubMed.
- K. Lee, S. Hajra and M. Sahu, et al., J. Ind. Eng. Chem., 2022, 106, 512–519 CrossRef CAS.
- D. V. Karpinsky, I. O. Troyanchuk and M. Willinger, et al., Mater. Res. Bull., 2019, 112, 420–425 CrossRef CAS.
- C. L. Li, S. S. Zheng and G. O. Barasa, et al., Ceram. Int., 2021, 47(24), 35160–35169 CrossRef CAS.
- D. V. Karpinsky and M. V. Silibin, et al., J. Alloys Compd., 2019, 803, 1136–1140 CrossRef CAS.
- Ch. Srinivas, E. Ranjith Kumar and B. V. Tirupanyam, et al., J. Magn. Magn. Mater., 2020, 502, 166534 CrossRef CAS.
- M. A. Almessiere, Y. Slimani and H. Güngüneş, et al., Nanomaterials, 2019, 9(6), 820 CrossRef CAS PubMed.
- Ch. Srinivas, E. Ranjith Kumar and B. V. Tirupanyam, et al., J. Magn. Magn. Mater., 2020, 502, 166534 CrossRef CAS.
- V. A. Ketsko, E. N. Beresnev and M. A. Kop'Eva, et al., Russ. J. Inorg. Chem., 2010, 55(3), 427–429 CrossRef CAS.
- H. Mohd, M. Raghasudha and J. Shah, et al., J. Phys. Chem. Solids, 2018, 112, 29–36 CrossRef.
- M. Yousaf, A. Noor and S. Xu, et al., Ceram. Int., 2020, 46(10), 16524–16532 CrossRef CAS.
- A. N. Kuzmichev, V. I. Belotelov and Y. M. Bunkov, et al., Mater. Res. Bull., 2022, 149, 111691 CrossRef CAS.
- M. N. Akhtar, S. N. Khan and H. Ahmad, et al., Ceram. Int., 2018, 44(18), 22504–22511 CrossRef CAS.
- R. C. Pullar, Prog. Mater. Sci., 2012, 57(7), 1191–1334 CrossRef CAS.
- V. Turchenko, V. G. Kostishyn and S. Trukhanov, et al., J. Alloys Compd., 2020, 821, 153412 CrossRef CAS.
- D. Baba Basha, N. Suresh Kumar and K. Chandra Babu Naidu, et al., Sci. Rep., 2022, 12, 12723 CrossRef CAS PubMed.
- S. V. Trukhanov, A. V. Trukhanov and V. G. Kostishin, et al., J. Exp. Theor. Phys., 2016, 123(3), 461–469 CrossRef CAS.
- N. Raghuram, T. S. Rao and K. C. Naidu, Appl. Phys. A, 2019, 125, 839 CrossRef CAS.
- D. A. Vinnik, V. E. Zhivulin and A. Y. Starikov, et al., J. Magn. Magn. Mater., 2020, 498, 166117 CrossRef CAS.
- H. Mohd, S. S. Meena and R. K. Kotnala, et al., J. Alloys Compd., 2014, 602, 150–156 CrossRef.
- M. A. Almessiere, Y. Slimani and H. Güngüneş, et al., Ceram. Int., 2020, 46(8), 11124–11131 CrossRef CAS.
- A. V. Trukhanov, K. A. Astapovich and V. A. Turchenko, et al., J. Alloys Compd., 2020, 841, 155667 CrossRef CAS.
- P. Thakur, P. Sharma and J.-L. Mattei, et al., J. Mater. Sci.: Mater. Electron., 2018, 29, 16507–16515 CrossRef CAS.
- A. Pathania, P. Thakur and M. Tomar, et al., Results Phys., 2019, 15, 102531 CrossRef.
- D. A. Vinnik, D. P. Sherstyuk and V. E. Zhivulin, et al., Ceram. Int., 2022, 48(13), 18124–18133 CrossRef CAS.
- A. Rahman and R. Jayaganthan, Surf. Eng., 2017, 33, 810–815 CrossRef CAS.
- C. Feng, X. Liu, S. W. Or and S. L. Ho, AIP Adv., 2017, 7, 056403 CrossRef.
- M. A. Almessiere, B. Unal and A. Demir Korkmaz, et al., J. Mater. Res. Technol., 2021, 15, 969–983 CrossRef CAS.
- M. A. Almessiere, B. Ünal and A. Baykal, et al., Vacuum, 2021, 194, 110628 CrossRef CAS.
- C. L. Fei, Y. Zhang and Z. Yang, et al., J. Magn. Magn. Mater., 2011, 323(13), 1811–1816 CrossRef CAS.
- F. Yi, Ceram. Int., 2014, 40, 7837–7840 CrossRef CAS.
- R. Safi, A. Ghasemi and R. Shoja-Razavi, Ceram. Int., 2017, 43, 617–624 CrossRef CAS.
- M. A. Almessiere, Y. A. Slimani and M. Hassan, et al., Int. J. Energy Res., 2021, 45, 16691–16708 CrossRef CAS.
- L. Wang, C. Yang and L. Zhang, et al., Vacuum, 2020, 181, 109751 CrossRef CAS.
- J.-M. Li, X.-L. Zeng and Z.-A. Xu, Appl. Phys. Lett., 2013, 103, 232410 CrossRef.
- J.-M. Li and et al, ., Phys. Rev. B: Condens. Matter Mater. Phys., 2000, 61, 6876 CrossRef CAS.
- T. I. Zubar, V. M. Fedosyuk and D. I. Tishkevich, et al., Int. J. Mech. Sci., 2022, 215, 106952 CrossRef.
- Y. Slimani, N. A. Algarou and M. A. Almessiere, et al., Arabian J. Chem., 2021, 14, 102992 CrossRef CAS.
- M. A. Almessiere, A. V. Trukhanov and F. A. Khan, et al., Ceram. Int., 2020, 46, 7346–7354 CrossRef CAS.
| This journal is © The Royal Society of Chemistry 2022 |

