
 Open Access Article
 This Open Access Article is licensed under a
 Creative Commons Attribution 3.0 Unported Licence
Preparation of high temperature NH3-SCR catalysts with carbonate as precursors by ball milling method
Na Wang *a,
Lei Wanga,
Huidong Xieb,
Yang Liua,
Yepeng Suna,
Chang Yangc and
Chengmin Ged
*a,
Lei Wanga,
Huidong Xieb,
Yang Liua,
Yepeng Suna,
Chang Yangc and
Chengmin Ged
aCollege of Architecture and Civil Engineering, Xi'an University of Science and Technology, Xi'an, 710054, Shaanxi, China. E-mail: wangna811221@xust.edu.cn; Fax: +86-29-82202335; Tel: +86-29-82203378
bSchool of Chemistry and Chemical Engineering, Xi'an University of Architecture and Technology, Xi'an, 710055, Shaanxi, China
cEngineering Comprehensive Training Center, Xi'an University of Architecture and Technology, Xi'an, 710055, Shaanxi, China
dShandong Dongyuan New Material Technology Co., Ltd., Dongying, 257300, Shandong, China
First published on 8th December 2022
Abstract
High-temperature 10Ce–2La/TiO2 catalysts for selective catalytic reduction of NO with NH3 were prepared by the ball milling, impregnation and co-precipitation methods and their catalytic performance was compared. The effects of different starting materials of the ball milling method on the catalytic activity were investigated. The results showed that the 10Ce–2La/TiO2 catalyst prepared by the ball milling method using carbonates as starting materials exhibited the highest NO conversion, which was more than 80% in the temperature range of 330–550 °C. The as-prepared catalysts were characterized by XRD, TEM, and XPS. Results showed that the ball milling prepared 10Ce–2La/TiO2 had the advantages of uniform active site distribution, high oxygen storage capacity, and high Ce3+ and Oα ratio. The results of NH3-TPD and H2-TPR showed that the ball milling method not only improved the redox ability but also increased the quantities and concentration of the acidic sites. The green production and economically viable concept of this process provides a new solution for the production application of industrial catalysts.
1. Introduction
In modern society, the increase in air pollution due to harmful gases released from fossil energy consumption has become a global problem. These harmful gases mainly include NOx, SOx, and CO, and so on. Among them, NOx mainly originates from the flue gas of stationary sources represented by boilers in coal-fired plants and exhaust from the mobile sources represented by vehicles. The NOx emissions cause environmental problems such as acid rain, photochemical smog, ozone layer depletion, and greenhouse effect.1,2 Therefore, it is required to study a technique to diminish the NOx emission. Ammonia selective catalytic reduction (NH3-SCR) technology is currently the most widely used NO removal technology for flue gas. The most used commercial catalysts for NH3-SCR are vanadium-based catalysts such as V2O5–WO3 (MoO3)/TiO2. Although vanadium based catalyst has high NO conversion rate, it also has many disadvantages, such as narrow temperature operation window, high vanadium toxicity and poor high temperature activity.3,4 With that regards, non-vanadium-based catalysts have been explored and studied. Among them, cerium oxides have excellent oxidation properties as well as oxygen storage capacity due to the special electron distribution of cerium.5,6 At the same time, because cerium oxide has no biological toxicity, it is currently considered to be a powerful substitute for vanadium based catalysts. In our previous report, we prepared a series of Ce–La/TiO2 high-temperature NH3-SCR catalysts by the impregnation method.7 The introduction of La2O3 improved the catalytic activity and the Ce–La/TiO2 catalysts had a wide temperature window (355–590 °C) and better catalytic performance than commercial vanadium-based catalysts at high temperature.The catalytic activity and N2 selectivity of catalysts are influenced not only by the active components, but also by the preparation method and starting materials.8,9 In some cases, although the precursor for the preparation of catalysts does not change the final elemental composition of the catalyst, it can have an impact on the catalytic performance of the catalyst. Xu10 et al. prepared Fe–TiO2 catalysts via a co-precipitation method and found that different TiO2 precursors (titanium sulfate, titanium tetrachloride, n-butyl titanate and commercial TiO2) had a significant effect on the catalytic activity. Among them, the samples synthesized with titanium sulfate as the precursor showed the highest catalytic activity. As for the preparation methods, Chen11 et al. compared the catalytic performance of the Ce–Mn/TiO2 mixed oxides prepared by inverse co-precipitation, conventional co-precipitation and impregnation methods. Results showed that the catalyst prepared by inverse co-precipitation method had the highest low-temperature catalytic activity and the best resistance to water and SO2. Pan et al.12 prepared a series of catalysts with different mixing ratios by ball milling. The catalysts prepared by the ball milling methods showed NO conversion more than 90%, good N2 selectivity and high toxicity resistance to SO2 and H2O in a wide temperature range (200–400 °C). It is well known that the ball milling method is an easy industrial production method with the advantages of simple operation, low cost, and easy to scale up. In particular, the ball milling method can reduce the discharge of waste water and harmful exhaust gases when compared with the impregnation and co-precipitation methods that often used in the industrial production, thus contributing to environmental protection.13,14 Although the Ce–La/TiO2 catalysts prepared by the impregnation method of our group have excellent high-temperature catalytic performance, the raw materials contain a large amount of nitrates, which will exhaust NOx during the following calcination. Therefore, if catalysts with comparable performance to that of the impregnation method can be produced by a ball milling method, it will be of great help to save cost and reduce the emission of wastewater and waste gas. To our best knowledge, there are no reports on the preparation of Ce–La/TiO2 catalysts by ball milling method using carbonates as the starting materials. Also, there is no report on the comparison of the catalytic activity of the Ce–La/TiO2 catalysts prepared by different methods.
In this work, in order to compare the effects of ball milling, impregnation and co-precipitation on the catalytic activity, and to minimize pollution during the catalyst preparation, Ce–La/TiO2 catalysts with the same mass ratio were prepared using different methods or precursors (NO3−, OH−, CO32−). All catalysts conduct catalytic reaction in the same simulated flue gas environment. In order to analyze the denitration performance of the catalyst from its phase, morphology, specific surface area, acidic sites and redox capacity, a series of characterizations such as XRD, SEM, BET, XPS, H2-TPR and NH3-TPD were carried out. The apparent activation energy and turn over frequency (TOF) of NH3-SCR catalyst were calculated.
2. Experimental
2.1 Materials and reagents
| Preparation method | Starting materials | Abbreviation |
|---|---|---|
| Ball milling | Ce2(CO3)3, La2(CO3)3, TiO2 | BC-10Ce–2La/TiO2 |
| Ball milling | Ce(OH)4, La(OH)3, TiO2 | BH-10Ce–2La/TiO2 |
| Impregnation | Ce(NO3)3·6H2O, La(NO3)3, 6H2O, TiO2 | IN-10Ce–2La/TiO2 |
| Co-precipitation | Ce(NO3)3·6H2O, La(NO3)3, 6H2O, TiO2 | CN-10Ce–2La/TiO2 |
2.2 Instrumental measurements
An X-ray diffractometer (Thermo ARL SCINTAG X'TRA) was used to examine the phase composition of the samples. The X-ray source was Cu Kα radiation (wavelength 0.154056 nm) operated at an accelerating voltage of 40 kV and a tube current of 40 mA. The sample was tested by N2 adsorption automatic pore specific surface area analyzer (Builder SSA-7300). The specific surface area (m2 g−1), pore volume and average pore diameter of the catalyst were calculated from the desorption branch of the isotherm in the pressure range of 0.05–0.30 by Brunauer–Emmett–Teller (BET) equation, t-plot method and Barrett–Joyner–Halenda (BJH) model, respectively. The morphology of the catalyst was observed on a transmission electron microscope (TEM, Talos F200x, FEI, USA) with a Super-X energy dispersive spectrometer (EDS) for the test of the elemental mappings. Before the observation, the sample was dispersed in anhydrous ethanol and dried. X-ray photoelectron spectroscopy (XPS) was performed on a Thermo Scientific K-Alpha electron spectrometer with an Al Kα (hν = 1486.6 eV) radiation source operated at 12 kV with a vacuum pressure of 3 × 10⁻⁵ Pa. All binding energies were calibrated by the standard C1s peak (284.8 eV). Temperature programmed desorption/reduction (TPD/TPR) experiments were carried out on a chemisorption apparatus (Micromeritics, AutoChem II 2920). First, appropriate amount of sample was weighed and put into a reaction tube, and then heated from room temperature to 350 °C for surface impurities removal. Then, the sample was purged with He gas flow for 1 h and cooled to 50 °C. For NH3-TPD, 10% NH3/He mixture was injected for 1 h until the adsorption was saturated, then He gas flow was introduced for 1 h to remove weak physical adsorption of NH3 on the surface. Finally, the temperature was raised to 700 °C at a heating rate of 10 °C min−1 in He flow and a TCD detector was used for the detection of the NH3 desorption. For H2-TPR, 10% H2/Ar mixture was used and the sample was heated to 1000 °C at a heating rate of 5 °C min−1 and detected the reducing gas with a TCD.2.3 Catalytic test
First, the as-prepared catalysts were ground in a KQM-Z/B planetary ball miller and coated to a honeycomb cordierite carrier with size of φ20 × L50. After drying in an oven, the loaded cylinders were placed in a quartz tube furnace to test the catalytic activity. The loading weight of the catalyst was 1 g. The fed gas mixture consisted of 500 ppm NO, 500 ppm NH3, 5% H2O, 3% O2 and the balanced N2. The total gas flow was 2500 mL min−1, hence the corresponding gas hourly space velocity (GHSV) was calculated to be 150![[thin space (1/6-em)]](https://www.rsc.org/images/entities/char_2009.gif) 000 mL g−1 h−1. The outlet concentrations of NO and NO2 were measured using an ECOM flue gas analyzer (Germany), and the outlet N2O concentration was detected using a KRM50 infrared analyzer. The temperature control was performed by a computer program. The NO conversion and N2 selectivity were calculated according to the following equations:15
000 mL g−1 h−1. The outlet concentrations of NO and NO2 were measured using an ECOM flue gas analyzer (Germany), and the outlet N2O concentration was detected using a KRM50 infrared analyzer. The temperature control was performed by a computer program. The NO conversion and N2 selectivity were calculated according to the following equations:15
 | (1) |
 | (2) |
At high GHSV, assuming that the NH3-SCR catalytic reaction is not controlled by diffusion but by the dynamic mode, the normalized SCR reaction rate constant per specific surface area of the catalyst can be calculated according to the following equation:16,17
 | (3) |
The turnover frequency (TOF) values were used to compare the catalytic rates of the different catalysts. To ensure that the SCR reaction was not controlled by diffusion, the NO conversion was controlled below 20% by increasing GHSV and the TOF value of NO at the active center Ce was calculated by the following equation:18,19
 | (4) |
3. Results and discussion
3.1 Characterization of catalysts
Fig. 1 shows the X-ray diffraction patterns of the four catalysts. It can be seen that the main phase of all samples was anatase TiO2 (JCPDS no. 21-1272). Weak diffraction peaks of ceriamite CeO2 (JCPDS no. 43-1002) were detected near 28.6°, 33°, etc. Among them, BC-10Ce–2La/TiO2 has the strongest CeO2 peak (111 crystal plane), while BH-10Ce–2La/TiO2 has the weakest diffraction peak, indicating that the precursors can induce CeO2 crystallization to different degree. The high crystallization of BC-10Ce–2La/TiO2 catalyst can promote the activation of NH3,3 which is consistent with its high catalytic activity. No peaks of La2O3 species were observed for all samples, which might be related to their low content, poor crystallinity and high dispersion on the catalyst surface.20 | ||
| Fig. 1 XRD pattern of BH-10Ce–2La/TiO2, CN-10Ce–2La/TiO2, IN-10Ce-2La/TiO2 and BC-10Ce-2La/TiO2 catalysts. | ||
Table 2 lists the specific surface area (SBET), pore volume (VP) and average pore size (DP) of the catalysts measured by N2 adsorption and desorption method. As can be seen from the table, except for BH-10Ce–2La/TiO2, the surface area and pore volume, pore size of other three catalysts showed almost no difference, which might be due to the same content of TiO2 as the carrier. The results showed that the catalysts prepared by the ball milling method with carbonates as the precursors had comparable temperature windows and catalytic activities with the conventional methods.
Fig. 2 shows the TEM images, HR-TEM images and the elemental mapping of the four catalysts. It can be seen from Fig. 2(a)–(d) that all catalysts have similar morphology and are porous structures formed by the accumulation of nanoparticles of different sizes, which helps to exhibit good catalytic activity.21 From the HR-TEM images in Fig. 2(e)–(h), a crystalline spacing of 0.35 nm can be observed in all the catalysts, corresponding to the (101) crystalline plane of anatase TiO2.22 The d spacing of 0.31, 0.26 and 0.19 nm correspond to the (111), (200) and (220) crystalline planes of CeO2, respectively.23 It is noteworthy that no lattice striations of the crystalline lanthanide oxide can be observed for all samples, suggesting that it exists on the catalyst surface in an amorphous structure.24 This is in agreement with the XRD results. Moreover, the elemental mappings of Ce, La and Ti (Fig. 2(i)–(t)) show that Ce, La and Ti elements are uniformly distributed in the catalysts.
 | ||
| Fig. 2 (a–d) TEM image, (e–h) HR-TEM, and (i–l) Ce, (m–p) La, (q–t) Ti mapping of BH-10Ce–2La/TiO2, CN-10Ce–2La/TiO2, IN-10Ce–2La/TiO2, and BC-10Ce–2La/TiO2. | ||
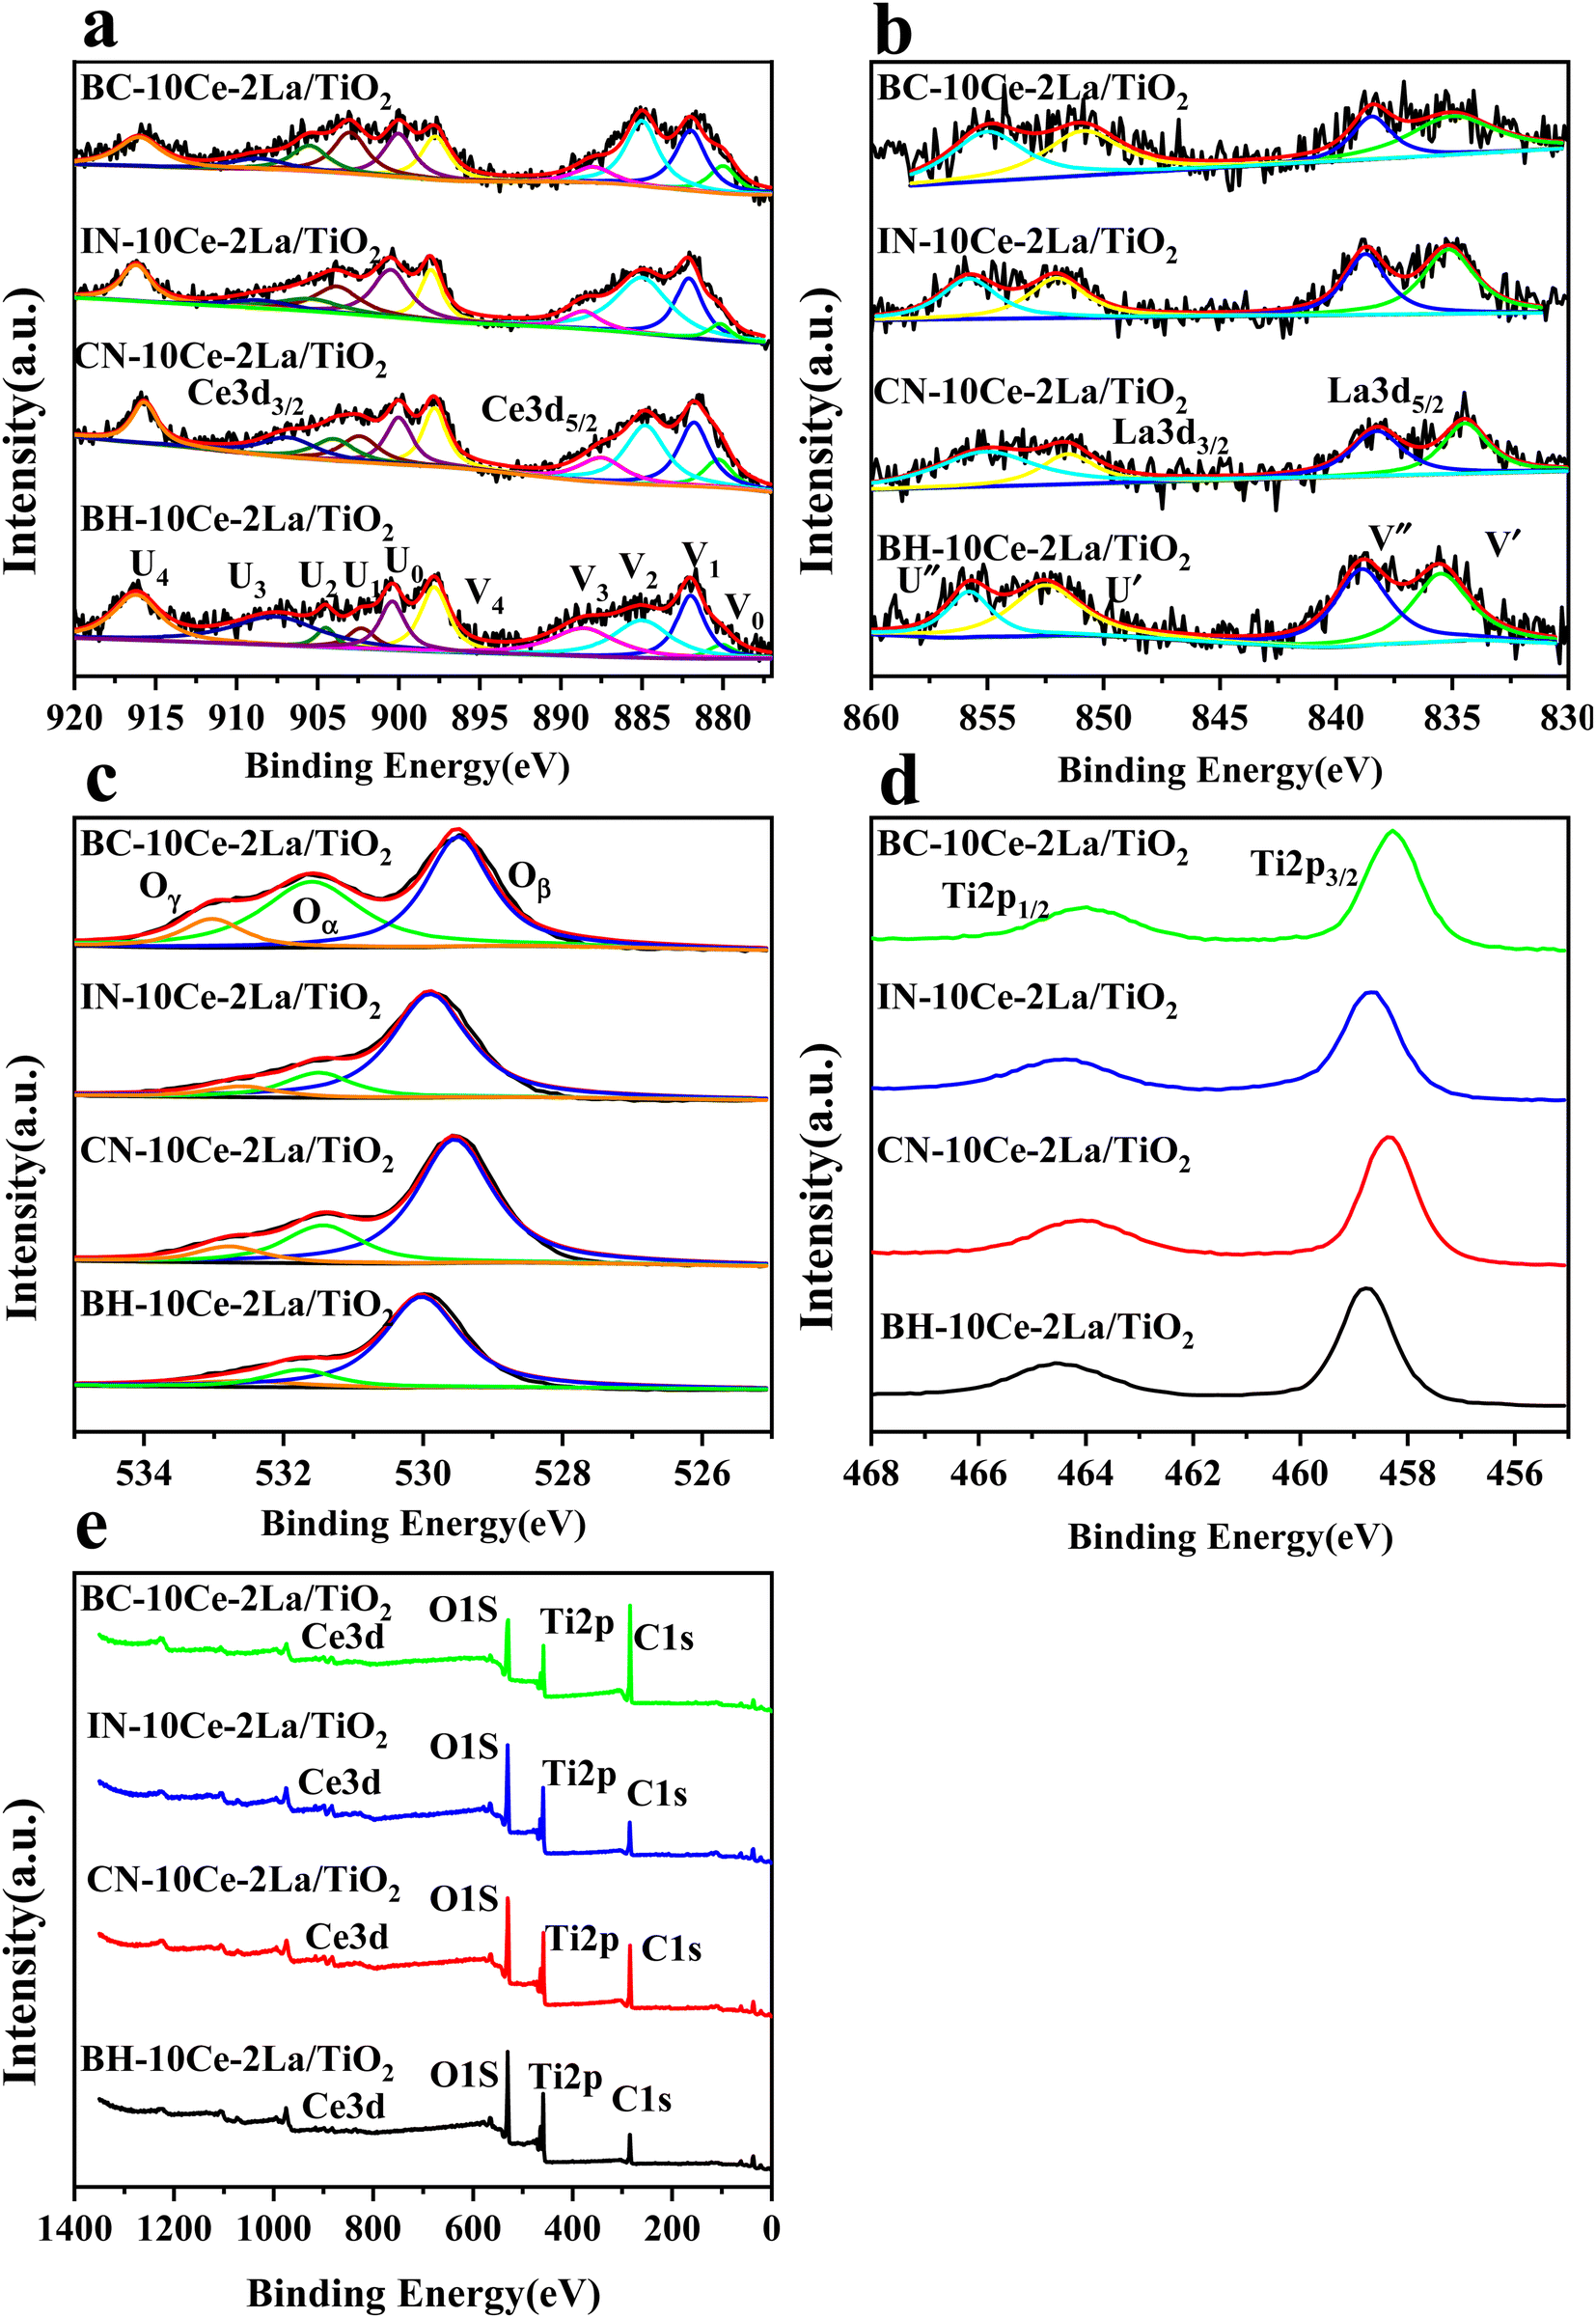
XPS was used to detect the electrovalence and the relative proportions of elements on the surface of the catalysts and shown in Fig. 3. Ten peaks of Ce 3d in Fig. 3(a) can be fitted, and the peaks labeled as “V” and “U” represents the 3d5/2 and 3d3/2 spin–orbit states of cerium, respectively. The peaks labeled V1, V3, and V4 are from Ce4+ 3d5/2, while the peaks labeled U1, U3, and U4 represent Ce4+ 3d3/2. In addition, the peaks of V0, V2 and U0, U2 belong to Ce3+ 3d5/2 and Ce3+ 3d3/2, respectively. The presence of V0/U0 and V2/U2 double peaks indicates that the catalyst contains some oxygen vacancies and is in a partially reduced state.25 Table 3 lists the surface element concentrations and the ratios of Ce3+ and Oα for the catalysts calculated by XPS. The relative content of Ce3+ in these samples can be calculated by the following equation for the integral peak area ratio of Ce3+ and total Ce:26 Ce3+ (%) = (SV0 + SV2 + SU0 + SU2)/∑(SU + SV) × 100% and is presented in Table 3. It can be seen that the highest percentage of Ce3+/(Ce3++Ce4+) on the surface of IN-10Ce–2La/TiO2 catalyst is 48.87%, while those on BC-10Ce–2La/TiO2, CN-10Ce–2La/TiO2 and BH-10Ce–2La/TiO2 are 42.52%, 41.18% and 30.46%, respectively. It is noteworthy that BH-10Ce–2La/TiO2 exhibits the lower Ce3+ and Oα ratios than that of IN-10Ce–2La/TiO2 and CN-10Ce–2La/TiO2. The low Ce3+ ratio of BH-10Ce–2La/TiO2 can be attributed to the starting material of Ce(OH)4. On the other hand, a higher proportion of Ce3+ can promote the generation of oxygen vacancies, unsaturated chemical bonds and charge imbalance on the catalyst surface, thus further promoting the NO oxidation reaction.27,28
 | ||
| Fig. 3 XPS of BH-10Ce–2La/TiO2, CN-10Ce–2La/TiO2, IN-10Ce–2La/TiO2 and BC-10Ce–2La/TiO2 catalysts. (a) Ce 3d; (b) La 3d; (c) O 1s; (d) Ti 2p; (e) Survey spectra. | ||
| Catalysts | Surface atomic concentration (atom%) |
|
|
|||
|---|---|---|---|---|---|---|
| O | Ce | La | Ti | |||
| BC-10Ce–2La/TiO2 | 76.92 | 1.99 | 0.48 | 20.64 | 42.52% | 47.62% |
| IN-10Ce–2La/TiO2 | 69.37 | 3.05 | 0.57 | 26.99 | 48.87% | 17.89% |
| CN-10Ce–2La/TiO2 | 69.19 | 2.44 | 0.46 | 24.24 | 41.18% | 23.85% |
| BH-10Ce–2La/TiO2 | 69.19 | 1.36 | 0.54 | 27.30 | 30.46% | 17.72% |
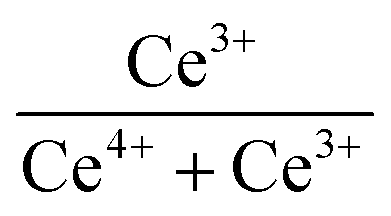
In Fig. 3(b), both the XPS peaks of La 3d5/2 and 3d3/2 exhibit double splitting, one is attributed to spin–orbit interactions and the other is electron transfer from the valence band of oxygen to the empty La 4f energy level orbital.29 Compared with BC-10Ce–2La/TiO2, the peaks of IN-10Ce–2La/TiO2 and BH-10Ce–2La/TiO2 shifted toward the high binding energy direction, which indicated that the interaction between Ce and La of BC-10Ce–2La/TiO2 was enhanced. In Fig. 3(c), the lower binding energy (529.5–530 eV) of O1s is attributed to lattice oxygen, denoted as Oβ; the higher binding energy (531.4–531.8 eV) is attributed to surface unsaturated oxygen, denoted as Oα; and the highest peak (532–532.8 eV) corresponds to adsorbed water, denoted as Oγ.7,10 Because Oα has a higher mobility than the lattice oxygen Oβ, Oα can lead to form more surface oxygen vacancies and subsequently be more highly active in oxidation reactions. As can be seen from Table 3, the Oα concentration (76.92%) and Oα/(Oα + Oβ) ratio (47.62%) of BC-10Ce–2La/TiO2 are the highest among all catalysts, which is favorable for the oxidation of NO to NO2 in the “fast SCR” mechanism.30 BC-10Ce–2La/TiO2 has the second highest Ce3+ and the highest Oα ratio. The catalytic activity of BC-10Ce–2La/TiO2 is slightly greater than that of IN-10Ce–2La/TiO2 and CN-10Ce–2La/TiO2, indicating that both Ce3+ and Oα ratio have an effect on the catalytic activity. The reason for the difference in Ce3+ and Oα ratio may be due to the difference of the new generated CeO2 decomposed by Ce2(CO3)3, Ce(NO3)3, Ce(OH)3 (for CN-10Ce–2La/TiO2), and Ce(OH)4 of the different method. Also, the ball milling method accounts for the difference in Ce3+ and Oα ratio, because the mechanical movement is benefit to improve the Oα ratio.31 Therefore, the ball milling process can be used to control the dispersion of the active component on the catalyst surface and improve the redox characteristics by increasing the Ce3+ and Oα ratio. In the XPS of Ti 2p (Fig. 3(d)), two broad peaks are observed at approximately 458.5 eV and 464.5 eV for all samples, showing Ti presents in the highest oxidation valence Ti4+.30,32 In addition, all the peaks of Ce, La, O, Ti and C can be found in the survey XPS of Fig. 3(e).
The redox properties of the catalysts were studied using H2-TPR and the results were shown in Fig. 4(a). All samples have reduction peaks at ∼550 °C, which can be attributed to the reduction of surface-ligated unsaturated Ce4+ that plays an important role in the oxidation reaction.33 In contrast, the smaller reduction peak over 600 °C is the reduction of the bulk phase of Ce4+ species.34 The hydrogen consumption of the reduction peak between 400 and 600 °C was quantified using CuO as the standard and listed in Table 4. Compared with other three samples, the reduction peak position of BC-10Ce–2La/TiO2 catalyst was the lowest and the hydrogen consumption (1.37 mmol g−1) was the highest, indicating the strongest redox ability. The results show that the surface active species of the BC-10Ce–2La/TiO2 are highly dispersed, which not only improves the redox capacity of the catalyst, but also enhances its oxygen storage capacity. The result is consistent with the XPS calculation.
 | ||
| Fig. 4 (a) H2-TPR and (b) NH3-TPD curves of BH-10Ce–2La/TiO2, CN-10Ce–2La/TiO2, IN-10Ce–2La/TiO2, and BC-10Ce–2La/TiO2 catalysts. | ||
| Sample | Peak position (°C) | H2 consumption (mmol g−1) |
|---|---|---|
| BC-10Ce–2La/TiO2 | 536 | 1.37 |
| IN-10Ce–2La/TiO2 | 558 | 1.21 |
| CN-10Ce–2La/TiO2 | 545 | 1.16 |
| BH-10Ce–2La/TiO2 | 553 | 0.93 |
The types and numbers of acidic sites of the catalysts were investigated by NH3-TPD and the results were shown in Fig. 4(b). The remarkable strong peaks below 200 °C and weak peaks at around 266 °C can be observed for all samples, which can be attributed to NH3 desorbed from the weak and medium to strong acid sites of the catalysts, respectively.33 For BC-10Ce–2La/TiO2, there is also a broad desorption peak at 510 °C which can be attributed to the desorption of ammonia ligated to strong acidic sites.35 Compared with the other three catalysts, the desorption peak of BC-10Ce–2La/TiO2 shifts toward higher temperatures and has a larger desorption peak area, implying that the most NH3 adsorbed on the surface.36 The above results show that the ball milling process can improve the quantity and the concentration of the acid sites on the catalyst, which helps to improve the denitrification efficiency of the catalyst.
3.2 Catalytic properties
 | ||
| Fig. 5 (a) NO conversion, (b) N2 selectivity, and (c) N2O concentration of BH-10Ce–2La/TiO2, CN-10Ce–2La/TiO2, IN-10Ce–2La/TiO2 and BC-10Ce–2La/TiO2 catalysts. | ||
In addition to catalytic activity, N2 selectivity is also an important factor to evaluate the catalyst performance. As shown in Fig. 5(b) and (c), when the reaction temperature was higher than 350 °C, N2O started to generate, leading to a slow decrease of the N2 selectivity. In the reaction temperature interval, the N2 selectivity of all catalysts except CN-10Ce–2La/TiO2 is higher than 95.4%, which is very favorable for their practical applications. Considering that the preparation process of ball milling method has minimal environmental pollution and the products have the highest catalytic activity, BC-10Ce–2La/TiO2 should have a broad application prospect.
 | ||
| Fig. 6 (a) Arrhenius plot in 250–350 °C, (b) TOF values in 200–270 °C of CN-10Ce–2La/TiO2, IN-10Ce–2La/TiO2 and BC-10Ce–2La/TiO2 catalysts. | ||
3.3 Effect of preparation methods on the activity of Ce–La/TiO2 catalysts
Compared with impregnation method and co-precipitation method, the ball milling prepared catalyst shows excellent Ce3+ and Oα Ratio, which not only benefits from the carbonate raw materials, making the active components on the catalyst surface more dispersed, but also benefits from the physical treatment process of ball milling. The high-energy ball milling process can not only enhance the interaction between Ce oxide and other oxides, but also increase the fragmentation, extrusion and structural defects of the sample, which induces the transformation of Ce4+ to Ce3+ to a certain extent. Uniform active components will further improve the redox ability of the catalyst and improve the number and concentration of acid sites of the catalyst. Obviously, these advantages make BC-10Ce–2La/TiO2 have better catalytic performance and higher TOF value than other catalysts.4. Conclusion
In conclusion, different preparation methods and precursors have an impact on the catalytic activity of high temperature catalysts. Compared with the catalysts prepared by conventional impregnation and co-precipitation methods, the ball milling method using carbonate instead of nitrate as raw material has uniform active sites, optimal redox properties and good acidic sites. Carbonate not only can induce CeO2 crystallization to a certain extent, but also avoid the secondary pollution problem caused by the release of NOx during calcination with nitrate as raw material. In addition, the ball milling process has the advantages of simple operation, low grinding cost, no dust flying, and sustainable intermittent production. The less use of chemicals in the preparation process makes the environmental burden of the method relatively small, which is more in line with the requirements of green production and sustainable development, and provides a new idea for the preparation and production of denitrification catalysts.Author contributions
Na Wang: conceptualization, data curation, formal analysis, funding acquisition, investigation, methodology, project administration, supervision, validation, writing – review & editing. Lei Wang: writing – original draft, data curation, formal analysis, investigation, methodology. Huidong Xie: investigation, methodology, project administration, supervision. Yang Liu: investigation, methodology. Yepeng Sun: data curation, formal analysis. Chang Yang: data curation, formal analysis. Chengmin Ge: conceptualization, funding acquisition, supervision, validation.Conflicts of interest
The authors declare that they have no known competing financial interests or personal relationships that could have appeared to influence the work reported in this paper.Acknowledgements
The work was supported by the National Natural Science Foundation of China under grant No. 51708447 and Major Scientific and Technological Innovation Projects of Shandong Province under grant No. 2019JZZY010343. The project is also supported by the Science and Technology Planning Project of Yulin City, Shaanxi Province under grant CXY-2021-135.References
- S. Ding, F. Liu, X. Shi, K. Liu, Z. Lian, L. Xie and H. He, ACS Appl. Mater. Interfaces, 2015, 7, 9497–9506 CrossRef CAS PubMed
.
- D. W. Kwon, K. H. Park and S. Chang, Appl. Catal., A, 2013, 451, 227–235 CrossRef CAS
- Z. Liu, J. Zhu, S. Zhang, L. Ma and S. I. Woo, Catal. Commun., 2014, 46, 90–93 CrossRef CAS
- V. Pârvulescu, S. Boghosian, S. M. Jung and P. Grange, J. Catal., 2003, 217, 172–185 Search PubMed
- Y. Peng, W. Si, X. Li, J. Chen, J. Li, J. Crittenden and J. Hao, Environ. Sci. Technol., 2016, 50, 9576–9582 CrossRef CAS
- K. Liu, H. He, Y. Yu, Z. Yan, W. Yang and W. Shan, J. Catal., 2019, 369, 372–381 CrossRef CAS
- N. Wang, C. Ye, H. Xie, L. Wang, B. Zheng, Y. He, C. Yang, J. Zhou and C. Ge, Catal. Sci. Technol., 2021, 11, 6112–6125 RSC
- Y. He, M. E. Ford, M. Zhu, Q. Liu, U. Tumuluri, Z. Wu and I. E. Wachs, Appl. Catal., B, 2016, 193, 141–150 CrossRef CAS
- N. Maeda, A. Urakawa, R. Sharma and A. Baiker, Appl. Catal., B, 2011, 103, 154–162 CrossRef CAS
- P. Xu, J. Zheng, F. Jing and W. Chu, Mol. Catal., 2021, 508, 111586 CrossRef CAS
- C. Chen, H. Xie, P. He, X. Liu, C. Yang, N. Wang and C. Ge, Appl. Surf. Sci., 2022, 571, 151285 CrossRef CAS
- Y. Pan, B. Shen, L. Liu, Y. Yao, H. Gao, C. Liang and H. Xu, Fuel, 2020, 282, 118834 CrossRef CAS
- S. L. James, C. J. Adams, C. Bolm, D. Braga, P. Collier, T. Friscic, F. Grepioni, K. D. Harris, G. Hyett, W. Jones, A. Krebs, J. Mack, L. Maini, A. G. Orpen, I. P. Parkin, W. C. Shearouse, J. W. Steed and D. C. Waddell, Chem. Soc. Rev., 2012, 41, 413–447 RSC
- Y. Hu, H. Li, Z. Li, B. Li, S. Wang, Y. Yao and C. Yu, Green Chem., 2021, 23, 8754–8794 RSC
- L. Zhang, L. Li, Y. Cao, X. Yao, C. Ge, F. Gao, Y. Deng, C. Tang and L. Dong, Appl. Catal., B, 2015, 165, 589–598 CrossRef CAS
- B. Shen, Y. Wang, F. Wang and T. Liu, Chem. Eng. J., 2014, 236, 171–180 CrossRef CAS
- Y. Liu, J. Xu, H. Li, S. Cai, H. Hu, C. Fang, L. Shi and D. Zhang, J. Mater. Chem. A, 2015, 3, 11543–11553 RSC
- G. Zhang, W. Han, H. Zhao, L. Zong and Z. Tang, Appl. Catal., B, 2018, 226, 117–126 CrossRef CAS
- G. Zhang, W. Han, F. Dong, L. Zong, G. Lu and Z. Tang, RSC Adv., 2016, 6, 76556–76567 RSC
- L. Gao, C. Li, P. Lu, J. Zhang, X. Du, S. Li, L. Tang, J. Chen and G. Zeng, Fuel, 2018, 215, 30–39 CrossRef CAS
- N. Wang, C. Ye, H. Xie, C. Yang, J. Zhou and C. Ge, RSC Adv., 2021, 11, 9395–9402 RSC
- X. Zhao, S. Ma, Z. Li, F. Yuan, X. Niu and Y. Zhu, Chem. Eng. J., 2020, 392, 123801 CrossRef CAS
- X. Yao, L. Chen, J. Cao, F. Yang, T. Wei and L. Dong, Ind. Eng. Chem. Res., 2018, 57, 12407–12419 CrossRef CAS
- L. Meng, J. Wang, Z. Sun, J. Zhu, H. Li, J. Wang and M. Shen, J. Rare Earths, 2018, 36, 142–147 CrossRef CAS
- B. M. Reddy, A. Khan, Y. Yamada, T. Kobayashi, S. p. Loridant and J.-C. Volta, J. Phys. Chem. B, 2003, 107, 5162–5167 CrossRef CAS
- P. Sudarsanam, B. Hillary, M. H. Amin, S. B. A. Hamid and S. K. Bhargava, Appl. Catal., B, 2016, 185, 213–224 CrossRef CAS
- T. Zhang, R. Qu, W. Su and J. Li, Appl. Catal., B, 2015, 176–177, 338–346 CrossRef CAS
- L. Chen, J. Li, M. Ge and R. Zhu, Catal. Today, 2010, 153, 77–83 CrossRef CAS
- R. Dudric, A. Vladescu, V. Rednic, M. Neumann, I. G. Deac and R. Tetean, J. Mol. Struct., 2014, 1073, 66–70 CrossRef CAS
- H. Liu, Z. Fan, C. Sun, S. Yu, S. Feng, W. Chen, D. Chen, C. Tang, F. Gao and L. Dong, Appl. Catal., B, 2019, 244, 671–683 CrossRef CAS
- Z. Meng, X. Yan, M. Cui, L. Hou and W. Wu, Mater. Chem. Phys., 2022, 276, 125248 CrossRef CAS
- S. Ma, X. Zhao, Y. Li, T. Zhang, F. Yuan, X. Niu and Y. Zhu, Appl. Catal., B, 2019, 248, 226–238 CrossRef CAS
- C. Fang, D. Zhang, L. Shi, R. Gao, H. Li, L. Ye and J. Zhang, Catal. Sci. Technol., 2013, 3, 803–811 RSC
- Z. Liu, J. Zhu, J. Li, L. Ma and S. I. Woo, ACS Appl. Mater. Interfaces, 2014, 6, 14500–14508 CrossRef CAS PubMed
- T. Boningari, P. R. Ettireddy, A. Somogyvari, Y. Liu, A. Vorontsov, C. A. McDonald and P. G. Smirniotis, J. Catal., 2015, 325, 145–155 CrossRef CAS
- S. Yang, J. Li, C. Wang, J. Chen, L. Ma, H. Chang, L. Chen, Y. peng and N. Yan, Appl. Catal., B, 2012, 117–118, 73–80 CrossRef CAS
- J. Xue, X. Wang, G. Qi, J. Wang, M. Shen and W. Li, J. Catal., 2013, 297, 56–64 CrossRef CAS
- M. Zhu, J. K. Lai, U. Tumuluri, Z. Wu and I. E. Wachs, J. Am. Chem. Soc., 2017, 139, 15624–15627 CrossRef CAS PubMed
| This journal is © The Royal Society of Chemistry 2022 |