 Open Access Article
Multiwalled carbon nanotube network connected Mg0.5Ti2(PO4)3 composites to improve sodium storage performance†
Shuang Dinga,
Jie Yuan *b,
Huijin Lia,
Xianli Yuana,
Min Lib and
Chaoqiao Yanga
aCollege of Environmental and Chemical Engineering, Dalian University, Dalian, 116622, Liaoning, China
bSchool of Chemistry and Materials Engineering, Liupanshui Normal University, Liupanshui, 553004, Guizhou, China. E-mail: yuanjieedu@163.com
First published on 14th December 2022
Abstract
The research on sodium-ion batteries (SIDs) has aroused intensive attention. In this work, the Mg0.5Ti2(PO4)3 (MTP) composite material with NASICON structure has been studied as an anode material in SIDs. The sol–gel method is used to synthesize the Mg0.5Ti2(PO4)3 with a conductive network that can be constructed by using carbon nanotubes (CNTs) and phenolic resin as the amorphous source of carbon coating. The CNT network is used not only to improve the outcome of electrolyte penetration and reduce the internal resistance to diffusion but also to create a fast path for electron transport, thereby elevating the level of electronic conductivity. The phenolic resin is generated on the surface of MTP which extends its cycle life. The carbon-coated Mg0.5Ti2(PO4)3 with 0.10 g CNTs (MTP–CNT10) displays optimal performance as an anode material in SIDs, and shows a discharge capacity of 298.8 mA h g−1, 258.3 mA h g−1 and 254.8 mA h g−1 at 0.1C, 0.5C and 1C, respectively. Besides, the capacity retention rate reaches 92% after 300 cycles at 10C. This study contributes an effective solution to improving the electrochemical performance of electrode materials through the introduction of carbon coating and highly conductive materials.
1. Introduction
The greenhouse effect and diminishing fossil fuel resources have promoted the global effort made to explore new-generation energy storage systems (EESs). Among them, electrochemical energy storage demonstrates such advantages as high energy density, high energy conversion efficiency and fast response, which draws attention from many researchers.1–4 The lithium-ion batteries with high energy density have received popularity in the mainstream market of ‘4C’ products (i.e. computers, communications, networks and consumer electronics), and they have even promoted the development of hybrid electric vehicles (HEV) and electric vehicles (EV). Compared with lithium-ion batteries (LIBs), sodium-ion batteries (SIBs) are more desirable in terms of cost and availability, which makes it more competitive in the field of large-scale energy storage. Since Na+ has a much larger weight and radius than Li+, it is common for the slow and irreversible phase transition (or even structural failure) to occur, which is undesirable. It is thus essential to develop the master lattices with fast Na+ diffusion channels and stable skeletons.5–8 Among various anode materials developed for NaTi2(PO4)3 (NTB), the electrode materials classified as sodium superion conductors (NASICON) have attracted extensive attention due to their stable three-dimensional skeleton, rapid alkali metal ion diffusion path and plentiful deintercalation sites.9–11NASICON-type titanium-based phosphates, such as lithium titanate phosphate and sodium titanate phosphate, have open three-dimension framework, high ion conductivity, demonstrate excellent rate performance and high cycle stability whether in aqueous or non-aqueous battery materials.12,13 However, there are still few studies on titanium magnesium phosphate to date. Initially, Barth et al. adopted the sol–gel method to synthesize titanium magnesium phosphate, which led to the finding that half of the octahedral M1 site was occupied by the Mg2+ ions sharing two adjacent octahedral TiO6 surfaces along the hexagonal c-axis. By inducing highly symmetrical oxygen coordination, the closed electronic shell of Mg2+ ions enhances the stability of the covalent [Ti2(PO4)3]− skeleton. The pore in the M2 site provides a path for migration and diffusion.14 Through in situ X-ray diffraction, C. Vidal-Abarca et al. explored the insertion behavior of sodium ions and lithium ions in Mg0.5Ti2(PO4)3. There were two different regions detected during the discharge of lithium batteries. The insertion of lithium at M1 and M2 sites led to the quasi plateaus of 2.8 and 2.0 V, while the sodium battery showed a single quasi plateau given the insertion at M2 site.15 As the electronic conductivity based on NASICON is unsatisfactory, it is necessary to make change. Currently, there are some mainstream strategies that can be adopted to break this obstacle for improved battery performance. On the one hand, a small number of other metal ions can be doped to improve the intrinsic conductivity. Hiroo Takahashi and Hitoshi Takamura studied how to produce the Al-doped Mg0.5Ti2(PO4)3 with high ionic conductivity, finding out that Al doping could reduce particle size and increase activation energy. On the other hand, conductive carbon materials can be used in surface coating to improve the apparent conductivity.16,17 Zhuo-Er Yu et al. produced carbon-coated magnesium titanate by ball milling with sucrose as the carbon source. MTP performed well in capacity retention at a low rate. Moreover, as suggested by the results of elemental analysis, ex situ neutron diffraction (ND) and density functional theory (DFT) calculations, Mg ions remained at the M1 position during charge and discharge, rather than being replaced by ions in the electrolyte. This is conducive to improving structural stability.18 The introduction of such highly conductive materials as carbon nanotubes,19–21 graphite22,23 and graphene24–28 to produce composite materials for improved apparent conductivity is considered an effective and cheap solution compare with metal doping. Ye et al. produced the self-generated hollow NaTi2(PO4)3 nanocubes with graphene for use in sodium-ion batteries. It features a high specific capacity of 128 mA h g−1, which is comparable to the theoretical capacity of NaTi2(PO4)3 electrode at 0.1C. Even though the discharge rate reaches 50C, the capacity retention can still reach 60%. The excellent electrochemical performance achieved by it is attributed to the large surface area of the hollow structure and the high conductivity of the three-dimensional reduced graphene oxide. This is conducive to the immersion of the electrolyte, which not only expands the area of contact between the nanocubes and the electrolyte but also accelerates the transfer of Na+/e− to nanocomposites. Notably, the unique hollow structure and its combination with graphene are effective in accommodating the volume changes that occur during repeated sodiumation and desodiumation.29 Xu et al. produced LiTi2(PO4)3@C/CNTs (LTP@C/CNTs) with three-dimensional mesoporous nanostructure, which was investigated in both aqueous lithium-ion batteries (ALIBs) and aqueous sodium-ion battery (ASIBs). Improved rate and cycling performance at high current densities were demonstrated in contrast to LiTi2(PO4)3@C(LTP@C). Typically, the LTP@C/CNTs electrode achieves a discharge capacity of 97.37 mA h g−1 and 90.88 mA h g−1 in ALIBs and ASIBs at 3 A g−1 current density.30 The research on NASICON-structured sodium titanium phosphate and lithium titanium phosphate is mainly to improve its electronic conductivity by controlling the particle size, coating a carbon layer or adding high conductive materials (graphene and carbon nanotubes). However, few studies were carried out on magnesium titanium phosphate combined with CNTs as anode materials in sodium-ion batteries.
Herein, the sol–gel method is adopted to synthesize the conductive network that can be constructed by carbon nanotubes, with phenolic resin as the coating source of amorphous carbon coating to protect Mg0.5Ti2(PO4)3. A carbon nanotube network not only improves the outcome of electrolyte penetration and reduces the internal resistance to diffusion, but also provides a fast path for electron transport, thereby enhancing its electronic conductivity.31 Besides, the phenolic resin extends its cycle life through the formation of a protective layer on the surface of MTP. The optimal material shows a discharge capacity of 298.8 mA h g−1, 258.3 mA h g−1 and 254.8 mA h g−1 at a rate of 0.1C, 0.5C and 1C, respectively. At 10C, the capacity retention rate is 92% after 300 cycles.
2. Experimental
2.1. Synthesis
As shown in Fig. 1, 0.2681 g of magnesium acetate tetrahydrate was dissolved in 20 mL of ethanol, and denoted as solution A. 1.7204 g of n-butyl titanate was dissolved in 20 mL of ethanol and labeled as solution B. Solution A was added dropwise into solution B, and 0.17 g of phenolic resin was added after uniform mixing. 2 mL of concentrated hydrochloric acid and multi-walled carbon nanotubes. 15 mL of ethanol solution, which contained 0.8567 g of phosphoric acid (85 wt%) was added. It was stirred in a water bath at 55 °C for 3 h. Then, the coating layer was opened up to evaporate the solvent at 70 °C. Next, it was placed into the oven and dried at 80 °C for 12 h. Finally, it was sintered at 750 °C for 5 h in a tube furnace, with argon as the protective atmosphere. The amounts of CNTs were 0, 0.05, 0.10, and 0.15 g, and corresponding composites were named as MTP, MTP–CNT5, MTP–CNT10 and MTP–CNT15, respectively.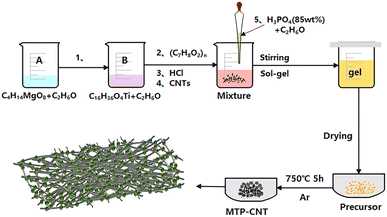 | ||
| Fig. 1 Preparation process of Mg0.5Ti2(PO4)3 composites connected by multi-walled carbon nanotubes network. | ||
2.2. Characterizations
The crystal structure was characterized by X-ray diffraction (XRD, Shimadzu 7000S) from 10° to 80°. The morphological and structural characterization was performed by means of scanning electron microscopy (SEM, ZEISS Gemini 300) and transmission electron microscopy (TEM, JEM-2800), respectively. The Raman spectra of the samples were captured by using a micro-laser Raman spectrometer (Thermo Scientific DXR, HORIBA). The elemental composition on the surface of the composites was examined by means of X-ray photoelectron spectroscopy (XPS, Thermo Scientific K-Alpha+). Thermogravimetric and differential thermal analyses of powder samples were performed by using a TGA instrument (TG, Discovery 550) at a heating rate of 10 °C min−1 in an air atmosphere from 30 °C to 800 °C.2.3. Electrochemical measurements
In order to study the electrochemical properties of the obtained SIB samples, the active materials, conductive acetylene black and polyvinylidene fluoride (PVDF) were uniformly mixed at a ratio of 7![[thin space (1/6-em)]](https://www.rsc.org/images/entities/char_2009.gif) :
:![[thin space (1/6-em)]](https://www.rsc.org/images/entities/char_2009.gif) 2
2![[thin space (1/6-em)]](https://www.rsc.org/images/entities/char_2009.gif) :
:![[thin space (1/6-em)]](https://www.rsc.org/images/entities/char_2009.gif) 1 to produce the slurry. Then, the mixture was coated on copper foil and dried in a vacuum oven and the mass loading of anode was about 1.15 mg cm−2. The battery components of the electrode were assembled in a glove box using a CR-2032 button battery. Glass microfiber filter membrane (Whatman, GF/D) was treated as the separator of the sodium ion battery, and a sodium metal sheet was taken as the counter electrode. The electrolyte of the sodium ion battery contained 1.0 M NaClO4 in the mixture of ethyl carbonate (EC) and diethyl carbonate (DEC) solution (volume ratio of 1
1 to produce the slurry. Then, the mixture was coated on copper foil and dried in a vacuum oven and the mass loading of anode was about 1.15 mg cm−2. The battery components of the electrode were assembled in a glove box using a CR-2032 button battery. Glass microfiber filter membrane (Whatman, GF/D) was treated as the separator of the sodium ion battery, and a sodium metal sheet was taken as the counter electrode. The electrolyte of the sodium ion battery contained 1.0 M NaClO4 in the mixture of ethyl carbonate (EC) and diethyl carbonate (DEC) solution (volume ratio of 1![[thin space (1/6-em)]](https://www.rsc.org/images/entities/char_2009.gif) :
:![[thin space (1/6-em)]](https://www.rsc.org/images/entities/char_2009.gif) 1). The assembled battery was discharged and charged at a rate ranging between 0.01 and 3.00 V (relative to Na/Na+). Cyclic voltammetry (CV) and electrochemical impedance spectroscopy (EIS) were performed on the electrochemical workstation named VersaSTAT 3 (Prinston, American), and the rate test was performed on the LAND battery test system (model CT3001A, Land, China) for the measurement in constant current charging and discharging tests.
1). The assembled battery was discharged and charged at a rate ranging between 0.01 and 3.00 V (relative to Na/Na+). Cyclic voltammetry (CV) and electrochemical impedance spectroscopy (EIS) were performed on the electrochemical workstation named VersaSTAT 3 (Prinston, American), and the rate test was performed on the LAND battery test system (model CT3001A, Land, China) for the measurement in constant current charging and discharging tests.
3. Results and discussion
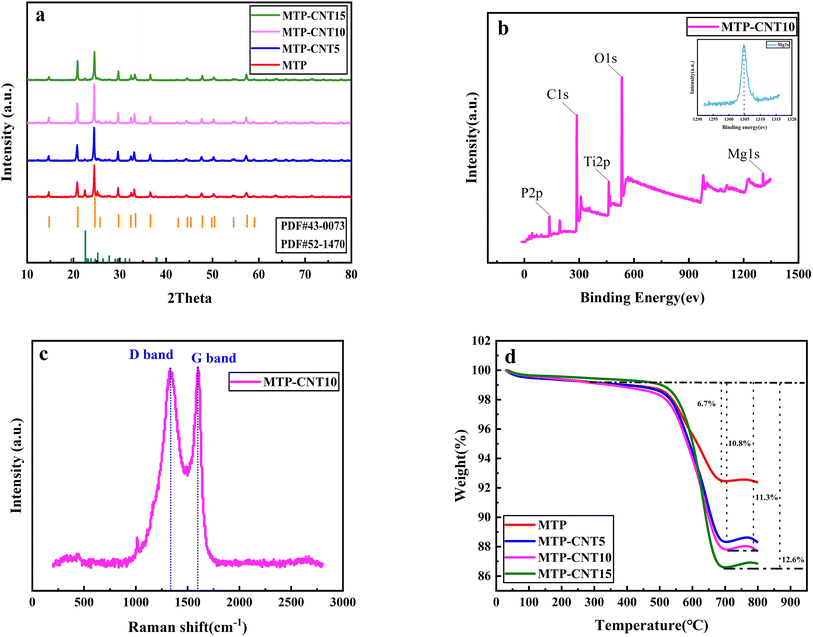
Fig. 2a shows the XRD patterns of MTP and MTP composites. As can be seen from the figure, the most important diffraction peaks of all samples are consistent with the standard card (JCPDS no. #43-0073). It should be noted that, the tiny peaks at 20°–30° can be related to the TiP2O7 (JCPDS no. #52-1470), which is due to the heat-treatment process leading to the side reaction of TiP2O7 production. With the addition of carbon nanotubes, the peaks of TiP2O7 become weak.32The surface composition of MTP–CNT10 composites was examined by X-ray photoelectron spectroscopy. According to Fig. 2b, the full spectrum of NTP@CNS shows six characteristic peaks at 137, 287, 462, 531 and 1303 eV, corresponding to P 2p, C 1s, Ti 2p, O 1s and Mg 1s, respectively. It evidences the presence of P, C, Ti, O and Mg elements in MTP–CNT10.
The carbon content of all samples was measured by TGA at a heating rate of 10 °C min−1 in the temperature range of 30–800 °C in air atmosphere, the results of which are shown in Fig. 2d. As can be seen from the figure, there is a small mass loss platform in the temperature range of 50–200 °C due to the loss of adsorbed water. The loss of coating carbon occurs when the temperature ranges from 200 to 700 °C.33 The mass loss of MTP coated with carbon sourced only from phenolic resin was 6.7%, while the carbon content of MTP–CNT5, MTP–CNT10 and MTP–CNT15 was 10.8%, 11.3% and 12.6%, respectively. Carbon content test evidence increase of CNTs may lead to the agglomeration of CNTs, which also affects the carbon coating effect of magnesium titanium phosphate, combined TEM image (Fig. S4†). The Raman spectra of CNTs (Fig. S5†) and MTP–CNT10 are shown in Fig. 2c. Apparently, there are two observable scattering peaks at about 1330 cm−1 and 1600 cm−1 in the Raman shift range from 200 to 2800 cm−1, which is attributed to the disordered structure (D band) and crystalline graphite carbon (G band), respectively. The intensity ratio of the D and G bands is 0.98, which could be applied to quantify surface defect degree. It can contribute the diffusion of Na+ between electrolyte and electrode. The small peak at 1034 cm−1 is PO43−.34–37
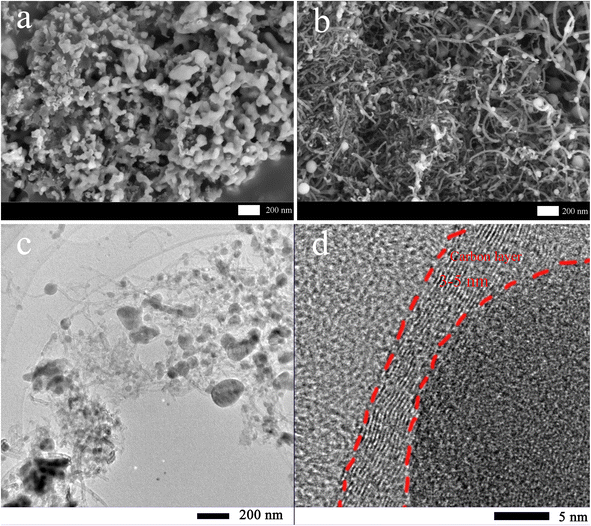
Fig. 3 shows the SEM images of MTP and MTP–CNT10. According to Fig. 3a, MTP is made up of nanoparticles and possesses a loose structure. As shown in Fig. 3b, the MTP–CNT10 with 0.10 g of CNT added has a much smaller particle size than MTP. The elemental distribution of MTP–CNT10 is shown in Fig. S2 and S3†. More SEM images of MTP, MTP–CNT5, MTP–CNT10, and MTP–CNT15 in Fig. S1.† Due to the looser structure, electrolyte infiltration is promoted. Therefore, the introduction of carbon nanotubes can effectively improve the conductivity of the composites and promote charge transfer, thus enhancing the electrochemical properties.37,38 Fig. 3c and d confirm that the MTP spheres in MTP–CNT10 are distributed in the conductive network constructed by carbon nanotubes. The particle size of the MTP spheres is 200 nm at maximum, and the thickness of the coated carbon layer ranges from 3 to 5 nm. Due to nanoparticle size, moderate carbon layer thickness and conductive network, it demonstrates a better performance in conductivity from a structural perspective.
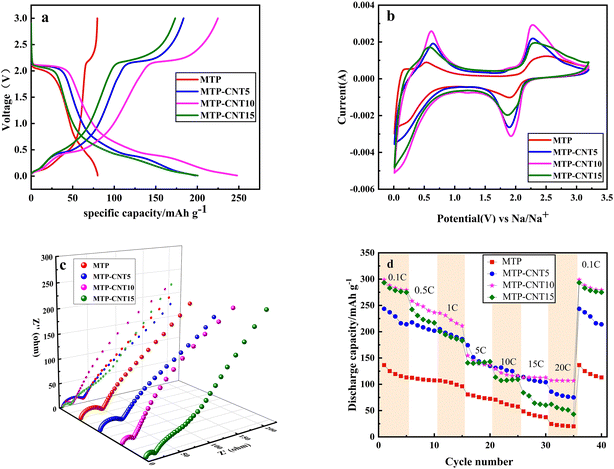
Fig. 4a presents the charge–discharge curve of MTP, MTP–CNT5, MTP–CNT10 and MTP–CNT15 at 1C, respectively. It can be seen from the figure that there is a major discharge platform at 2.1 V, which results from the conversion of Ti4+ into Ti3+. At roughly 0.5 V, a quasi-high principle is derived from the reduction of Ti3+ to Ti2+,39,40. It can be found out that the introduction of carbon nanotubes can significantly improve the electrochemical performances, which leads to a significant increase in the charge and discharge capacity. MTP–CNT10 achieves the highest discharge capacity of 254.4 mA h g−1. In order to verify the improvement of electrochemical performance, cyclic voltammetry tests were carried out at 5 mV s−1. According to the test results in Fig. 4b, the samples added with carbon nanotubes has more sharp polarization peaks, which evidences the effectiveness of introducing carbon nanotubes in improving its electrochemical performance. To sum up, the introduction of carbon nanotubes in small amounts could improve its electrochemical performance, but the excessive addition of such substances as MTP–CNT15 reduces its chemical performance, which might be due to the lack of active substances. In order to better understand the electrochemical behavior of the four samples, the electrochemical impedance spectroscopy after 10 cycles at 1C is presented in Fig. 4c. It can be seen that are semicircular in the high-frequency region, corresponding to the charge transfer resistance (Rct) at the interface between the electrode and the electrolyte, while the slope in the low-frequency region corresponds to the Warburg impedance. Table S1† shows EIS, fitting data for four composites about Rs, Rct and Warburg impedance. MTP–CNT10 and MTP–CNT15 showed the minimum charge transfer resistance and Warburg impedance, indicating that introducing an appropriate amount of carbon nanotubes could enhance the conductivity of sodium ions and their capability of diffusion. Thus, the overall electrochemical performance of the composites was improved. The discharge capacity is regarded as an important index to evaluate the electrochemical performance of materials. Fig. 4d shows the discharge capacity of four types of composites at a rate of 0.1C, 0.5C, 1C, 5C, 10C, 15C and 20C, respectively. Overall, the discharge capacity of all composites decreases with the rise of the rate, which is attributed to the extreme electrochemical polarization at a high rate. All the composites added with carbon nanotubes were outperformed by MTP. Among them, MTP–CNT10 produced the best rate performance, with a discharge capacity of 298.8 mA h g−1 at the rate of 0.1C. The discharge capacity was 258.3 mA h g−1 and 254.8 mA h g−1 at 0.5C and 1C, respectively. By contrast, MTP had a discharge capacity of 136.6 mA h g−1 at the rate of 0.1C. The discharge capacity of MTP–CNT5 and MTP–CNT15 at different rates was higher that of the first two, as confirmed by the previous 1C charge–discharge curve, cyclic voltammetry test and impedance test results. This is suspected to result from the addition of carbon nanotubes in small amounts that can enhance the conductivity of the electrode and improve its electrochemical performance. However, excessive carbon nanotube content may result in the agglomeration of carbon nanotubes and the reduction of Mg0.5Ti2(PO4)3, which can reduce the electrochemical performance of the composites.41,42
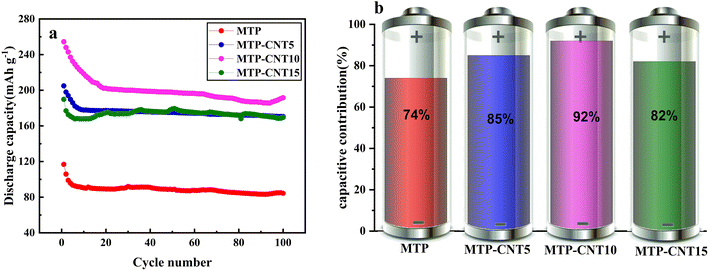
In order to further explore the stability of the carbon-coated titanium magnesium phosphate composite structure connected with a multi-walled carbon nanotubes network, the process of 100 cycles at 1C was tested, as shown in Fig. 5a. The four composites showed a certain degree of capacity loss in the first several cycles and then the rate of capacity loss declined. After 100 cycles, the discharge capacity of MTP, MTP–CNT5, MTP–CNT10 and MTP–CNT15 was 84.3, 170.5, 191.6 and 169.6 mA h g−1, respectively, which suggests the acceptable deterioration of capacity. Fig. 5b and S6† show the cycling stability of four composites from the capacity retention of 300 cycles at the rate of 10C. It can be found out that the capacity retention rate of MTP–CNT10 reaches 92% at a slightly higher rate of 10C.
4. Conclusions
The carbon-coated Mg0.5Ti2(PO4)3 composite produced by using the sol–gel method produces an excellent rate performance and shows a high cycle stability. Especially, MTP–CNT10 has a discharge capacity of 298.8 mA h g−1 258.3 mA h g−1 and 254.8 mA h g−1 at the rate of 0.1C, 0.5C and 1C, respectively. At 10C, the capacity retention rate is 92% after 300 cycles. Such excellent electrochemical performance is attributed to the carbon layer protecting MTP and the conductive network constructed by carbon nanotubes to improve the rate of electron transfer.Conflicts of interest
The authors declare that there is no conflict of interest regarding the publication of this paper.Acknowledgements
This work was supported by the Chinese National Natural Science Foundation (51904150), Basic Research Program of Guizhou Province ([2020]1Y225), Guizhou Province Ordinary Universities Scientific Talents Project (KY[2019]056), Liupanshui Science and Technology Plan Project (No. 52020-2022-PT-04), Liupanshui Normal University Scientific Research and Cultivation Projects (LPSSYLPY202119).References
- J. Liu, C. Hu, A. Kimber and Z. Wang, J. Energy Storage, 2020, 32, 101731 CrossRef.
- R. Georgious, R. Refaat, J. Garcia and A. A. Daoud, Electronics, 2021, 10, 2134 CrossRef CAS.
- M. H. Balali, N. Nouri, E. Omrani, A. Nasiri and W. Otieno, Int. J. Energy Res., 2017, 41, 1948–1962 CrossRef.
- G. Ping, L. Miao, A. Awati, X. Qian, T. Shi, Y. Lv, Y. Liu, L. Gan, M. Liu and D. Zhu, Chin. Chem. Lett., 2021, 32, 3811–3816 CrossRef CAS.
- H. Wang, C. Zhu, D. Chao, Q. Yan and H. J. Fan, Adv. Mater., 2017, 29, 1702093 CrossRef PubMed.
- Y. Liang, W. Lai, Z. Miao and S. Chou, Small, 2018, 14, 1702514 CrossRef PubMed.
- Y. Liu, X. Liu, T. Wang, L.-Z. Fan and L. Jiao, Sustain. Energy Fuels, 2017, 1, 986–1006 RSC.
- Z. Song, L. Miao, H. Duan, L. Ruhlmann, Y. Lv, D. Zhu, L. Li, L. Gan and M. Liu, Angew. Chem., Int. Ed., 2022, 61, e202208821 CAS.
- Y. Fang, X.-Y. Yu and X. W. (David) Lou, Matter, 2019, 1, 90–114 CrossRef.
- Z. Jian, Y. Hu, X. Ji and W. Chen, Adv. Mater., 2017, 29, 1601925 CrossRef.
- S. Chen, C. Wu, L. Shen, C. Zhu, Y. Huang, K. Xi, J. Maier and Y. Yu, Adv. Mater., 2017, 29, 1700431 CrossRef.
- M. Wu, W. Ni, J. Hu and J. Ma, Nano-Micro Lett., 2019, 11, 44 CrossRef CAS.
- S. Guo, J. Yi, Y. Sun and H. Zhou, Energy Environ. Sci., 2016, 9, 2978–3006 RSC.
- S. Barth, R. Olazcuaga, P. Gravereau, G. Le Flem and P. Hagenmuller, Mater. Lett., 1993, 16, 96–101 CrossRef CAS.
- C. Vidal-Abarca, J. M. Ateba Mba, C. Masquelier, J. L. Tirado and P. Lavela, J. Electrochem. Soc., 2012, 159, A1716–A1721 CrossRef CAS.
- H. Takahashi and H. Takamura, Mater. Trans., 2012, 53, 932–935 CrossRef CAS.
- Y. Qin, L. Miao, M. Mansuer, C. Hu, Y. Lv, L. Gan and M. Liu, ACS Appl. Mater. Interfaces, 2022, 14, 33328–33339 CrossRef.
- Z.-E. Yu, Y. Lyu, Z. Zou, N. Su, B. He, S. Wang, S. Shi and B. Guo, ACS Sustainable Chem. Eng., 2021, 9, 13414–13423 CrossRef CAS.
- L. G. Bulusheva, A. V. Okotrub, A. G. Kurenya, H. Zhang, H. Zhang, X. Chen and H. Song, Carbon, 2011, 49, 4013–4023 CrossRef CAS.
- W. Hou, Y. Xiao, G. Han and H. Zhou, Electrochim. Acta, 2016, 190, 720–728 CrossRef CAS.
- Z. Zhou, N. Li, C. Zhang, X. Chen, F. Xu and C. Peng, Solid State Ionics, 2018, 324, 87–91 CrossRef CAS.
- Y. Wen, K. He, Y. Zhu, F. Han, Y. Xu, I. Matsuda, Y. Ishii, J. Cumings and C. Wang, Nat. Commun., 2014, 5, 4033 CrossRef CAS PubMed.
- H. Yunwei, Y. Hua, W. Yuanxin, C. Chi, Y. Shi and A. Changchun, Electrochemistry, 2016, 84, 705–708 CrossRef CAS.
- X. Li, X. Zhu, J. Liang, Z. Hou, Y. Wang, N. Lin, Y. Zhu and Y. Qian, J. Electrochem. Soc., 2014, 161, A1181–A1187 CrossRef CAS.
- X. Li and L. Zhi, Chem. Soc. Rev., 2018, 47, 3189–3216 RSC.
- Z. Jiang, Y. Li, J. Zhu, B. Li, C. Li, L. Wang, W. Meng, Z. He and L. Dai, J. Alloys Compd., 2019, 791, 176–183 CrossRef CAS.
- F. Joucken, Y. Tison, P. Le Fèvre, A. Tejeda, A. Taleb-Ibrahimi, E. Conrad, V. Repain, C. Chacon, A. Bellec, Y. Girard, S. Rousset, J. Ghijsen, R. Sporken, H. Amara, F. Ducastelle and J. Lagoute, Sci. Rep., 2015, 5, 14564 CrossRef CAS PubMed.
- H. Zhang, M. Chhowalla and Z. Liu, Chem. Soc. Rev., 2018, 47, 3015–3017 RSC.
- S. Ye, Z. Li, T. Song, D. Cheng, Q. Xu, H. Liu and Y. Wang, RSC Adv., 2017, 7, 56743–56751 RSC.
- T. Xu, M. Zhao, Z. Su, W. Duan, Y. Shi, Z. Li, V. G. Pol and X. Song, J. Power Sources, 2021, 481, 229110 CrossRef CAS.
- Y. Jiang, J. Shi, M. Wang, L. Zeng, L. Gu and Y. Yu, ACS Appl. Mater. Interfaces, 2016, 8, 689–695 CrossRef CAS.
- Y. Zhao, Z. Wei, Q. Pang, Y. Wei, Y. Cai, Q. Fu, F. Du, A. Sarapulova, H. Ehrenberg, B. Liu and G. Chen, ACS Appl. Mater. Interfaces, 2017, 9, 4709–4718 CrossRef CAS.
- L. Fu, X. Xue, Y. Tang, D. Sun, H. Xie and H. Wang, Electrochim. Acta, 2018, 289, 21–28 CrossRef CAS.
- B. Zhao, Q. Wang, S. Zhang and C. Deng, J. Mater. Chem. A, 2015, 3, 12089–12096 RSC.
- L. Xu, G. Xu, Z. Chen, X. Wei, J. Cao and L. Yang, J. Mater. Sci.: Mater. Electron., 2018, 29, 9258–9267 CrossRef CAS.
- M. Bian and L. Tian, Ceram. Int., 2017, 43, 9543–9546 CrossRef CAS.
- Q. Hu, M. Yu, J. Liao, Z. Wen and C. Chen, J. Mater. Chem. A, 2018, 6, 2365–2370 RSC.
- X. Yang, K. Wang, X. Wang, G. Chang and S. Sun, Solid State Ionics, 2018, 314, 61–65 CrossRef CAS.
- J. Liang, K. Fan, Z. Wei, X. Gao, W. Song and J. Ma, Mater. Res. Bull., 2018, 99, 343–348 CrossRef CAS.
- Z. Wang, J. Liang, K. Fan, X. Liu, C. Wang and J. Ma, Front. Chem., 2018, 6, 396 CrossRef PubMed.
- Z. Jiang, L. Liu, Y. Li, J. Zhu, C. Li, Z. He, W. Meng, Y. Jiang, L. Dai and L. Wang, Solid State Ionics, 2018, 325, 189–195 CrossRef CAS.
- L. Yu, L. P. Wang, H. Liao, J. Wang, Z. Feng, O. Lev, J. S. C. Loo, M. T. Sougrati and Z. J. Xu, Small, 2018, 14, 1703338 CrossRef PubMed.
Footnote |
| † Electronic supplementary information (ESI) available. See DOI: https://doi.org/10.1039/d2ra06449a |
| This journal is © The Royal Society of Chemistry 2022 |

