 Open Access Article
Biomass-derived nano-laminated Ti3SiC2 MAX phase
Changwan Noua,
Byeong Geun Kim†
*b,
Soo-Young Sukb and
Soon-Mok Choi† *a
*a
aSchool of Energy Materials Chemical Engineering, Korea University of Technology and Education, Cheonan-si 31253, Korea. E-mail: smchoi@koreatech.ac.kr
bResearch Development Division, Gyeongbuk Institute of IT Convergence Industry Technology, Gyeongsan-si 38463, Korea. E-mail: bgkim305@gmail.com
First published on 14th November 2022
Abstract
Carbide-based MAX phases, titanium silicon carbide (Ti3SiC2), were synthesized with Ti, Si, and C elements using a sintering process. Eggshell membranes, which have been generally dumped as domestic wastes, were used as carbon sources in starting materials. After a sintering process at 1500 °C, Ti3SiC2 phases were mainly formed with a few secondary phases such as TiSi2 and TiCx. The formation and extinction of secondary phases were influenced by the quantities of Si contents in starting materials, which also affected the peak shifts of the Ti3SiC2 phase in X-ray diffraction spectra. The possible mechanism of this phenomenon was proposed, and the thermoelectric properties of products were also investigated.
Introduction
The ternary carbides and nitrides, so-called MAX phases, have received attention because of their unique properties.1–3 They consist of early transition metal (M), elements of 13–16 families (A), and the carbon and/or nitrogen (X): Mn+1AXn.1–3 MAX phases have both metallic (good machinability and thermal and electrical conductivities) and ceramic properties (good thermal resistance and chemical resistance). Therefore, they are utilized in various applications such as nuclear,4 energy,5 filters,6 and heating elements.1 Moreover, they can transform to two-dimensional early transition metal carbides and carbonitrides, called MXenes, using a selected etching process of ‘A’ elements.7–10 MXenes have the general formula of Mn+1XnTx (n = 1–3); M and Tx indicate the early transition metals and surface terminations, respectively.7–10 X represents carbon and/or nitrogen. MXenes are excellent candidates for applications in energy storage (ion batteries and supercapacitors etc.) and energy conversions (photovoltaic and thermoelectric devices etc.).7–10MAX phases are mostly prepared using a sintering process such as a conventional reactive process,11 hot-press,12,13 and spark plasma sintering (SPS)14 at high temperatures. In most processes, commercial carbon materials such as active carbon12 and graphite13 were used as carbon sources. Eggs have been most frequently consumed throughout the world. Hence, massive eggshell membranes are produced every day, which are thrown in the garbage. We think research about their recycling is meaningful in terms of the eco-environment. Recently, research on the transformation of biomass to functional inorganic materials has been reported.15–18 Thus, we selected eggshell membranes as carbon sources for synthesizing MAX phases (Ti3SiC2) in this study.
Experimental
Eggs were purchased from a nearby grocery store. Eggshell membranes were detached from eggs by soaking them in a hydrochloric acid (HCl, 9.9%) solution. After egg yolks and whites in eggs were removed, eggshell membranes were subjected to an ultra-sonication in ethanol (99.9%) solution for 30 min. They were sufficiently dried at 70 °C using an oven for 30 min.After thermal annealing at 900 °C with a tube furnace for 1 h under an argon (99.999%) gas atmosphere, they were lightly ground in an agate mortar and pestle by hand. Then, a planetary milling was performed for 1 h at 3000 rpm. As a result, a dark gray powder was obtained.
Ti (<45 μm, 99.98%), Si (325 mesh, 99%), and carbonized-eggshell membranes were in a molar ratio of 3![[thin space (1/6-em)]](https://www.rsc.org/images/entities/char_2009.gif) :
:![[thin space (1/6-em)]](https://www.rsc.org/images/entities/char_2009.gif) 1.2
1.2![[thin space (1/6-em)]](https://www.rsc.org/images/entities/char_2009.gif) :
:![[thin space (1/6-em)]](https://www.rsc.org/images/entities/char_2009.gif) 2, 3
2, 3![[thin space (1/6-em)]](https://www.rsc.org/images/entities/char_2009.gif) :
:![[thin space (1/6-em)]](https://www.rsc.org/images/entities/char_2009.gif) 1.4
1.4![[thin space (1/6-em)]](https://www.rsc.org/images/entities/char_2009.gif) :
:![[thin space (1/6-em)]](https://www.rsc.org/images/entities/char_2009.gif) 2, and 3
2, and 3![[thin space (1/6-em)]](https://www.rsc.org/images/entities/char_2009.gif) :
:![[thin space (1/6-em)]](https://www.rsc.org/images/entities/char_2009.gif) 1.6
1.6![[thin space (1/6-em)]](https://www.rsc.org/images/entities/char_2009.gif) :
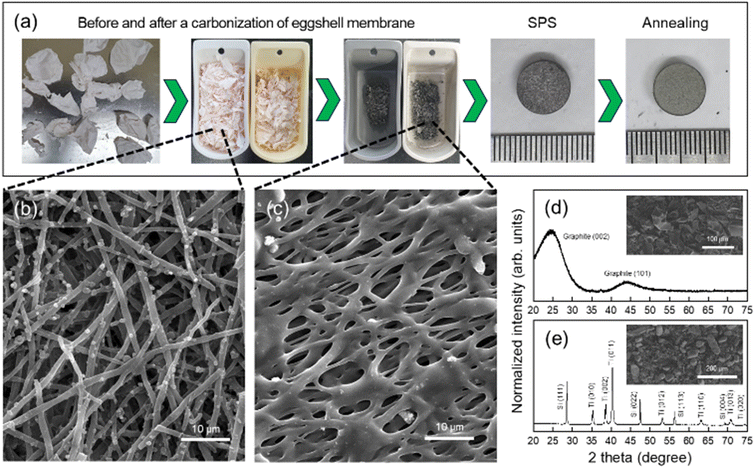
:![[thin space (1/6-em)]](https://www.rsc.org/images/entities/char_2009.gif) 2. They were named as TS1.2C, TS1.4C, and TS1.6C, respectively. The mixing process was performed with 8 zirconia balls in a zirconia jar at 300 rpm using a planetary ball mill. The mixed powder weighing 1 g was placed in a graphite mold (10 ⌀) and then was pressed to form pellets using spark plasma sintering (SPS) equipment. The working pressure, temperature, and duration time were 50 MPa, 900 °C, and 5 min, respectively. The fabricated pellets were thermally annealed at 1500 °C using a tube furnace for 4 h in an argon (99.999%) gas atmosphere. After the annealing process with a heating rate of 4 °C min−1, the furnace was slowly cooled to room temperature. The whole preparation process of the MAX phases is shown in Fig. 1(a).
2. They were named as TS1.2C, TS1.4C, and TS1.6C, respectively. The mixing process was performed with 8 zirconia balls in a zirconia jar at 300 rpm using a planetary ball mill. The mixed powder weighing 1 g was placed in a graphite mold (10 ⌀) and then was pressed to form pellets using spark plasma sintering (SPS) equipment. The working pressure, temperature, and duration time were 50 MPa, 900 °C, and 5 min, respectively. The fabricated pellets were thermally annealed at 1500 °C using a tube furnace for 4 h in an argon (99.999%) gas atmosphere. After the annealing process with a heating rate of 4 °C min−1, the furnace was slowly cooled to room temperature. The whole preparation process of the MAX phases is shown in Fig. 1(a).
The microstructural, morphological, and composition analyses of specimens were conducted using X-ray diffraction (XRD, Malvern Panalytical, UK) and two scanning electron microscopes (SEM, JEOL, Japan/EMCRAFTS, Korea) equipped with energy dispersive spectroscopy (EDS), respectively. The density of the products was measured using the Archimede's method. Their thermoelectric properties were determined by temperature differential and four-probe methods using commercial equipment (RZ2000li, Ozawa Science Co., Japan) in the temperature range from room temperature to about 590 °C under an Ar (99.999%) gas atmosphere.
As-exfoliated eggshell membranes have a net-liked shape, composed of many fibers with an average diameter of 1.36 μm (Fig. 1(b)). Several elements were found in the EDS mapping analyses: C (62.6 at%), N (19.6 at%), O (15.8 at%), and S (1.3 at%). When eggshell membranes were thermally treated at 900 °C, their weight was decreased to about 76%. The compositions also changed into C (88.6 at%), N (7.8 at%), and O (3.5 at%). In addition, the traces (less than 0.1 at%) such as Cl, S, and Ca were detected in all EDS analyses. These results were due to the thermal decomposition of organic components at high temperatures.
The carbonized eggshell membranes have broad XRD patterns (Fig. 1(d)), indicating that they were nearly amorphous or nano-crystalline. Fig. 1(e) shows the XRD pattern of the mixed-powders with Ti, Si, and carbonized eggshell membranes before the SPS process. All peaks were indexed with Si (ICSD no. 426975) and Ti (ICSD no. 192331) phases, not C-related crystalline peaks. The inner SEM images in Fig. 1(d) and (e) show the morphologies of as-carbonized eggshell membranes and mixed powders in each process.
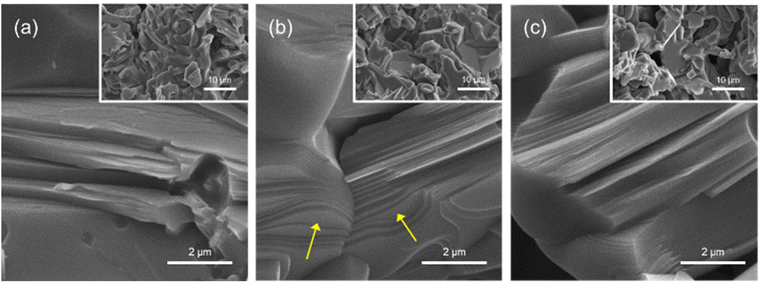
Fig. 2 shows low-(inner images) and high-magnification SEM images of TS1.2C, TS1.4C, and TS1.6C after thermal annealing. The unique laminated morphologies of MAX phases are clearly observed in all products. Moreover, the yellow arrow in Fig. 2(b) presents that step growth of Ti3SiC2 was carried out.19,20
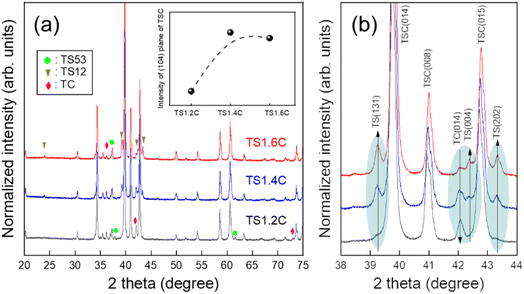
To further verify the formation of Ti3SiC2 phases, XRD analyses were performed (Fig. 3). The XRD patterns show that Ti3SiC2 phases were mainly formed with secondary phases such as TiSi2, Ti5Si3, and TiCx. The peaks were indexed with Ti3SiC2 (ICSD no. 25762), TiSi2 (ICSD no. 96029), Ti5Si3 (ICSD no. 652424), and Ti5.73C3.72 (TiCx, ICSD no. 18494). TSC, TS53, TS12, and TC in Fig. 3 indicate Ti3SiC2, Ti5Si3, TiSi2, and TiCx phases, respectively. From the results of XRD analyses, the possible reaction mechanism during the sintering process is described as follows:21
| Ti(s) + xC(s) → TiCx(s) | (1) |
| Ti(s) + ySi(s) → Ti–Sirich(l) | (2) |
| TiCx(s) + Ti–Sirich(l) → Ti3SiC2(s) + TiSi2(s) + Ti5Si3(s) + TiCx(s) | (3) |
According to the quantities of Si contents in the starting materials, the XRD patterns of secondary phases were slightly changed. When Si contents were increased, the intensities of TiSi2 and TiCx peaks were increased and decreased, respectively (Fig. 3(b)). It is known that excess Si is needed for the increase of the newly-formed Ti3SiC2 phase because the melted Si can partially be evaporated during the fabrication process at high temperatures.21 Inset of Fig. 3(a) presents the intensity variations of the main peak of the Ti3SiC2 phase at about 39°. When Si content is increased, it shows a tendency to increase the intensities of the products. This phenomenon was also found for the second peak (at about 42.7°) of the Ti3SiC2 phase. The reason may be that excess Si induces the formation of both Ti3SiC2 and Ti-based secondary phases, such as TiSi2.
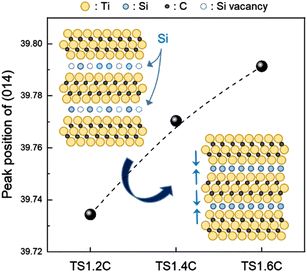
In addition, we found one interesting pattern in enlarged XRD peaks in Fig. 3(b). The peaks of the Ti3SiC2 phase were shifted to the higher position with the increase in Si contents (Fig. 4), while the peaks of secondary phases were not changed. This indicates that the lattice constants and the size of the unit cells were decreased. To the best of our knowledge, no research has been reported about this phenomenon in MAX phases. Generally, the shrinkage of unit cells occurs when small atoms are doped into their interstitial sites. The out-diffusion by a low melting point Si21 and the weak Ti–Si bonding in Ti3SiC2 (ref. 22) may create Si vacancies. Hence, the unit cell of Ti3SiC2 could decrease because excess Si atoms may occupy the site of Si vacancies (inset of Fig. 4).
The densities of the products are shown in Fig. 5(a), and that of TS1.6C was the highest; TS1.2C (4.134 g cm−3), TS1.4C (4.115 g cm−3), and TS1.6C (4.151 g cm−3). These values were lower than the theoretical value (4.50 g cm−3) of Ti3SiC2,13 while higher than those (3.792–3.836 g cm−3) of our previous reports obtained by an arc melting process.19 Fig. 5(b) shows the thermoelectric properties of TS1.2C, TS1.4C, and TS1.6C in the temperature range of ∼590 °C. The electrical conductivity of TS1.2C (1.564 × 10⁶/Ωm) was the lowest at room temperature, while those of TS1.4C (2.012 × 10⁶ Ω−1 m−1) and TS1.6C (1.995 × 10⁶ Ω−1 m−1) were similar. This result may be due to the different electrical resistivities of secondary phases such as TiC (70 μΩ cm)23 and TiSi2 (10 μΩ cm).24,25 As can be seen in Fig. 3, the XRD intensities of TiCx and TiSi2 phases gradually decreased and increased, respectively, with increasing Si contents. When TiSi2 phases with low resistivity compared with TiCx phases were formed, the electrical conductivities of the products were improved. When the temperature was increased, their electrical conductivities gradually decreased: TS1.2C (6.274 × 10⁵ Ω−1 m−1), TS1.4C (7.814 × 10⁵ Ω−1 m−1), and TS1.6C (7.532 × 10⁵ Ω−1 m−1) at 590 °C. This presents that the products have temperature-dependent behavior of metals. In general, a thermoelectric ZT value is used to present the performance of thermoelectric materials: ZT = α2Tσ/κ (α, Seebeck coefficient; T, absolute temperature; σ, electrical conductivity; κ, thermal conductivity). This equation shows that the electrical and thermal conductivities are inversely proportional to each other. The Seebeck coefficients of TS1.2C, TS1.4C, and TS1.6C are 6.422–10.981 μV K−1, 6.277–9.643 μV K−1, and 5.778–9.543 μV K−1, respectively (inset of Fig. 5(b)). These values are negative in the temperature range of ∼590 °C, which indicates that the products were n-type.
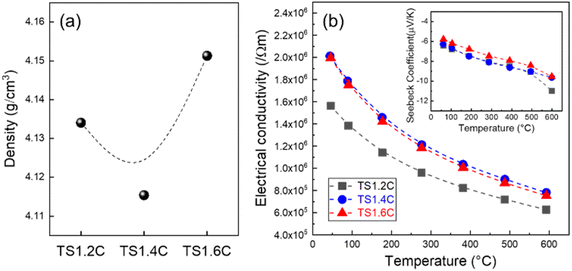 | ||
| Fig. 5 (a) The densities, (b) electrical conductivities, and Seebeck coefficients (inset) of TS1.2C, TS1.4C, and TS1.6C. | ||
Conclusions
Eggshell membranes with a net-like shape were used as carbon sources for fabricating the Ti3SiC2 phase. After thermal treatment at 900 °C, they were pulverized and mixed with Ti and Si powders. The mixed powders were condensed by an SPS process. Ti3SiC2 phases were successfully fabricated by thermal annealing using a tube furnace at 1500 °C. When Si contents were increased, TiSi2 and TiCx phases were formed and disappeared, respectively. The peak shift of Ti3SiC2 phases to a higher angle was observed in XRD analyses. The electrical conductivities of TS1.2C, TS1.4C, and TS1.6C were 1.564 × 10⁶ to 6.274 × 10⁵ Ω−1 m−1, 2.012 × 10⁶ to 7.814 × 10⁶ Ω−1 m−1, and 1.995 × 10⁶ to 7.532 × 10⁵ Ω−1 m−1, respectively. Their Seebeck coefficients were negative and inversely proportional to the electrical conductivities: TS1.2C (6.422–10.981 μV K−1), TS1.4C (6.277–9.643 μV K−1), and TS1.6C (5.778–9.543 μV K−1).Author contributions
C. Nou performed the fabrication and process of MAX phase and analyses of the products; B. G. Kim gave ideas for this study; B. G. Kim, S. Y. Suk, and S. M. Choi planned the experiment; B. G. Kim and S. M. Choi wrote the manuscript; All authors have given approval to the final version of the manuscript.Conflicts of interest
There are no conflicts of interest to declare.Acknowledgements
This research was supported by the Basic Science Research Program through the National Research Foundation of Korea (NRF), funded by the Ministry of Education (No. NRF-2018R1D1A1A02086218 and No. NRF-2022R1A2C1092054). This result was also supported by “Regional Innovation Strategy (RIS)” through the National Research Foundation of Korea, funded by the Ministry of Education (2021RIS-004). In addition, this research was supported by the Pioneer Research Center Program through the National Research Foundation of Korea, funded by the Ministry of Science, ICT & Future Planning (NRF2022M3C1A309198811). S.-M. Choi thanks the Cooperative Equipment Center at KOREATECH for assistance with SEM and XRD analysis.References
- M. Radovic and M. W. Barsoum, Am. Ceram. Soc. Bull., 2013, 92, 20–27 CAS.
- M. W. Barsoum and M. Radovic, Annu. Rev. Mater. Res., 2011, 41, 195–227 CrossRef CAS.
- M. W. Barsoum and T. El-Raghy, Am. Sci., 2001, 89, 334–343 CrossRef.
- B. Qiu, J. Wang, Y. Deng, M. Wang, Y. Wu and S. Z. Qiu, Nucl. Eng. Technol., 2020, 52, 1511–1520 CrossRef.
- J. Xu, M.-Q. Zhao, Y. Wang, W. Yao, C. Chen and B. Anasori, et al., ACS Energy Lett., 2016, 1, 1094–1099 CrossRef CAS.
- X. Liu, Q. Zhang, H. Zhang, Y. Jiang and Y. He, J. Mater. Sci., 2016, 51, 2594–2597 CrossRef CAS.
- Y. Gogotsi and B. Anasori, The rise of MXenes, ACS Nano, 2019, 13, 8491–8494 CrossRef CAS PubMed.
- B. Anasori, M. Lukatskaya and Y. Gogotsi, Nat. Rev. Mater., 2017, 2, 16098 CrossRef CAS.
- M. Naguib, V. N. Mochalin, M. W. Barsoum and Y. Gogotsi, Adv. Mater., 2014, 26, 992–1005 CrossRef CAS PubMed.
- J. Pang, R. G. Mendes, A. Bachmatiuk, L. Zhao, H. Q. Ta and T. Gemming, et al., Chem. Soc. Rev., 2019, 48, 72–133 RSC.
- F. Sato, J.-F. Li and R. Watanabe, Mater. Trans., JIM, 2000, 41, 605–608 CrossRef CAS.
- L. Yongming, P. Wei, L. Shuqin, C. Jian, W. Ruigang and L. Jianqiang, Mater. Lett., 2002, 52, 5245–5247 CrossRef.
- N. F. Gao and Y. Miyamoto, J. Mater. Sci., 1999, 34, 4385–4392 CrossRef CAS.
- N. F. Gao, J. T. Li, D. Zhang and Y. Miyamoto, J. Eur. Ceram., 2002, 22, 2365–2370 CrossRef CAS.
- J. Wang, P. Nie, B. Ding, S. Dong, X. Hao and H. Dou, et al., J. Mater. Chem. A, 2017, 5, 2411 RSC.
- J. Deng, M. Li and Y. Wang, Green Chem., 2016, 18, 4824 RSC.
- Z. Bi, Q. Kong, Y. Cao, G. Sun, F. Su and X. Wei, J. Mater. Chem. A, 2019, 7, 16028 RSC.
- X. Zhang, M. Jiang, N. Niu, Z. Chen, S. Li and S. Liu, et al., ChemSusChem, 2018, 11, 11–24 CrossRef PubMed.
- B. G. Kim, C. Nou, S. H. Bae and S.-M. Choi, Ceramurgia Int., 2021, 47, 17471–17475 CrossRef CAS.
- K. Buchholt, P. Eklund, J. Jensen, J. Lu, A. L. Spetz and L. Hultman, Scr. Mater., 2011, 64, 1141–1144 CrossRef CAS.
- H. Foratirad, H. Baharvandi and M. G. Maraghe, J. Eur. Ceram. Soc., 2017, 37, 451–457 CrossRef CAS.
- M. W. Barasoum, T. El-Raghy, C. J. Rawn, W. D. Porter, H. Wang, E. A. Payzant and C. R. Hubbard, J. Phys. Chem., 1999, 60, 429–439 Search PubMed.
- A. Z. A. Djafer, N. Saoula, N. Madaoui and A. Zerizer, Appl. Surf. Sci., 2014, 312, 57–62 CrossRef.
- S. P. Murarka, D. B. Fraser, A. K. Sinha and H. J. Levinstein, IEEE Trans. Electron Devices, 1980, 27, 1409 Search PubMed.
- J. Chen, J. P. Colinge, D. Flandre, R. Gillon, J. P. Raskin and D. Vanhoenacker, J. Electrochem. Soc., 1997, 144, 2437 CrossRef CAS.
Footnote |
| † These authors contributed equally to this work. |
| This journal is © The Royal Society of Chemistry 2022 |

