 Open Access Article
The development of activated carbon from corncob for CO2 capture
Xia Wang *a,
Wulan Zeng
 a,
Chunling Xin*a,
Xiangjun Konga,
Xiude Hub and
Qingjie Guob
aDepartment of Chemistry and Chemical Engineering, Weifang University, Weifang 261061, Shandong, China. E-mail: xiawangwfu@163.com; xinchunling0925@126.com
bState Key Laboratory of High-efficiency Utilization of Coal and Green Chemical Engineering, Ningxia University, Yinchuan 750021, China
First published on 18th November 2022
Abstract
The accumulation and incineration of crop waste pollutes the environment and releases a large amount of CO2. In this study, corncob crop waste was directly activated using solid KOH in an inert atmosphere to prepare porous activated carbon (AC) to capture CO2, and to introduce N-containing functional groups that favour CO2 adsorption, urea was mixed with corncob and KOH to prepare N-doped AC. The physical and chemical properties of the AC were characterized, and the effects of the mass ratio of KOH and urea to corncob, the activation temperature and time as well as regeneration were investigated to explore the optimal preparation process. The pores in the AC are mainly micropores, with the specific surface area and pore volume reaching 926.07 m2 g−1 and 0.40 cm3 g−1 for KOH-activated corncob and 1096.70 m2 g−1 and 0.48 cm3 g−1 after N-doping; the C–O plus O–H ratio and the –NH– ratio, which favour CO2 adsorption in N-doped AC were 6.04 and 1.92%, respectively. The maximum adsorption capacities for KOH-activated corncob before and after N-doping were 3.49 and 4.58 mmol g−1, respectively, at 20 °C and remained at 3.44 and 4.52 mmol g−1 after ten regenerations. The prepared corncob-based AC showed good application prospects for CO2 capture.
1. Introduction
As a responsible country, despite the great pressure from all aspects, China is still taking positive measures to capture CO2 to fulfill the double carbon target. Due to the characteristics of the energy structure and the dependence on coal, coal-fired power plants are undoubtedly one of the largest CO2 emission points, where the CO2 concentration is 9–15 vol%. Solid sorbents are acknowledged for their potential in capturing CO2,1–4 and many researchers have made a substantial contribution in this respect.5–26Quyang et al. synthesized SiO2 nanowires from fibrous sepiolite and impregnated these nanowires with different amines to prepare composite solid sorbents, in which the optimal adsorption capacity of tetraethylenepentamine (TEPA)-functionalized SiO2 was 3.7 mmol g−1 at 75 °C for 60 vol% CO2.5 Wang et al. impregnated branched polyethylenimine (PEI) onto commercial multiwalled carbon nanotubes and prepared composites to investigate the effect of H2O and O2 on CO2 capture, and the results showed that H2O had a positive effect, while O2 had a negative effect on CO2 adsorption.12 Chang et al. synthesized the zeolitic imidazolate framework (ZIF-8), in which MgO and ZnO were successfully confined; MgO-confined ZIF-8 showed fast chemisorption kinetics at room temperature, while ZnO-confined ZIF-8 showed physisorption characteristics.23 The above sorbents all showed good CO2 adsorption performance, but the expensive supporting materials, active components or complex preparation process caused high CO2 capture costs, and the development of low-cost CO2 sorbents is an effective way to reduce CO2 capture costs.27–37 Rehman et al. explored nitrogen-containing porous carbons derived from chitosan by a carbonization combining activation process. This material showed a rich microporous structure and N-containing functional groups, and the maximum adsorption capacity reached 6.36 mmol g−1 at 273 K for 100 vol% CO2.26 Wang et al.29 prepared porous lignite chars from low rank Ordos coal by the activation method, and the CO2 adsorption capacity was 1.35 mmol g−1 at 20 °C for 15 vol% CO2.28 Biomass is also used as the raw material to prepare porous carbons as sorbents.38–41 Ding et al. prepared seaweed-based porous carbons from sargassum and enteromorpha by a one-step KOH activation method, in which the specific surface area and pore volume separately reached 291.8 m2 g−1 and 0.24 cm3 g−1, and the maximum CO2 adsorption capacity was 1.05 mmol g−1 at 25 °C (12% CO2).38 Pramanik et al. developed the cotton stalk-based porous carbon with the specific surface area of 2695 m2 g−1, and the adsorption capacity of 4.24 mmol g−1 at 298 K (100% CO2) was achieved.40
China is a large agricultural country, and every year, millions of crop wastes are stacked or burned, which not only induces serious environmental pollution problems but also releases large amounts of CO2 and increases the greenhouse gas effect. In this study, corncob, which is common in Shandong Province, China, was used as the raw material, KOH and urea were used as the activator and nitrogen source, respectively, to prepare the AC by a one-step activation method. The pore structure, surface functional groups and morphology of the AC were characterized. The CO2 adsorption capacities at different KOH or urea to corncob mass ratios, activation temperatures and times, and adsorption temperatures were investigated, and the correlations between adsorption performance and pore properties and functional groups were analysed.
2. Experimental section
2.1 Materials
Corncob was collected from rural Weifang city, Shandong Province, China. KOH (GR, 85%) and urea (AR, 99%) were purchased from Shanghai Aladdin Biochemical Technology Co., Ltd, Shanghai, China. HCl (CR, 36–38%) was purchased from Laiyang Fine Chemical Factory, Shandong Province, China. N2 and CO2 with a purity of 99.999% and a mixed gas of 85 vol% N2/15 vol% CO2 were provided by Weiyang Gas Co., Ltd, Shandong Province, China.2.2 Preparation of the corncob-based AC
Corncob was washed with running water and deionized water, dried in an oven at 80 °C, and then crushed into powder below 100 meshes for use. KOH and urea were also pulverized to a powder for use. The AC was prepared with a simple one-step activation method.Corncob and KOH were separately weighed according to a certain mass ratio and uniformly mixed. The mixture was tiled in a tube furnace, and N2 was passed through for 30 minutes to remove the adsorbed air. Then, the temperature of the tube furnace was elevated at a rate of 5 °C min−1 to the activation temperature and remained at this temperature for a certain time, which is the activation time. Subsequently, the system was cooled to 100 °C, and N2 was discontinued. The black powder collected from the tube furnace was ground, was washed repeatedly with diluted HCl and deionized water until the pH was close to 7, and was then dried in a vacuum oven at 85 °C for 24 h. The dried black powder was the AC, which were named CKa-T(b), where C represents corncob; K represents KOH; T is the activation temperature, °C; a is the KOH to corncob mass ratio; and b is the activation time, h.
The N-doped AC was also prepared with the one-step method. Corncob, KOH and urea were separately weighed according to a certain mass ratio and uniformly mixed, and then the above process was repeated. What is different is that the temperature was first raised to 450 °C for 0.5 h and then to the activation temperature, and the N-doped AC was named CNcKa-T(b), where N represents urea, and c is the mass ratio of urea to corncob.
2.3 Characterization
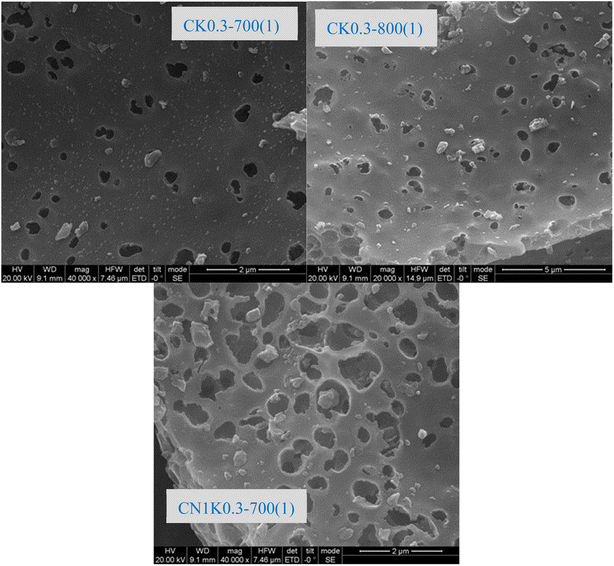
The N2 adsorption–desorption isotherms for corncob-based AC were collected on an ASAP 2460 (Micromeritics, USA) by the physical adsorption of N2 at the critical temperature of 77 K. The BET surface area (SBET) was obtained according to the Brunauer–Emmett–Teller (BET) equation, the total pore volume (Vt) was calculated according to the adsorption capacity of N2 when the relative pressure (P/P0) reached 0.995, the micropore volume (Vmicro) was confirmed from the t-plot curve, and the pore size distribution curves were obtained from the desorption branch according to the density functional theory (DFT) method.The X-ray photoelectron spectroscopy (XPS) was applied to the corncob-based AC using an EscaLab 250Xi (Thermo Scientific, USA). The surface morphology was collected from a JSM-7500F scanning electron microscope (JEOL, Japan).
2.4 CO2 adsorption and regeneration
The adsorption and regeneration of the prepared AC were performed on an online fixed bed adsorption device. A total of 0.4 g of the sample was fixed in the centre of the quartz tube, in which the inner diameter was 0.8 cm and length was 50 cm, and N2 was passed through while the temperature was raised to 100 °C and held for 60 min to drive away preadsorbed air. Then, the temperature was reduced to the desired adsorption temperature, and inlet N2 was converted to the mixed gas. Here, the CO2 adsorption process began, and C0 and C, which were recorded from the online gas chromatograph, represent the CO2 concentration in the inlet and outlet of the reactor, respectively. As adsorption proceeded, the CO2 concentration in the outlet continuously increased, and when C equaled C0, the adsorption process was completed, and the sorbent reached a saturated adsorption state; here, the CO2 adsorption capacity was the saturated adsorption capacity. The inlet was then converted to N2, and the temperature was raised to 100 °C to desorb the adsorbed CO2. As desorption proceeded, C continuously decreased; when C equaled 0, the desorption process finished, and the sorbent was regenerated. Ten adsorption–desorption regenerations were performed on the chosen samples.3. Results and discussion
3.1 Characterization
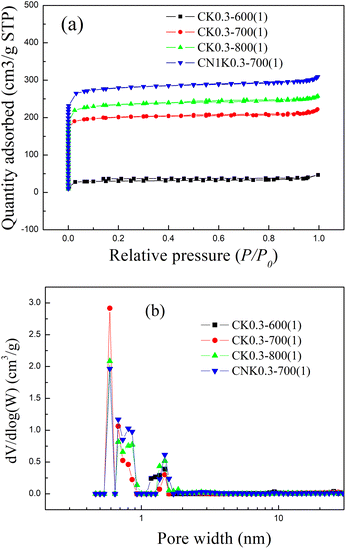 | ||
| Fig. 1 The (a) N2 adsorption–desorption isotherms and (b) pore size distribution curves for KOH-activated corncob before and after N-doping. | ||
| Sample | St (m2 g−1) | Smicro (m2 g−1) | Vt (cm3 g−1) | Vmicro (cm3 g−1) | Micro-porosity (%) | Average pore diameter (nm) |
|---|---|---|---|---|---|---|
| CK0.3-600(1) | 120.72 | 108.34 | 0.07 | 0.04 | 57.14 | 2.38 |
| CK0.3-700(1) | 796.96 | 763.36 | 0.34 | 0.30 | 88.24 | 1.73 |
| CK0.3-800(1) | 926.07 | 872.08 | 0.40 | 0.34 | 85.00 | 1.72 |
| CN1K0.3-700(1) | 1096.70 | 1032.29 | 0.48 | 0.40 | 83.33 | 1.74 |
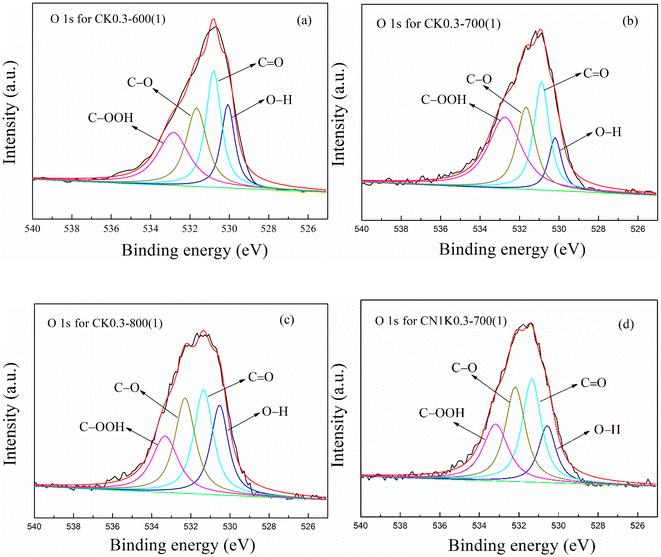
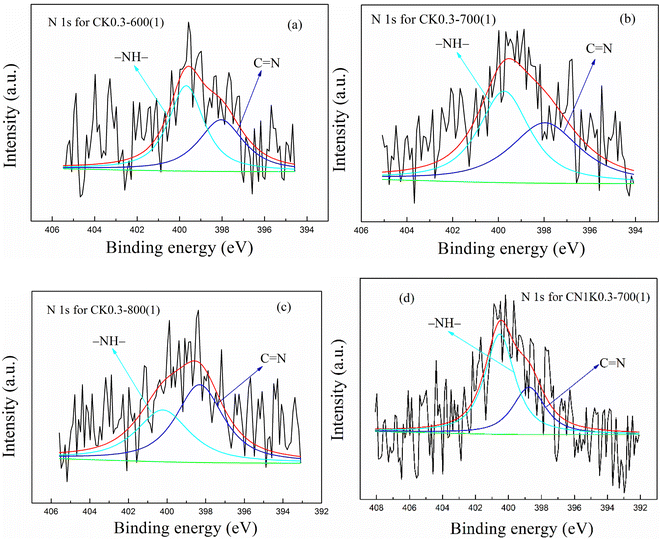
![[double bond, length as m-dash]](https://www.rsc.org/images/entities/char_e001.gif) O), ether or alcohol group (C–O) and carboxyl group (–COOH), respectively.38,42,43 The N 1S spectra in KOH-activated corncob before and after N-doping were all divided into two peaks at 398.31 and 400.21 eV, which are attributed to pyridinic nitrogen (C
O), ether or alcohol group (C–O) and carboxyl group (–COOH), respectively.38,42,43 The N 1S spectra in KOH-activated corncob before and after N-doping were all divided into two peaks at 398.31 and 400.21 eV, which are attributed to pyridinic nitrogen (C![[double bond, length as m-dash]](https://www.rsc.org/images/entities/char_e001.gif) N) and pyrrolic nitrogen (–NH), respectively.37,38,42 Generally, –OH, C–O and –NH promote CO2 adsorption,42 which is further discussed.
N) and pyrrolic nitrogen (–NH), respectively.37,38,42 Generally, –OH, C–O and –NH promote CO2 adsorption,42 which is further discussed.
| Sample | O (%) | O (%) | –OH (%) | –C![[double bond, length as m-dash]](https://www.rsc.org/images/entities/char_e001.gif) O (%) O (%) |
C–O (%) | –COOH (%) | |||
|---|---|---|---|---|---|---|---|---|---|
| –OH | –C![[double bond, length as m-dash]](https://www.rsc.org/images/entities/char_e001.gif) O O |
C–O | –COOH | ||||||
| a 1, 2, 3 and 4 represents CK0.3-600(1), CK0.3-700(1), CK0.3-800(1) and CN1K0.3-700(1), respectively. | |||||||||
| 1 | 27.26 | 18.20 | 28.83 | 26.06 | 26.90 | 4.96 | 7.86 | 7.10 | 7.33 |
| 2 | 21.55 | 11.04 | 26.65 | 24.08 | 38.23 | 2.38 | 5.74 | 5.19 | 8.24 |
| 3 | 20.43 | 22.67 | 28.52 | 21.05 | 27.76 | 4.63 | 5.83 | 4.30 | 5.67 |
| 4 | 13.12 | 15.95 | 31.16 | 30.11 | 22.79 | 2.09 | 4.09 | 3.95 | 2.99 |
As shown in Table 2, for KOH-activated corncob, as the activation temperature increased from 600 to 800 °C, the peak area ratio for –NH decreased from 1.62 to 0.86%, that for C–O decreased from 7.10 to 4.30%, that for –OH first decreased from 4.96 to 2.38 and then increased to 4.63%, and that for –OH plus C–O first decreased from 12.07 to 7.57 and then increased to 8.93% (Table 3).
| Sample | N (%) | N (%) | C![[double bond, length as m-dash]](https://www.rsc.org/images/entities/char_e001.gif) N (%) N (%) |
–NH– (%) | |
|---|---|---|---|---|---|
C![[double bond, length as m-dash]](https://www.rsc.org/images/entities/char_e001.gif) N N |
–NH– | ||||
| a 1, 2, 3 and 4 represents CK0.3-600(1), CK0.3-700(1), CK0.3-800(1) and CN1K0.3-700(1), respectively. | |||||
| 1 | 2.86 | 43.53 | 56.47 | 1.24 | 1.62 |
| 2 | 2.97 | 47.84 | 52.16 | 1.42 | 1.55 |
| 3 | 2.00 | 57.23 | 42.77 | 1.14 | 0.86 |
| 4 | 2.89 | 33.71 | 66.29 | 0.97 | 1.92 |
After N-doping, the ratio for –OH, C–O, –OH plus C–O, and –NH in CN1K0.3-700(1) was 2.09, 3.95, 6.04 and 1.92%, respectively, which all obviously increased compared with the corresponding value for CK0.3-700(1), suggesting that N-doping increased the functional groups that promote CO2 adsorption.
3.2 The CO2 adsorption performance of KOH-activated corncob
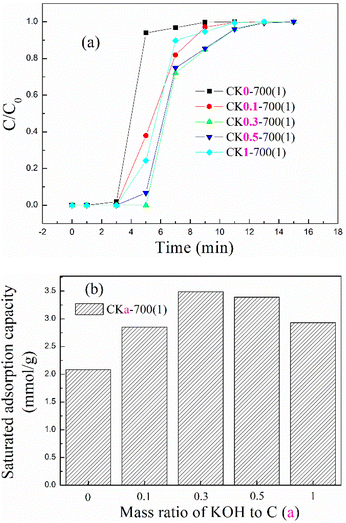 | ||
| Fig. 5 The (a) breakthrough adsorption curves and (b) saturated adsorption capacity for KOH-activated corncob at different KOH to corncob mass ratios. | ||
With the mass ratio increasing from 0 to 1, the breakthrough adsorption curve first moved towards the right and then left, so the saturated adsorption capacity first increased and then decreased, and the optimal adsorption capacity of 3.49 mmol g−1 appeared when the mass ratio was 0.3. More KOH promoted more corncob to be pyrolysed and to react, so more developed pores were formed, but too much KOH overreacted the corncob, etched the formed pores and collapsed the formed framework,29,38 so the adsorption capacity displayed an increasing trend first and then a decreasing trend.
In view of the optimal adsorption capacity appearing at a mass ratio of 0.3, the mass ratio was fixed at 0.3 in the following investigation.
The breakthrough adsorption curves and saturated adsorption capacity for KOH-activated corncob at different activation temperatures are shown in Fig. 6(a) and (b), respectively. As the activation temperature increased from 600 to 800 °C, the breakthrough curve in Fig. 6(a) first moved right and then moved left, and the corresponding saturated adsorption capacity first increased and then decreased, as shown in Fig. 6(b), with the optimal adsorption capacity appearing at 700 °C and being 3.49 mmol g−1 for CK0.3-700(1).
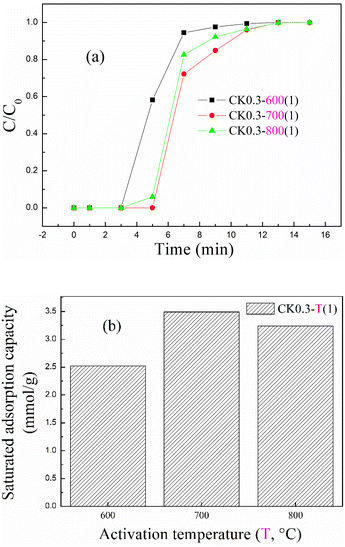 | ||
| Fig. 6 The (a) breakthrough adsorption curves and (b) saturated adsorption capacity for KOH-activated corncob at different activation temperatures. | ||
The mass ratio and activation temperature were fixed at 0.3 and 700 °C, respectively, to investigate the effect of activation time on CO2 adsorption at 20 °C. The breakthrough adsorption curves and saturated adsorption capacity for KOH-activated corncob at different activation times are shown in Fig. 7(a) and (b), respectively. The adsorption performance also showed an increasing and then decreasing trend, and the best value appeared when the activation time was 1 h.
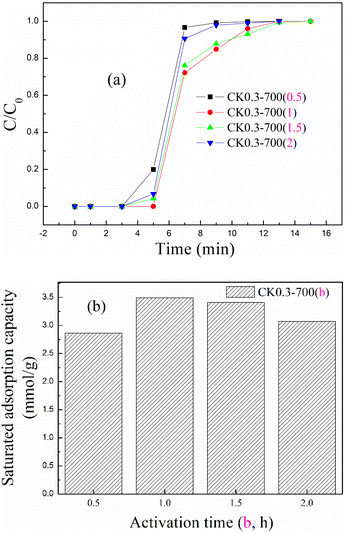 | ||
| Fig. 7 The (a) breakthrough adsorption curves and (b) saturated adsorption capacity for KOH-activated corncob at different activation times. | ||
Generally, a higher activation temperature and a longer activation time promote a more adequate reaction between KOH and corncob, so the pore structure and surface functional groups became more developed; however, too high a temperature and too long a time also caused an overreaction between KOH and corncob, which might cause pore framework collapse or favour further decomposition of functional groups.29,38 Therefore, the adsorption performance for KOH-activated corncob first showed increasing trends and then decreasing trend, and the optimal temperature and time were determined to be 700 °C and 1 h, respectively.
According to the above study, CK0.3-700(1) suggested an optimal adsorption capacity of 3.49 mmol g−1 at 20 °C when the mass ratio of KOH to corncob was 0.3, and the activation temperature and time were 700 °C and 1 h, respectively.
3.3 The effect of N-doping on CO2 adsorption of CK0.3-700(1)
Urea was mixed with KOH and corncob to introduce more N-containing functional groups to improve CO2 adsorption. The breakthrough adsorption curves and saturated adsorption capacity for N-doped CK0.3-700(1) at different mass ratios of urea to corncob are shown in Fig. 8(a) and (b). After N-doping, the breakthrough adsorption curve in Fig. 8(a) moved right, suggesting that N-doping improved the adsorption performance of KOH-activated corncob, as shown in Fig. 8(b). After N-doping at mass ratios of 0.5, 1 and 1.5, the saturated adsorption capacity was 4.24, 4.58 and 4.26 mmol g−1, representing increasing of 21.8, 31.4 and 22.2%, respectively, compared with CK0.3-700(1). According to the BET and XPS characterization results comparing CN1K0.3-700(1) and CK0.3-700(1), not only the specific surface area and pore volume but also the ratio of –OH, C–O, and –NH groups that favoured CO2 adsorption42 all increased, which improved CO2 adsorption.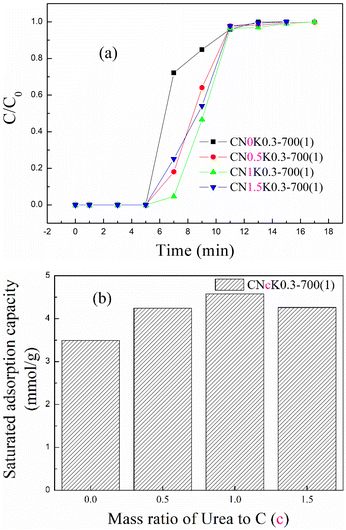 | ||
| Fig. 8 The (a) breakthrough adsorption curves and (b) saturated adsorption capacity for N-doped CK0.3-700(1). | ||
3.4 Linear correlation analysis
Linear correlation fitting was conducted on the corncob-based AC data, and the fitting results between the saturated adsorption capacity and SBET, Vt, Vmicro, the N–H group ratio and the O–H plus C–O group ratio are shown in Fig. 9(a–e), respectively. As suggested in Fig. 9, the saturated adsorption capacity did not fit well with any of the above factors, suggesting that the adsorption performance of the corncob-based AC did not completely rely on the pore properties or the surface functional groups but had close relations with both, which could explain why the saturated adsorption capacity did not continuously increase as the activation temperature or time increased.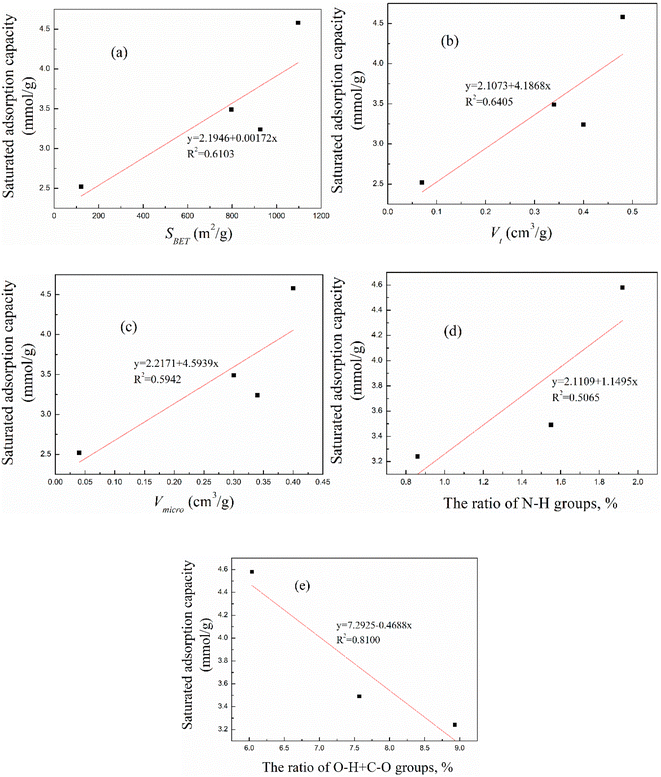 | ||
| Fig. 9 The linear correlation analysis between the adsorption performance and (a) SBET, (b) Vt, (c) Vmicro, (d) the N–H group ratio and (e) the O–H plus C–O ratio. | ||
In summary, the optimal preparation process for KOH-activated corncob appeared when the KOH to corncob mass ratio was 0.3, the activation temperature and time were 700 °C and 1 h, respectively, and the optimal urea to corncob mass ratio was 1 for N-doped KOH-activated corncob.
3.5 Regeneration of KOH-activated corncob before and after N-doping
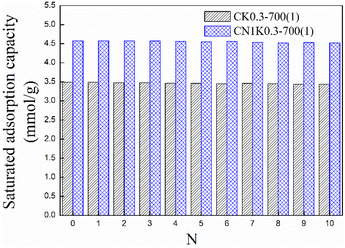
In view of the good adsorption performance, CK0.3-700(1) and CN1K0.3-700(1) were selected to further investigate ten adsorption–desorption regeneration performances. The adsorption and regeneration temperatures were separately set as 20 and 100 °C.The saturated adsorption capacity for corncob-based AC is shown in Fig. 10. For both CK0.3-700(1) and CN1K0.3-700(1), after ten regenerations, the adsorption capacity all showed an insignificant drop, and the values for both were 3.44 and 4.52 mmol g−1, which are reductions of only 1.43 and 1.31% compared with the corresponding values of the fresh sorbent, which were 3.49 and 4.58 mmol g−1, respectively. Both CK0.3-700(1) and CN1K0.3-700(1) showed good regeneration performance, and the prepared corncob-based AC has potential for CO2 capture.
4. Conclusions
A simple one-step activation method for the preparation corncob-based AC before and after N-doping suggested the development of a microporous structure and abundant O- and N-containing surface functional groups, which promote CO2 adsorption. The CO2 adsorption capacity for KOH-activated AC before and after N-doping reached 3.49 and 4.58 mmol g−1, respectively, and remained at 3.44 and 4.52 mmol g−1 after ten regenerations. In addition, the linear correlation results showed that the adsorption was related to both the pore structure and the functional groups and was not dependent on either.The development of corncob-based AC not only reduces the environmental pollution problem caused by the accumulation and incineration of crop waste and realizes waste resource utilization but also reduces the CO2 capture costs.
Conflicts of interest
There are no conflicts to declare.Acknowledgements
The financial support from the National Natural Science Foundation of China (Grant No. 22108208), the State Key Laboratory of High-efficiency Utilization of Coal and Green Chemical Engineering (Grant No. 2021-K02), and Weifang Science and Technology Development Plan (Grant No. 2021GX004) is gratefully acknowledged.References
- M. E. Boot-Handford, J. C. Abanades, E. J. Anthony, M. J. Blunt, S. Brandani, N. Mac Dowell, J. R. Fernandez, M.-C. Ferrari, R. Gross and J. P. Hallett, et al., Carbon capture and storage update, Energy Environ. Sci., 2014, 7(1), 130–189 RSC.
- M. Sevilla and A. B. Fuertes, Sustainable porous carbons with a superior performance for CO2 capture, Energy Environ. Sci., 2011, 4, 1765–1771 RSC.
- M. Bui, C. S. Adjiman, A. Bardow, E. J. Anthony, A. Boston and S. Brown, et al., Carbon capture and storage (CCS): the way forward, Energy Environ. Sci., 2018, 11, 1062–1176 RSC.
- A. S. Bhown and B. C. Freeman, Analysis and status of post combustion carbon dioxide capture technologies, Environ. Sci. Technol., 2011, 45(20), 8624–8632 CrossRef CAS PubMed.
- J. Quyang, C. Zheng, W. Gu, Y. Zhang, H. Yang and S. L. Suib, Textural properties determined CO2 capture of tetraethylenepentamine loaded SiO2 nanowires from α-sepiolite, Chem. Eng. J., 2018, 337, 342–350 CrossRef.
- J. D. Martell, P. J. Milner, R. L. Siegelman and J. R. Long, Kinetics of cooperative CO2 adsorption in diamine-appended variants of the metal-organic framework Mg2(dobpdc), Chem. Sci., 2020, 11, 6457–6471 RSC.
- L. Mafra, T. Čendak, S. Schneider, P. V. Wiper, J. Pires, J. R. B. Gomes and M. L. Pinto, Amine functionalized porous silica for CO2/CH4 separation by adsorption: which amine and why, Chem. Eng. J., 2018, 336, 612–621 CrossRef CAS.
- S. M. Rafigh and A. Heydarinasab, Mesoporous chitosan-SiO2 nanoparticles: synthesis, characterization, and CO2 adsorption capacity, ACS Sustainable Chem. Eng., 2017, 5, 10379–10386 CrossRef CAS.
- J. Yu, Y. Wu and P. B. Balbuena, Response of metal sites toward water effects on post combustion CO2 capture in metal-organic frameworks, ACS Sustainable Chem. Eng., 2016, 4, 2387–2394 CrossRef CAS.
- Y. Yang, C. Y. Chuah and T.-H. Bae, Polyamine-appended porous organic polymers for efficient post-combustion CO2 capture, Chem. Eng. J., 2019, 358, 1227–1234 CrossRef CAS.
- M. Smyrnioti, C. Tampaxis, T. Steriotis and T. Ioannides, Study of CO2 adsorption on a commercial CuO/ZnO/Al2O3 catalyst, Catal. Today, 2020, 357, 495–502 CrossRef CAS.
- Y. Wang, X. Hu, T. Guo, W. Tian, J. Hao and Q. Guo, The competitive adsorption mechanism of CO2, H2O and O2 on a solid amine adsorbent, Chem. Eng. J., 2021, 416, 129007–129017 CrossRef CAS.
- M. A. O. Lourenço, M. Fontana, P. Jagdale, C. F. Pirri and S. Bocchini, Improved CO2 adsorption properties through amine functionalization of multi-walled carbon nanotubes, Chem. Eng. J., 2021, 414, 128763–128775 CrossRef.
- F. Liu, W. Fu and S. Chen, Synthesis, CO2 characterization and adsorption performance of a thermosensitive solid amine adsorbent, J. CO2 Util., 2019, 31, 98–105 CrossRef CAS.
- X. Wang, W. Zeng, M. Song, F. Wang, X. Hu, Q. Guo and Y. Liu, Polyetheramine improves the CO2 adsorption behavior of tetraethylenepentamine-functionalized sorbents, Chem. Eng. J., 2019, 364, 475–484 CrossRef CAS.
- Y. Liu and J. Hou, Selective adsorption of CO2/CH4 mixture on clay-rich shale using molecular simulations, J. CO2 Util., 2020, 39, 101143–101152 CrossRef CAS.
- G. N. Muriithi, L. F. Petrik and F. J. Doucet, Synthesis, characterization and CO2 adsorption potential of NaA and NaX zeolites and hydrotalcite obtained from the same coal fly ash, J. CO2 Util., 2020, 36, 220–230 CrossRef CAS.
- J. Chang, C. Hou, D. Wan, X. Zhang, B. Xu, H. Tian, X. Wang and Q. Guo, Enhanced CO2 adsorption capacity of bi-amine co-tethered flue gas desulfurization gypsum with water of hydration, J. CO2 Util., 2020, 35, 115–125 CrossRef CAS.
- A. Rehman and S.-J. Park, Environmental remediation by microporous carbon: an efficient contender for CO2 and methylene blue adsorption, J. CO2 Util., 2019, 34, 656–667 CrossRef CAS.
- Y. Kuwahara, A. Hanaki and H. Yamashita, A direct conversion of blast furnace slag to a mesoporous silica-calcium oxide composite and its application in CO2 captures, Green Chem., 2020, 22, 3759–3768 RSC.
- G. Tuci, A. Iemhoff, A. Rossin, D. Yakhvarov, M. F. Gatto, R. Balderas-Xicohténcatl, L. Zhang, M. Hirscher, R. Palkovits, C. Pham-Huu and G. Giambastiani, Tailoring morphological and chemical properties of covalent triazine frameworks for dual CO2 and H2 adsorption, Int. J. Hydrogen Energy, 2022, 47, 8434–8445 CrossRef CAS.
- C. H. Lee, S. W. Choi, H. J. Yoon, H. J. Kwon, H. C. Lee, S. G. Jeon and K. B. Lee, Na2CO3-doped CaO-based high-temperature CO2 sorbent and its sorption kinetics, Chem. Eng. J., 2018, 352, 103–109 CrossRef CAS.
- C.-W. Chang, Y.-H. Kao, P.-H. Shen, P.-C. Kang and C.-Y. Wang, Nanoconfinement of metal oxide MgO and ZnO in zeolitic imidazolate framework ZIF-8 for CO2 adsorption and regeneration, J. Hazard. Mater., 2020, 400, 122974–122986 CrossRef PubMed.
- W.-T. Zhen, K. Huang and S. Dai, Solvothermal and template-free synthesis of N-functionalized mesoporous polymer for amine impregnation and CO2 adsorption, Microporous Mesoporous Mater., 2019, 290, 109653–109659 CrossRef.
- A. Jayakumar, A. Gomez and N. Mahinpey, Post-combustion CO2 capture using solid K2CO3: discovering the carbonation reaction mechanism, Appl. Energy, 2016, 179, 531–543 CrossRef CAS.
- A. Rehman, Y.-J. Heo, G. Nazir and S.-J. Park, Solvent-free, one-pot synthesis of nitrogen-tailored alkali-activated microporous carbons with an efficient CO2 adsorption, Carbon, 2021, 172, 71–82 CrossRef CAS.
- A. Rehman and S.-J. Park, From chitosan to urea-modified carbons: tailoring the ultra-microporosity for enhanced CO2 adsorption, Carbon, 2020, 159, 625–637 CrossRef CAS.
- T. F. Aquino, S. T. Estevam, V. O. Viola, C. R. M. Marques, F. L. Zancan, L. B. Vasconcelos, H. G. Riella, M. J. R. Pires, R. Morales-Ospino, A. E. B. Torres, M. Bastos-Neto and C. L. Cavalcante Jr, CO2 adsorption capacity of zeolites synthesized from coal fly ashes, Fuel, 2020, 276, 118143–118152 CrossRef CAS.
- X. Wang, W. Zeng, W. Liu, X. Cao, C. Hou, Q. Ding and Y. Lu, CO2 adsorption of lignite chars after one-step activation, New J. Chem., 2020, 44, 13755–13763 RSC.
- M. G. Plaza, C. Pevida, B. Arias, J. Fermoso, M. D. Casal, C. F. Martín, F. Rubiera and J. J. Pis, Development of low-cost biomass-based adsorbents for post combustion CO2 capture, Fuel, 2009, 88, 2442–2447 CrossRef CAS.
- H. Yi, F. Li, P. Ning, X. Tang, J. Peng, Y. Li and H. Deng, Adsorption separation of CO2, CH4, and N2 on microwave activated carbon, Chem. Eng. J., 2013, 215–216, 635–642 CrossRef CAS.
- A. Arami-Niya, T. E. Rufford and Z. Zhu, Activated carbon monoliths with hierarchical pore structure from tar pitch and coal powder for the adsorption of CO2, CH4 and N2, Carbon, 2016, 103, 115–124 CrossRef CAS.
- J. Chen, J. Yang, G. Hu, X. Hu, Z. Li, S. Shen, M. Radosz and M. Fan, Enhanced CO2 capture capacity of nitrogen-doped biomass-derived porous carbons, ACS Sustainable Chem. Eng., 2016, 4, 1439–1445 CrossRef CAS.
- D. P. Vargas, M. Balsamo, L. Giraldo, A. Erto, A. Lancia and J. C. Moreno-Pirajań, Equilibrium and dynamic CO2 adsorption on activated carbon honeycomb monoliths, Ind. Eng. Chem. Res., 2016, 55, 7898–7905 CrossRef CAS.
- J. Wang and S. Kaskel, KOH activation of carbon-based materials for energy storage, J. Mater. Chem., 2012, 22, 23710–23725 RSC.
- M. Meng, Z. Qiu, R. Zhong, Z. Liu, Y. Liu and P. Chen, Adsorption characteristics of supercritical CO2/CH4 on different types of coal and a machine learning approach, Chem. Eng. J., 2019, 368, 847–864 CrossRef CAS.
- Z. Ma, Z. Yang, H. Zhang and Z. Liu, Nitrogen-doped microporous carbon materials with uniform pore diameters: design and applications in CO2 and H2 adsorption, Microporous Mesoporous Mater., 2020, 296, 109992–109998 CrossRef CAS.
- S. Ding and Y. Liu, Adsorption of CO2 from flue gas by novel seaweed-based KOH-activated porous biochars, Fuel, 2020, 260, 116382–116391 CrossRef CAS.
- A. Sarwar, M. Ali, A. H. Khoja, A. Nawar, A. Waqas, R. Liaquat, S. R. Naqvi and M. Asjid, Synthesis and characterization of biomass-derived surface-modified activated carbon for enhanced CO2 adsorption, J. CO2 Util., 2021, 46, 101476–101489 CrossRef CAS.
- P. Pramanik, H. Patel, S. Charola, S. Neogi and S. Maiti, High surface area porous carbon from cotton stalk agro-residue for CO2 adsorption and study of techno-economic viability of commercial production, J. CO2 Util., 2021, 45, 101450–101461 CrossRef CAS.
- G. Huang, Y. Liu, X. Wu and J. Cai, Activated carbons prepared by the KOH activation of a hydrochar from garlic peel and their CO2 adsorption performance, New Carbon Mater., 2019, 34, 247–257 CrossRef CAS.
- Y. Xu, Z. Yang, G. Zhang and P. Zhao, Excellent CO2 adsorption performance of nitrogen-doped waste biocarbon prepared with different activators, J. Cleaner Prod., 2020, 264, 121645–121654 CrossRef CAS.
- L. Zhang, S. Tang, F. He, Y. Liu, W. Mao and Y. Guan, Highly efficient and selective capture of heavy metals by poly(acrylic acid) grafted chitosan and biochar composite for wastewater treatment, Chem. Eng. J., 2019, 378, 122215–122231 CrossRef CAS.
| This journal is © The Royal Society of Chemistry 2022 |

