 Open Access Article
Rare-earth-incorporated ternary CexCd1−xS quantum dot-sensitized solar cells
Eva Natalia Chiristinaa,
Siti Utari Rahayu ab,
Auttasit Tubtimtaec,
Jen-Bin Shid and
Ming-Way Lee
 *a
*a
aDepartment of Physics and Institute of Nanoscience, National Chung Hsing University, Taichung, 402, Taiwan. E-mail: mwl@phys.nchu.edu.tw
bProgram of Study in Physics, Universitas Sumatera Utara, Medan 20155, Sumatera Utara, Indonesia
cDepartment of Physics, Faculty of Liberal Arts and Science, Kasetsart University Kamphaeng Saen Campus, Nakhon Pathom 73140, Thailand
dDepartment of Electronic Engineering, Feng Chia University, Taichung, 40724, Taiwan
First published on 31st October 2022
Abstract
This work presents a new absorber material – rare-earth-doped ternary CexCd1−xS quantum dots (QDs) – for solar cells. CexCd1−xS QDs were synthesized by partially replacing the cation Cd in the binary sulfide CdS with Ce using a two-step solution processing process. First, Ce–S QDs were grown on a mesoporous TiO2 electrode. Second, Cd–S QDs were grown on top of the Ce–S QDs. Post annealing transformed the Ce–S/Cd–S double layers into the ternary CexCd1−xS structure. The synthesized CexCd1−xS QDs have the same hexagonal structure as the host CdS, with an average particle size of 11.8 nm. X-ray diffraction reveals a slight lattice expansion in CexCd1−xS relative to CdS. The band gap Eg of CexCd1−xS exhibits a monotonic decrease from 2.40 to 2.24 eV with increasing Ce content x from 0 to 0.20, indicating an Eg tunable by controlling the dopant content. CexCd1−xS QDSCs were fabricated with a polysulfide electrolyte and CuS counter electrode. The best CexCd1−xS cell yields a Jsc of 8.16 mA cm−2, a Voc of 0.73 V, a fill factor of 62.5%, and an efficiency of 3.72% under 1 sun. The efficiency increases to 4.24% under the reduced light intensity of 0.25 sun. The efficiency of the CexCd1−xS cell is 25% higher than that of the host CdS cell. The improved performance is attributed to the broader absorption range resulting from Ce doping. These results suggest the potential of using Ce as a dopant in CdS to tune the Eg and improve the photovoltaic performance.
1 Introduction
The increasing demand for energy and the limited availability of fossil fuels encourage scientists and researchers worldwide to develop cost-effective renewable energy devices, one of them being photovoltaic cells. Amongst many types of photovoltaic cells, quantum dot-sensitized solar cells (QDSCs) are promising photovoltaic cells. A QDSC contains three components: a photoanode, an electrolyte, and a counter electrode. The photoanode consists of a mesoporous TiO2 matrix coated with a layer of semiconductor in the form of quantum dots (QDs) as the light absorber. There are several advantages of employing QDs as the absorber, such as high extinction coefficient,1 tunable bandgap,2 efficient multiple exciton generation (MEG),3 and increased stability toward heat, moisture, and light.4 Besides, QDs can be obtained via the solution processing method, making QDSCs a low-cost alternative to Si-based photovoltaic cells. Furthermore, the MEG in QDSC could allow the power conversion efficiency (PCE) to go beyond the Shockley–Queisser limit. Yet, some challenges must be inspected to reach the maximum theoretical PCE above 40%.5An important criterion for a good semiconductor absorber material is that its bandgap should be near 1.4 eV to produce the maximal output of the Shockley–Queisser limit.6 However, there are a limited number of semiconductors in nature with the ideal Shockley–Queisser gap. It would be desirable to tune the bandgap artificially to be closer to the ideal bandgap. Currently, metal sulfides are the most widely studied semiconductor materials for QDSCs. There are three ways to tune the bandgap of a metal sulfide by controlling the composition of (a) cation alloy, (b) anion alloy, and (c) cation–anion alloy. The incorporation of Sn into Sb2S3 leads to a tunable optical range of 300–800 nm in cation alloyed semiconductor SnxSb2−yS3.7 The absorption range of the cation alloyed semiconductor ZnxCd1−xS is tunable from 474 to 391 nm by controlling the composition ratios of the two cation elements Zn and Cd.8
CdS has been one of the most widely studied materials for solar cells among all metal sulfides. For example, the incorporation of CdS QDs in a blend of P3HT and PCBM for hybrid bulk heterojunction polymer solar cells increased the efficiency from 2.95% to 4.41%.9 An advantage of CdS is the Voc ∼0.6–0.7 V, a relatively high photovoltage for a QDSC. This high Voc is because of the relatively large band gap of 2.4 eV. However, the large Eg also yields a narrow absorption band of 300–500 nm, leading to inefficient light absorption and low solar cell efficiency. The problem of the narrow absorption band can be improved by using one of the band tuning strategies discussed above. Herein, the composition control of cation alloying is adopted by incorporating a second metal into CdS to obtain a tunable band gap in CdS.
The use of rare-earth metals as solar absorbers in QDSCs has been less explored. Recently, Gd doping into CdS has been reported to lower the band gap and produces an enhanced efficiency.10 The result suggests the potential of using other rare earth metals to improve QDSCs. Based on the empirical results, the band gap of a semiconductor is roughly inversely proportional to the lattice constant: a semiconductor with a small lattice constant would have a larger band gap.11 The ionic radius of Ce3+ (102 pm) is larger than that (95 pm) of Cd2+. Therefore, substituting Cd2+ with Ce3+ would increase the lattice constant and produce a reduced band gap, increasing the light absorption range.
In this study, a fraction of the cation Cd2+ in the binary CdS is replaced by Ce3+, forming ternary CexCd1−xS quantum dots. CexCd1−xS liquid-junction quantum dot-sensitized solar cells (QDSCs) were fabricated using the synthesized QDs. The photovoltaic performance under different successive ionic layer adsorption and reaction (SILAR) cycles and sun intensities are examined. The effects of Ce incorporation were investigated using XRD and XPS measurements. In addition, the transition of the band gap with Ce content toward a longer wavelength was studied via UV-Vis and external quantum efficiency (EQE) measurements. There is a slight increase in the optical absorption range of CexCd1−xS compared to pure CdS. The short-circuit current density, open-circuit voltage, and fill factor all increase after Ce doping, leading to an ∼24% increase in the power conversion efficiency (PCE). To our best knowledge, this is the first work on CexCd1−xS QDSCs. The results show the clear benefit of Ce incorporation to CdS in improving the performance of CdS QDSCs.
2 Experimental section
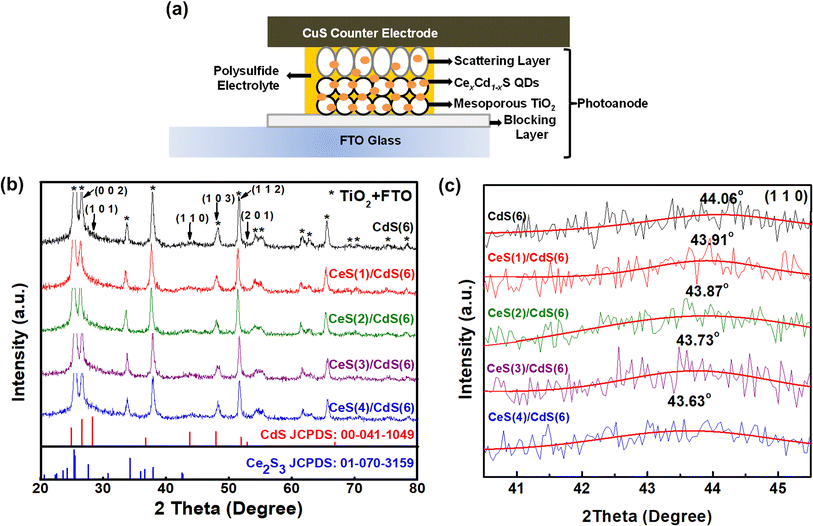
Fig. 1(a) shows a schematic diagram of a CexCd1−xS QDSC, containing three major components: a photoanode, an electrolyte, and a counter electrode. Details of preparation for each component are described as follows.2.1. Preparation of TiO2 electrodes
The TiO2 electrode consisted of a three-layer structure: a blocking layer12 (thickness: ∼50–70 nm), a mesoporous TiO2 layer (mp-TiO2, thickness: 10–12 μm, particle size ∼30 nm), and a TiO2 scattering layer13 (thickness: ∼5 μm, particle size ∼300–400 nm). FTO glass was first cleaned using acetone, methanol, and DI water sequentially for 3 min each with an ultrasonic cleaner. Then, 50 μl of the prepared 0.247 M titanium(IV) isopropoxide (TTIP) solution was spin-coated on top of the FTO glass (area ∼1.5 cm × 1.2 cm), followed by heating on a hot plate at 190 °C for 5 min. Next, the mp-TiO2 layer sample was prepared by pasting commercial TiO2 paste (DSL 30NR-T, GreatCell Solar) using the doctor blade method, then heated at 125 °C for 10 min. After cooling down, the sample was coated with a TiO2 scattering layer, 0.5 cm in diameter, by applying the same doctor blade method. The prepared TiO2 electrode was finally annealed at 500 °C for 90 min.14 The active area of a fabricated TiO2 electrode is a circle with a diameter of 0.3 cm. The function of each layer is as follows: the TiO2 blocking layer prevents the photoelectrons in the FTO glass substrate from being in direct contact with holes in the electrolyte; the mesoporous TiO2 layer serves as the three-dimensional frame for QD deposition as well as electron conduction layer; the TiO2 scattering layer increases the light-harvesting capacity by collecting the scattered light with the layer.2.2. Synthesis of CexCd1−xS QDs
Ce-incorporated CdS QDs were grown onto an mp-TiO2 electrode using a two-stage successive ionic layer adsorption and reaction (SILAR) method as described in several earlier reports.15–17 First, a layer of Ce–S QDs was grown on the TiO2 electrode. Second, a layer of Cd–S QDs was grown on top of the Ce–S QDs. A post-annealing process transforms the Ce–S/Cd–S structure into the ternary CexCd1−xS phase. A Ce–S SILAR cycle consisted of dipping a TiO2 electrode into a 0.1 M Ce(NO3)3·6H2O ethanol solution for 60 s, followed by rinsing with ethanol and drying on a hot plate at 40 °C. Then, the sample was immersed in a 0.1 M Na2S·9H2O methanol/DI water (1![[thin space (1/6-em)]](https://www.rsc.org/images/entities/char_2009.gif) :
:![[thin space (1/6-em)]](https://www.rsc.org/images/entities/char_2009.gif) 1, v/v) solution for 150 s and subsequently rinsed with methanol and dried on a hot plate at 40 °C. Finally, the substrate was immersed again in the Ce3+ solution for 1 min. This two-step immersing process formed one SILAR cycle for Ce–S seeds. The process was repeated n times (n = 1 to 4) to obtain the desired amount of Ce–S material on the TiO2 electrode. For the Cd–S SILAR deposition, the Ce–S-coated TiO2 electrode was dipped into a 0.1 M Cd(CH3COO)2·2H2O ethanol/DI water (1
1, v/v) solution for 150 s and subsequently rinsed with methanol and dried on a hot plate at 40 °C. Finally, the substrate was immersed again in the Ce3+ solution for 1 min. This two-step immersing process formed one SILAR cycle for Ce–S seeds. The process was repeated n times (n = 1 to 4) to obtain the desired amount of Ce–S material on the TiO2 electrode. For the Cd–S SILAR deposition, the Ce–S-coated TiO2 electrode was dipped into a 0.1 M Cd(CH3COO)2·2H2O ethanol/DI water (1![[thin space (1/6-em)]](https://www.rsc.org/images/entities/char_2009.gif) :
:![[thin space (1/6-em)]](https://www.rsc.org/images/entities/char_2009.gif) 1, v/v) solution for 120 s, followed by rinsing with ethanol and drying at 40 °C. Next, it was immersed in a 0.1 M Na2S·9H2O methanol/DI water (1
1, v/v) solution for 120 s, followed by rinsing with ethanol and drying at 40 °C. Next, it was immersed in a 0.1 M Na2S·9H2O methanol/DI water (1![[thin space (1/6-em)]](https://www.rsc.org/images/entities/char_2009.gif) :
:![[thin space (1/6-em)]](https://www.rsc.org/images/entities/char_2009.gif) 1, v/v) solution for 150 s, then rinsed with methanol and dried at 40 °C. This two-dipping process formed one SILAR cycle for Cd–S seeds. As reported in the literature, the optimal number of SILAR cycles for CdS had been determined to be seven;18 hence, the number of CdS SILAR cycles was fixed at six herein to make room to accommodate the incorporated Ce in this work. Lastly, the double-layer Ce–S/Cd–S seeds were annealed at 250 °C for 10 min, forming ternary CexCd1−xS QDs. The sample that went through n cycles of Ce–S seeds and six cycles of Cd–S seeds is denoted as CeS(n)/CdS(6) herein.
1, v/v) solution for 150 s, then rinsed with methanol and dried at 40 °C. This two-dipping process formed one SILAR cycle for Cd–S seeds. As reported in the literature, the optimal number of SILAR cycles for CdS had been determined to be seven;18 hence, the number of CdS SILAR cycles was fixed at six herein to make room to accommodate the incorporated Ce in this work. Lastly, the double-layer Ce–S/Cd–S seeds were annealed at 250 °C for 10 min, forming ternary CexCd1−xS QDs. The sample that went through n cycles of Ce–S seeds and six cycles of Cd–S seeds is denoted as CeS(n)/CdS(6) herein.
The synthesized CexCd1−xS QDs were coated with a ZnS film layer to reduce carrier recombination using the SILAR method. The prepared sample was first immersed in a Zn(NO3)2·6H2O ethanol solution for 60 s, then rinsed with ethanol and dried at 40 °C. It was then dipped in the Na2S·9H2O methanol/DI water (1![[thin space (1/6-em)]](https://www.rsc.org/images/entities/char_2009.gif) :
:![[thin space (1/6-em)]](https://www.rsc.org/images/entities/char_2009.gif) 1, v/v) solution for 60 s, rinsed with methanol, and dried at 40 °C. This two-step process was repeated for two cycles to obtain the ZnS passivation layer.
1, v/v) solution for 60 s, rinsed with methanol, and dried at 40 °C. This two-step process was repeated for two cycles to obtain the ZnS passivation layer.
2.3. Solar cell fabrication
The CexCd1−xS sensitized solar cells were fabricated by assembling the prepared TiO2 electrode with a CuS counter electrode using a parafilm spacer (thickness ∼190 μm). The CuS counter electrode was fabricated through the chemical bath deposition (CBD) method. In brief, three pieces of precleaned FTO glass were placed horizontally in a 40 ml aqueous solution (consisting of 1.564 g of CuSO4·5H2O, 3.968 g of Na2S2O3, and 0.969 g of CH₄N₂O) at 55 °C for 70 min.19 The polysulfide electrolyte, consisting of 1 M Na2S, 2 M S, and 0.2 M KCl in methanol/water (7![[thin space (1/6-em)]](https://www.rsc.org/images/entities/char_2009.gif) :
:![[thin space (1/6-em)]](https://www.rsc.org/images/entities/char_2009.gif) 3 by volume), was injected into the space between the TiO2 electrode and the CuS counter electrode before I–V measurements.
3 by volume), was injected into the space between the TiO2 electrode and the CuS counter electrode before I–V measurements.
2.4. Material characterization
The structural and morphological characteristics of the synthesized QDs were studied using an X-ray diffractometer (XRD, Bruker D8) and a transmission electron microscope (TEM, JEOL JEM-2010). X-ray photoelectron spectroscopy (XPS) was measured using a ULVAC-PHI 5000 with Ar-heated treatment. Optical spectra were measured using a Hitachi U-2800A UV-Vis spectrophotometer. I–V measurements were conducted using a Keithley 2400 source meter with 100 mW cm−2 light illumination from a 150 W Xe lamp. A metal mask defined the cell's active area to be a circle of 3 mm in diameter. External quantum efficiency (EQE) spectra were collected using an Acton monochromator with a 250 W tungsten halogen lamp (without white-light biasing). A batch of three to six samples was measured for each experiment to ensure data consistency.3 Results and discussion
3.1. X-ray diffraction
The structural property of Ce-incorporated CdS quantum dots (QDs) under different SILAR cycles was analyzed by XRD. Fig. 1(b) displays the XRD patterns of pure CdS and four CexCd1−xS samples. The pure CdS QDs exhibit the hexagonal structure with the reference JCPDS number 00-041-1049. The CdS pattern can be indexed to the Miller indices (002), (101), (110), (103), (112), and (201). Many prominent peaks due to the TiO2 matrix or FTO glass are also observed in the spectrum. These background peaks are much more intense than CdS because the amount of TiO2 and FTO material in the photoanode is much larger than that of the CdS QDs. For comparison, the XRD peaks of the two starting materials – CdS and Ce2S3 – are shown at the bottom panel. The CexCd1−xS QDs maintain the hexagonal structure of CdS with no impurity phase arising from Ce, CeS, or Ce2S3; similar results were obtained from other reports using different growth techniques.20–22 Many CexCd1−xS peaks overlap strongly with the background TiO2 peaks and are difficult to discern. Only the (110) index around the angle of 44° is well separated from the background peaks. Fig. 1(c) shows the angle dependence of the (110) peak on the number of Ce SILAR cycles. The peak shifted slightly toward lower angles from 44.06° to 43.63° as the number of Ce SILAR cycles n increased from 0 to 4. The downshift of the peak angle implies a lattice expansion due to the size difference between the ionic radii of the two cationic ions – Ce3+(1.14 Å) and Cd2+(0.95 Å). The substitution of Cd2+ by the larger Ce3+ leads to a lattice expansion. Similar angle shifts were reported in Ce-doped CdS samples in the previous literature.20 These results indicate the successful incorporation of Ce into the host CdS lattice.3.2. X-ray photoelectron spectroscopy
XPS investigated the elemental composition and binding states of the elements of CexCd1−xS prepared with the best condition of CeS(1)/CdS(6). Fig. 2(a) shows a survey spectrum indicating the existence of Ce, Cd, S, Ti, and O elements. The two Ce 3d peaks appear at 885.1 eV and 881.1 eV for Ce 3d5/2 state, and at 899.4 eV and 903.4 eV for Ce 3d3/2 state (Fig. 2(b)). This result confirms the existence of the trivalent Ce3+ state in CexCd1−xS.21,23,24 Fig. 2(c) shows two Cd2+ peaks at 404.4 eV (Cd 3d5/2) and 411.1 eV (Cd 3d5/2) separated by 6.7 eV due to the spin–orbit splitting.25 These two peaks confirm the existence of the Cd divalent state in CexCd1−xS. Fig. 2(d) shows a large peak located at the binding energy of 162.3 eV and a small peak at 161.0 eV corresponding to the S 2p1/2 and S 2p3/2 states, respectively, confirming the presence of the S2− state in the sample.26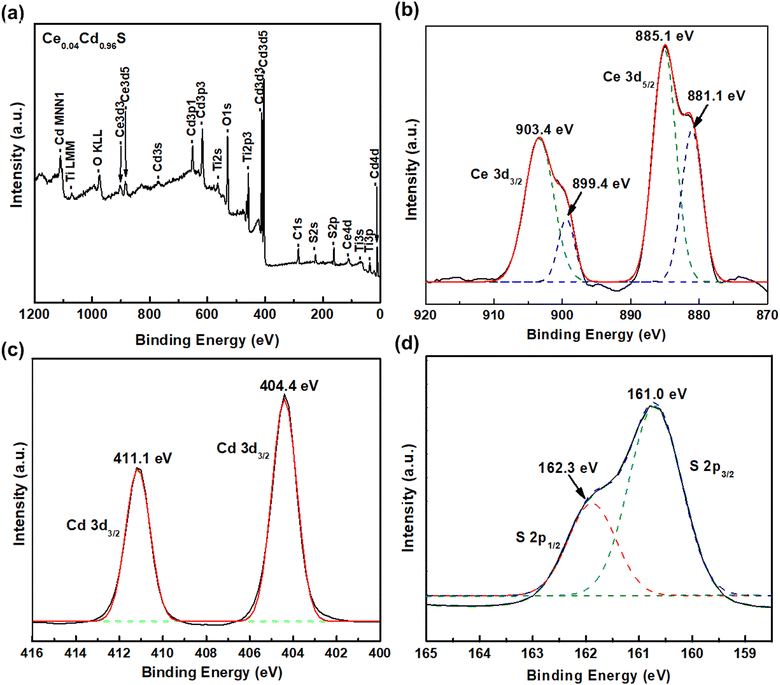 | ||
| Fig. 2 XPS spectra of CexCd1−xS QDs (a) survey spectrum and deconvoluted spectra of (b) Ce 3d, (c) Cd 3d, and (d) S 2p, respectively. | ||
Table 1 presents the XPS quantitative analysis of the atomic composition of the pure CdS and CexCd1−xS samples with different SILAR cycles. The Ce atomic percentage increases monotonically with the number of Ce–S SILAR cycles. The maximum Ce atomic percentage is x = 10.7% for the sample with four Ce–S SILAR cycles. In addition, from Table 1, the nominal expressions of the chemical formula of the samples are CdS, Ce0.04Cd0.96S, Ce0.05Cd0.95S, Ce0.10Cd0.90S, and Ce0.20Cd0.80S, respectively (the accurate chemical formula is outside the context of this paper, which mainly focus on photovoltaics).
| Sample | Ce (%) | Cd (%) | S (%) | Ce![[thin space (1/6-em)]](https://www.rsc.org/images/entities/char_2009.gif) : :![[thin space (1/6-em)]](https://www.rsc.org/images/entities/char_2009.gif) Cd ratio Cd ratio |
Ce content (x) |
|---|---|---|---|---|---|
| CeS(0)/CdS(6) | 0 | 62.5 | 37.5 | — | 0 |
| CeS(1)/CdS(6) | 2.6 | 65.7 | 31.7 | 1![[thin space (1/6-em)]](https://www.rsc.org/images/entities/char_2009.gif) : :![[thin space (1/6-em)]](https://www.rsc.org/images/entities/char_2009.gif) 25 25 |
0.04 |
| CeS(2)/CdS(6) | 3.6 | 60.0 | 36.4 | 1![[thin space (1/6-em)]](https://www.rsc.org/images/entities/char_2009.gif) : :![[thin space (1/6-em)]](https://www.rsc.org/images/entities/char_2009.gif) 17 17 |
0.05 |
| CeS(3)/CdS(6) | 5.8 | 60.0 | 34.2 | 1![[thin space (1/6-em)]](https://www.rsc.org/images/entities/char_2009.gif) : :![[thin space (1/6-em)]](https://www.rsc.org/images/entities/char_2009.gif) 10 10 |
0.10 |
| CeS(4)/CdS(6) | 10.7 | 57.1 | 32.2 | 1![[thin space (1/6-em)]](https://www.rsc.org/images/entities/char_2009.gif) : :![[thin space (1/6-em)]](https://www.rsc.org/images/entities/char_2009.gif) 5 5 |
0.20 |
3.3. Transmission electron microscopy
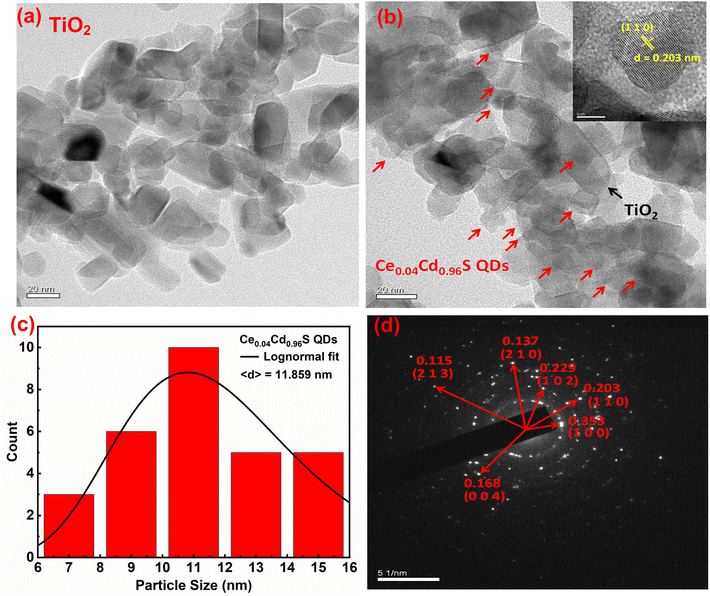
Fig. 3(a) displays a TEM picture of a bare TiO2 film. The TiO2 particles are in a long rectangular shape with an average size of 30 nm. Fig. 3(b) depicts a TEM picture of Ce0.04Cd0.96S QDs coated over the pores of mesoporous TiO2. The Ce0.04Cd0.96S QDs, indicated by red arrows in the figure, are approximately round in shape and are randomly dispersed over the surface of TiO2 nanoparticles. The particle sizes of Ce0.04Cd0.96S QDs are 6–17 nm, with an average particle size of 11.8 nm (Fig. 3(c)), while the d-spacing (inset) of 0.203 nm is in good agreement with the database of host CdS (JCPDS number 00-041-1049). The selected area electron diffraction (SAED) pattern of Ce0.04Cd0.96S QDs (Fig. 3(d)) matches the hexagonal structure of CdS nanocrystals with the Miller indices marked in the figure. The Ce0.04Cd0.96S QDs have the same crystallographic structure as the host material CdS. This result agrees with the XRD patterns of CexCd1−xS shown in Fig. 1(b).3.4. Optical spectra
Fig. 4 displays the optical absorption spectra of CexCd1−xS QDs. The transmission spectra T(λ) were taken by rationing the light intensity transmitted through a T(λ) CexCd1−xS sample to that of a mesoporous TiO2 background (Fig. 4(a)). The transmission decreases with increasing Ce–S SILAR cycles, implying increasing light absorption due to the increasing amount of Ce incorporation. Fig. 4(b) displays the absorbance spectra A(λ) = −log10 T(λ). The absorbance A also increases with increasing the Ce–S SILAR cycle, which again indicates that the incorporation of Ce increases the light absorption capacity of the sample. Fig. 4(c) shows the Tauc plots (Ahυ)2 vs. hυ for the five samples, where h is the Planck constant and υ is the photon frequency. The optical band gap Eg,op was determined by taking the x-intercept of an extrapolated Tauc plot. The Eg,op exhibits a monotonic decrease with increasing number of Ce–S SILAR cycles: 2.40 (CdS), 2.33 (CeS(1)/CdS(6)), 2.30 (CeS(2)/CdS(6)), 2.28 (CeS(3)/CdS(6)) and 2.24 eV (CeS(4)/CdS(6)). The substitution of Cd2+(0.95 Å) by the larger Ce3+(1.14 Å) leads to a lattice expansion, which results in a reduced Eg. Increasing SILAR cycles produces larger crystalline size, which also leads to a lower Eg. The Eg,op of the pure CdS sample is 2.40 eV, consistent with earlier reports.27–29 The sample CeS(1)/CdS(6) with the best photovoltaic performance (discussed below) has an Eg,op of 2.33 eV. This result is consistent with the report by Zhan et al. that the best Ce-doped CdS solar cell on TiO2 nanorods has an Eg,op of 2.35 eV.21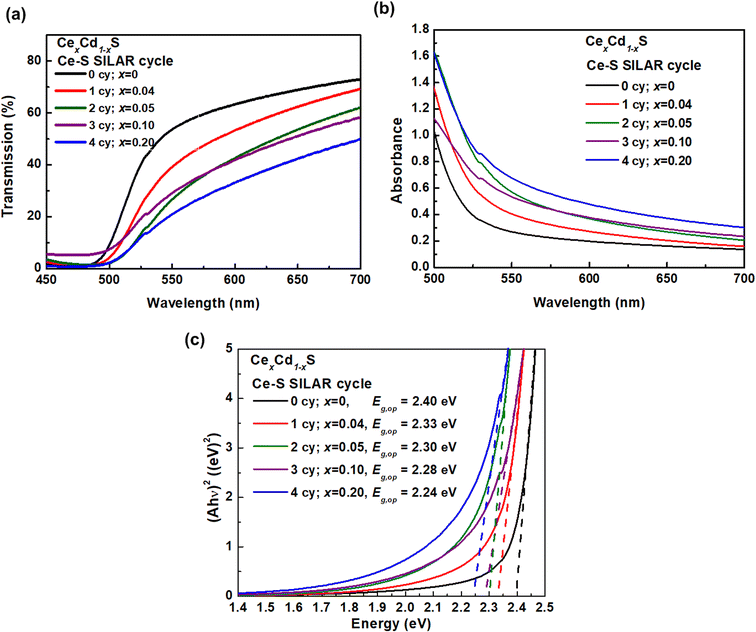 | ||
| Fig. 4 Optical spectra: (a) transmission, (b) absorbance, and (c) Tauc plots (Ahυ)2 vs. hυ of CexCd1−xS with various Ce content. | ||
3.5. Photovoltaic performance
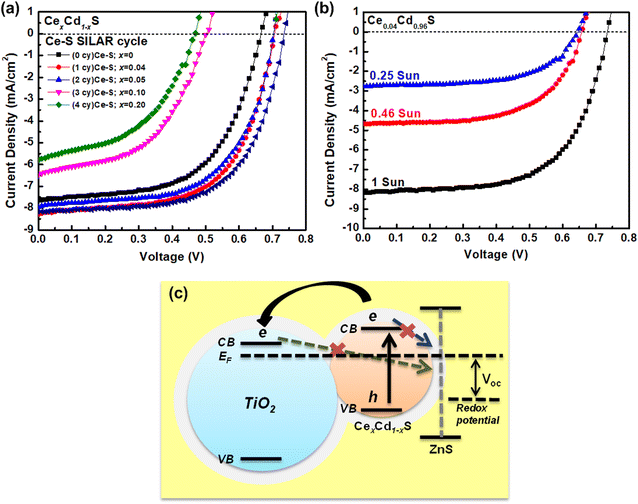
Fig. 5(a) displays the I–V curves of six CexCd1−xS QDSCs with various numbers of Ce–S SILAR cycles. Table 2 lists the photovoltaic parameters, including the short-circuit current density (Jsc), open-circuit voltage (Voc), fill factor (FF), and efficiency. The pure, undoped CdS solar cells (sample no. 1) have an efficiency of 2.98%, with a Jsc of 7.64 mA cm−2, a Voc of 0.66 V, and an FF of 59.0%. The incorporation of Ce into Cd–S (sample no. 2, CeS(1)/CdS(6)) improves the Jsc to 8.28 mA cm−2, the Voc to 0.70 V, and FF of 61.7%, yielding an efficiency of 3.56% (an 18.8% increase over that of CdS). To further improve the performance, the best cell (sample no. 2) was coated with a ZnS passivation layer. The ZnS treatment improves the efficiency to 3.71% (sample no. 6), a modest improvement over that (3.56%) of the untreated cell. The enhanced performance of CexCd1−xS samples is attributed to the broader absorption range, as revealed in the optical results shown in Fig. 4. However, a further increase in the Ce content does not improve the performance. The efficiency decreases from 3.37 to 1.28% as the SILAR cycle increases from 2 to 4 (sample no. 3–5). This is explained by the excess amount of material loading in the matrix of a mesoporous TiO2 could impede the electrolyte flow inside the cell, hampering the redox reaction.| No | Sample | Jsc (mA cm−2) | Voc (V) | Fill factor (%) | Efficiency (%) |
|---|---|---|---|---|---|
| a Average value from three cells in parallel.b Champion cell. | |||||
| 1 | CdSa | 7.64 ± 0.30 | 0.66 ± 0.01 | 59.0 ± 0.57 | 2.98 ± 0.02 |
| 2 | Ce0.04Cd0.96Sa | 8.28 ± 0.63 | 0.70 ± 0.00 | 61.7 ± 6.58 | 3.56 ± 0.11 |
| 3 | Ce0.05Cd0.95Sa | 7.94 ± 0.74 | 0.65 ± 0.00 | 65.3 ± 3.14 | 3.37 ± 0.15 |
| 4 | Ce0.10Cd0.90Sa | 6.48 ± 0.52 | 0.50 ± 0.04 | 51.2 ± 1.30 | 1.66 ± 0.05 |
| 5 | Ce0.20Cd0.80Sa | 5.80 ± 0.13 | 0.47 ± 0.01 | 47.5 ± 0.61 | 1.28 ± 0.03 |
| 6 | Ce0.04Cd0.96S/ZnSa | 8.39 ± 0.33 | 0.72 ± 0.01 | 61.4 ± 1.49 | 3.71 ± 0.01 |
| 7 | Ce0.04Cd0.96S/ZnSb | 8.16 | 0.73 | 62.5 | 3.72 |
| 8 | Mn-doped CdS30 | 8.90 | 0.58 | 49.0 | 2.53 |
| 9 | Ni-doped CdS31 | 8.91 | 0.64 | 54.3 | 3.11 |
| 10 | Cu-doped CdS32 | 9.40 | 0.64 | 50.1 | 3.00 |
The synthesized CexCd1−xS QDs were coated with a ZnS film layer to reduce carrier recombination using the SILAR method. As shown in the schematic diagram of Fig. 5(c), the high conduction band level of ZnS blocks the photoelectrons in the conduction band of CexCd1−xS QDs from recombination with holes in the electrolyte.
The photovoltaic performance of SILAR-prepared QDSCs can be enhanced by measuring I–V curves under reduced sun intensities. Fig. 5(b) displays the I–V curves under three reduced sun intensities: 1, 0.46, and 0.25 sun. Table 3 lists the photovoltaic parameters. As shown, lowering sun intensity generates improved photovoltaic efficiency, except for Voc. The efficiency increases from 3.72% (1 sun) to 4.24% (0.25 sun), a 14% enhancement. The improved photovoltaic performance of the cells can be understood from the fact that the use of SILAR to grow quantum dots in the mesoporous TiO2 results in nanoparticles with many surface defects, which act as recombination centers for the electron–hole pairs;33 therefore, by lowering the sun intensity (fewer photons), the number of photocarriers is reduced, leading to reduced carrier recombination and improved photovoltaic performance. This result indicates that CexCd1−xS QDSCs work more efficiently under low light.
| Light intensity | Jsc (mA cm−2) | Voc (V) | Fill factor (%) | Efficiency (%) |
|---|---|---|---|---|
| 1 sun | 8.16 | 0.73 | 62.5 | 3.72 |
| 0.46 sun | 4.67 | 0.65 | 60.7 | 4.00 |
| 0.25 sun | 2.77 | 0.64 | 59.9 | 4.24 |
3.6. External quantum efficiency (EQE)
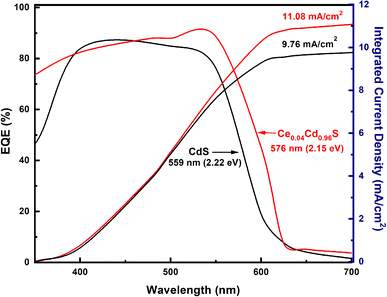
Fig. 6 displays the EQE spectra for the pure CdS and Ce0.04Cd0.96S QDSCs. The Ce0.04Cd0.96S cell exhibits a broader spectral range (350–630 nm) than that (350–610 nm) of CdS. The band gap energy, Eg,pv, can be deduced from the absorption onset of an EQE spectrum.34 The onset of the two EQE curves yields Eg,pv = 2.15 eV for Ce0.04Cd0.96S and 2.22 eV for CdS (Fig. 6). The incorporation of Ce into CdS leads to a decreased bandgap, resulting in a broader light absorption range and enhanced solar cell efficiency. The EQE values are 80–90% over the spectral range of 350–550 nm. These EQE values are relatively high for a solar cell, indicating the good quality of the samples in this work.The integrated current density (Jsc) of a solar cell can be calculated from an EQE spectrum using (1)
 | (1) |
4 Conclusions
We demonstrated the fabrication of CexCd1−xS QDSSCs prepared on a mp-TiO2 electrode. The incorporation of Ce into CdS QDs broadens the optical absorbance range from 500 nm to 550 nm, resulting in an Eg,op of 2.24–2.33 eV, which is 7% broader than that of CdS. As a result, the best CexCd1−xS liquid-junction QDSCs, with x = 0.04, had an efficiency of 3.72% and a high Voc of 0.73 V, representing about 25% improvement over the CdS QDSCs (2.98%). The EQE-integrated Jsc equals to 11.08 mA cm−2, 13% higher than 9.76 mA cm−2 for CdS solar cell. These results suggest that Ce could be used as a dopant to tune the optical properties and improve the photovoltaic performance of CdS.Author contributions
Eva Natalia Christina: methodology, validation, formal analysis, investigation. Siti Utari Rahayu: investigation, formal analysis, writing – original draft. Auttasit Tubtimtae: formal analysis. Jen-Bin Shi: formal analysis. Ming-Way Lee: term, conceptualization, methodology, resources, formal analysis, investigation, writing – review & editing, supervision.Conflicts of interest
There are no conflicts to declare.Acknowledgements
The authors are grateful for the financial support from the Ministry of Science and Technology (MOST) in Taiwan under grant no. MOST 111-2112-M-005-017.Notes and references
- W. W. Yu, L. Qu, W. Guo and X. Peng, Chem. Mater., 2003, 15, 2854–2860 CrossRef CAS.
- S. K. Haram, A. Kshirsagar, Y. D. Gujarathi, P. P. Ingole, O. A. Nene, G. B. Markad and S. P. Nanavati, J. Phys. Chem. C, 2011, 115(14), 6243–6249 CrossRef CAS.
- V. I. Klimov, Appl. Phys. Lett., 2006, 89(12), 123118 CrossRef.
- Z. Pan, H. Rao, I. Mora-Seró, J. Bisquert and X. Zhong, Chem. Soc. Rev., 2018, 47, 7659–7702 RSC.
- M. C. Hanna and A. J. Nozik, J. Appl. Phys., 2006, 100(7), 074510 CrossRef.
- W. Shockley and H. J. Queisser, J. Appl. Phys., 1961, 32(3), 510–519 CrossRef CAS.
- H. Samosir, P. Boon-On, Y. E. Lin, L. P. Chen, D. J. Singh, J. B. Shi and M. W. Lee, J. Phys. Chem. C, 2019, 123(9), 5209–5215 CrossRef CAS.
- X. Zhong, Y. Feng, W. Knoll and M. Han, J. Am. Chem. Soc., 2003, 125(44), 13559–13563 CrossRef CAS PubMed.
- M. Imran, M. Ikram, A. Shahzadi, S. Dilpazir, H. Khan, I. Shahzadi, S. A. Yousaf, S. Ali, J. Geng and Y. Huang, RSC Adv., 2018, 8(32), 18051 RSC.
- A. Reza Amani-Ghadim, E. Mohammad-Gholipour-Rezaei, F. Bayat, S. Agbolaghi and F. Khodam, Sol. Energy, 2022, 231, 402–413 CrossRef CAS.
- R. Dalven, Phys. Rev. B, 1973, 8, 6033 CrossRef CAS.
- A. Sangiorgi, R. Bendoni, N. Sangiorgi, A. Sanson and B. Ballarin, Ceram. Int., 2014, 40(7), 10727–10735 CrossRef CAS.
- S. Hore, C. Vetter, R. Kern, H. Smit and A. Hinsch, Sol. Energy Mater. Sol. Cells, 2006, 90(9), 1176–1188 CrossRef CAS.
- P. Wang, S. M. Zakeeruddin, P. Comte, R. Charvet, R. Humphry-Baker and M. Grätzel, J. Phys. Chem. B, 2003, 107(51), 14336–14341 CrossRef CAS.
- M. W. Lee, in AIP Conference Proceeding, 2020, vol. 2221 Search PubMed.
- S. U. Rahayu and M. W. Lee, in AIP Conference Proceedings, 2020 Search PubMed.
- K. Sebayang, S. U. Rahayu, M. W. Lee, S. Gea, H. Ginting and A. Warman, Rasayan J. Chem., 2021, 14(1), 88–93 CrossRef CAS.
- P. Boon-on, S. W. Lien, T. R. Chang, J. Bin Shi and M. W. Lee, Prog. Photovoltaics, 2020, 28(4), 328–341 CAS.
- W. Zheng and S. Zhang, Inorg. Chem. Commun., 2020, 122, 108294 CrossRef CAS.
- L. Saravanan, A. Pandurangan and R. Jayavel, Mater. Lett., 2012, 66(1), 343–345 CrossRef CAS.
- F. Zhan, W. Liu, H. Li, Y. Yang and M. Wang, Appl. Surf. Sci., 2018, 455, 476–483 CrossRef CAS.
- A. Ekinci, S. Horoz and Ö. Şahin, Chalcogenide Lett., 2020, 17(6), 263–268 CAS.
- E. Bêche, P. Charvin, D. Perarnau, S. Abanades and G. Flamant, Surf. Interface Anal., 2008, 40(3–4), 264–267 CrossRef.
- R. Fiorenza, C. Crisafulli, G. G. Condorelli, F. Lupo and S. Scirè, Catal. Lett., 2015, 145(9), 1691–1702 CrossRef CAS.
- D. Barreca, A. Gasparotto, C. Maragno and E. Tondello, Surf. Sci. Spectra, 2002, 9(1), 46–53 CrossRef CAS.
- C. Liu, H. Tang, J. Li, W. Li, Y. Yang, Y. Li and Q. Chen, RSC Adv., 2015, 5, 35506–35512 RSC.
- Y. Tachibana, H. Y. Akiyama, Y. Ohtsuka, T. Torimoto and S. Kuwabata, Chem. Lett., 2007, 36, 88–89 CrossRef CAS.
- X. Qi, G. She, Y. Liu, L. Mu and W. Shi, Chem. Commun., 2012, 48(2), 242–244 RSC.
- M. F. Rahman, J. Hossain, A. Kuddus, S. Tabassum, M. H. K. Rubel, H. Shirai and A. B. M. Ismail, Appl. Phys. A: Mater. Sci. Process., 2020, 126(2), 1–11 CrossRef.
- P. K. Santra and P. V. Kamat, J. Am. Chem. Soc., 2012, 134(5), 2508–2511 CrossRef CAS.
- C. V. V. M. Gopi, M. Venkata-Haritha, H. Seo, S. Singh, S. K. Kim, M. Shiratani and H. J. Kim, Dalton Trans., 2016, 45(20), 8447–8457 RSC.
- M. P. A. Muthalif, Y. S. Lee, C. D. Sunesh, H. J. Kim and Y. Choe, Appl. Surf. Sci., 2017, 396, 582–589 CrossRef CAS.
- M. Tachiya and K. Seki, Phys. Rev. B: Condens. Matter Mater. Phys., 2010, 82(8), 085201 CrossRef.
- O. Almora, C. I. Cabrera, J. Garcia-Cerrillo, T. Kirchartz, U. Rau and C. J. Brabec, Adv. Energy Mater., 2021, 11(16), 2100022 CrossRef CAS.
| This journal is © The Royal Society of Chemistry 2022 |

