 Open Access Article
Production of rare earth element oxide powders by solution combustion: a new approach for recycling of NdFeB magnets
Elif Emil-Kaya *abc,
Srecko Stopica,
Sebahattin Gürmenb and
Bernd Friedrich
 a
a
aIME Process Metallurgy and Metal Recycling, RWTH Aachen University, 52056 Aachen, Germany. E-mail: eemil@ime-aachen.de
bDepartment of Metallurgical & Materials Eng., Istanbul Technical University, 34469 Istanbul, Turkey
cDepartment of Materials Science and Tech., Turkish-German University, 34820 Istanbul, Turkey
First published on 2nd November 2022
Abstract
NdFeB magnets are employed in various technological applications due to their outstanding magnetic properties, such as high maximum energy product, high remanence and high coercivity. Production of NdFeB has gathered more interest, therefore the demand for rare earth elements (REEs) has continuously increased. The recovery of REEs has become essential to satisfy this demand in recent years. In the present study, a promising flowsheet is proposed for REEs recovery from NdFeB magnets, as follows: (1) acid baking, (2) employment of ultrasound-assisted water leaching, (3) the production of rare earth oxides (RE oxides) by a solution combustion method, and (4) a calcination process. There are several problems in conventional precipitation such as loss of a high amount of metal during precipitation and use of a high amount of precipitation agents. It is worth mentioning that the consumed precipitation agents in the solution are not easily recyclable. This study aims especially to investigate the production of RE oxides from recycled NdFeB magnets by solution combustion as an alternative to conventional precipitation methods. In this way, impurities that may have come to the system from the precipitation agents were prevented. Moreover, in the production of RE oxides via the above-mentioned method, precipitation agents and filtration steps were not necessary.
Introduction
With increasing use of rare earth elements (REEs) in high-tech products in many areas including renewable energy, transportation, and electronic devices comes increasing concern over supplying REEs. Environmental problems in their production from ore, national policies and limited resources have resulted in increasing the number of studies about the recycling of REEs from secondary sources.1–7 Neodymium iron boron (NdFeB) magnets are considered as a valuable secondary source for REEs (Nd, Pr, Dy, Tb) due to the high content of REEs. About 25% of REEs produced worldwide have been utilized in the production of NdFeB which is used in various high-tech products including electronic devices, wind turbines and electric bicycles and industrial engines. For these reason, the recovery of REEs from scrap NdFeB magnets is a potential candidate for the solution of the supply problem of them.8–10Most researchers have proposed hydrometallurgical, pyrometallurgical, and electrometallurgical processes to recycle REEs from NdFeB magnets.11–16 In particular, hydrometallurgical methods have received attention because lower grade secondary raw materials and complex streams can be recovered by these techniques. Moreover, high-purity products can be produced by hydrometallurgical methods. Direct and selective leaching techniques for the recovery of REEs have been proposed. In these selective leaching processes, samples are commonly treated with strong acids/alkali agents or they undergo heat treatment. Previous research has employed the dry digestion process with HCl at room temperature to avoid silica gel formation and increase the extraction efficiency of REEs from eudialyte concentrate. In these studies, HCl was determined to be an efficient agent for the recovery of REEs with high purity from eudialyte concentrate.17 Alkan et al. reported employing the dry digesting procedure for red mud and EAF-treated slag. Red mud was exposed to various concentrations of H2SO4 to enhance the selectivity of REEs and hence leaching efficiency. After the EAF-treated slag and red mud were exposed to strong acid, water leaching was performed to achieve REEs with high purity in leach liquor.18 Borra et al. investigated alkali roasting, smelting and acid leaching procedures for the recovery of REEs as alternatives to strong acid treatments. Following acid leaching at 25 °C, about 80% of REEs were recovered in this study.19 Similarly, acid baking methods and alkali treatments have been employed to recover REEs from a NdFeB magnet. With the aim of recovering REEs from NdFeB magnets, Önal et al. investigated sulfatation, followed by selective roasting and water leaching. Eventually, 98% of the REEs were recovered by the proposing method.20 Furthermore, in a later study by Önal et al., NdFeB magnet powders were subjected to HNO3 as an alternative to H2SO4, and were heated at 200 °C to form goethite and hematite. In this study, REEs with a purity of 98% were recovered by nitration followed by water leaching.21
Most procedures recommended in the literature separate and produce metals after the leaching has been obtained by employing conventional precipitation agents. Han et al., for example, investigated the behavior of REEs' precipitation with various agents, such as phosphate, oxalate, fluoride, carbonate and sulfate using thermodynamic principle.22 Silva et al. investigated RE oxides' precipitation in purified rare earth solution with sodium carbonate and oxalic acid. While they recovered RE oxides with a purity of 94.2% of RE oxides using sodium carbonate, RE oxides with a purity of 99.2% were recovered by oxalic acid.23 Particularly, the hydrometallurgical methods are based on strong mineral acid, an oxidation agent for iron and precipitation agent use. During these multi-stage processes, a large amount of chemical agents was used and a large amount of REEs was lost. In the production process of RE oxides from leach liquor, precipitation agents such as oxalic acid, ammonium, sodium hydroxide, sodium sulfate, and hydrogen fluoride were employed. However, these agents were found problematic, for example, HF was claimed to cause difficulties on filtration of NdF3 and it lead to iron contamination in the precipitate.24,25 In addition, oxalate precipitation is an expensive method due to the cost of oxalic acid.26 On the other hand, double salt precipitation is simple and cheap, where the pH of the leach solution is increased by the addition of the ammonium/sodium hydroxide/sodium sulfate reagents. However, in this method, Nd and Fe can be precipitated together.24,27 Moreover, sodium hydroxide, sodium sulfate, and calcium carbonate might cause impurity in the end product. It is worth mentioning that the consumed precipitation agents in the solution are not easily recyclable. The solution should be treated for purification because it contains Fe, REEs, Co, and B. To unravel the abovementioned problems, this work addresses this issue by implementing a solution combustion method for production of RE oxides. In contrast to the conventional precipitation methods, these methods don't include the filtration step and precipitation step, and RE oxides with high purity can be produced in one step via the solution combustion. Moreover, this method is capable of the production of metal oxide with controllable morphology by manipulating fuel types and the amount parameters. In our previous study, RE oxides with spherical morphology was produced by an ultrasonic spray pyrolysis technique as an alternative to conventional precipitation method.28 To the best of our knowledge, no research has been focused on the production of mixed RE oxides from leach liquor via solution combustion. Most research has focused on metal oxides produced by corresponding metal nitrates and/or nitric acids as oxidants and citric acid and glycine as fuels. Chavan et al. employed the solution combustion method to synthesize Nd2O3 and Ce0.50Nd0.50O1.75 with glycine as a fuel and corresponding metal nitrates. Following the production process, the characterization studies were conducted with XRD and SEM analyses. XRD analysis revealed C-type cubic phase Nd2O3.29 In another study, ((La, Sm, Dy, Er, RE)2O3) with various compositions were produced by solution combustion. Afterward, the burnt powder was annealed at 800 °C to obtain a crystalline structure of Re oxides. According to the conducted characterization studies, all produced powders had a C-type bixbyite structure.30
In the present study, we propose a sustainable alternative to conventional precipitation methods that produce RE oxides from REEs-rich leach liquor by solution combustion. This study aims to investigate the conditions required to yield a complex of REEs without using precipitation agents. A literature review reveals that this information is currently not reported for the production of RE oxides using leach liquor. Advantages of the proposed method are that it can be carried out in a short time and saves in external energy consumption and uses a simple experimental setup. In addition to these advantages, a time-consuming filtration step is not part of this process. The proposed route promotes enhancing the circular economy of critical raw materials/REEs. Moreover, it provides a high potential to increase resource efficiency for spent NdFeB magnets.
Materials and methods
Materials, analytical methods and characterization
Scrap NdFeB magnets were supplied in bulk form. A demagnetization process was not necessary for the magnets. NdFeB magnet pieces were crushed by a jaw crusher (Retsch BB 50) in three times to obtain a suitable powder size. Acetic acid and citric acid were supplied from Sigma-Aldrich. Acetic acid and citric acid were used as fuels in solution combustion. Nitric acid (HNO3, 65%) purchased from VWR International GmbH was utilized for the treatment of the magnet powders. Elemental composition of NdFeB magnet powders was determined by X-ray fluorescence (XRF) spectroscopy analysis (Panalytical WDXRF spectrometer (Malvern Panalytical B.V., Eindhoven, The Netherlands)) and ICP-OES analysis (SPECTRO ARCOS, SPECTRO Analytical Instruments GmbH, Kleve, Germany). The particle size distribution and particle size of the pre-treated powders were obtained by dynamic particle analyzer (SympaTech QuickPick Oasis with an M5 lens). Differential thermal analysis and thermogravimetric analysis (DTA-TG) (Netzsch STA 409, Selb, Germany) of the gel powders were performed using alumina crucible. The physical and chemical conversion of the gel product was determined with this analysis. Scanning electron microscopy (Zeiss Gemini 500) was used to reveal the morphology of NdFeB powders and RE oxides powders produced by solution combustion. The phases and crystallographic structure of RE oxides, the pre-treated magnet powders, and NdFeB powders were determined by X-ray diffraction analysis (Bruker D8 Advance with LynxEye detector). Fourier-transform infrared (FT-IR) spectroscopy (Bruker Alpha T) analyses of the gel powders and the powders calcined at different calcination temperatures were carried out between 4000–400 cm−1.Methodology for acid baking and ultrasonic-assisted selective leaching designed by Taguchi method
Acid baking process was employed with HNO3 (65%) with a 1![[thin space (1/6-em)]](https://www.rsc.org/images/entities/char_2009.gif) :
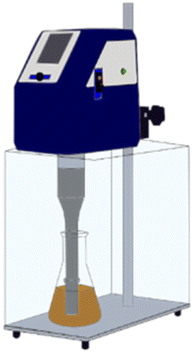
:![[thin space (1/6-em)]](https://www.rsc.org/images/entities/char_2009.gif) 5 solid/liquid (S/L) ratio. Some water is added to magnet powders to promote ionization before exposing magnet powder to nitric acid. After acid exposure, the mixture waited 1 hour in a hood followed by the mixture was calcined at 200 °C for 2 hours. Theoretical background of acid baking with nitric acid was reported elsewhere.21 All ultrasonic-assisted leaching experiments were performed in a glass beaker of 200 ml volume using ultrasonic homogenizer (Hielscher, UP400St). Fig. 1 represents the experimental setup for ultrasonic-assisted water leaching.
5 solid/liquid (S/L) ratio. Some water is added to magnet powders to promote ionization before exposing magnet powder to nitric acid. After acid exposure, the mixture waited 1 hour in a hood followed by the mixture was calcined at 200 °C for 2 hours. Theoretical background of acid baking with nitric acid was reported elsewhere.21 All ultrasonic-assisted leaching experiments were performed in a glass beaker of 200 ml volume using ultrasonic homogenizer (Hielscher, UP400St). Fig. 1 represents the experimental setup for ultrasonic-assisted water leaching.
Nine experiments were designed via Taguchi orthogonal array method for the optimization of ultrasonic-assisted leaching experiments. Leaching experiments were performed with three parameters with three levels. Solid/liquid ratio was adjusted in three levels of 1![[thin space (1/6-em)]](https://www.rsc.org/images/entities/char_2009.gif) :
:![[thin space (1/6-em)]](https://www.rsc.org/images/entities/char_2009.gif) 15, 1
15, 1![[thin space (1/6-em)]](https://www.rsc.org/images/entities/char_2009.gif) :
:![[thin space (1/6-em)]](https://www.rsc.org/images/entities/char_2009.gif) 30 and 1
30 and 1![[thin space (1/6-em)]](https://www.rsc.org/images/entities/char_2009.gif) :
:![[thin space (1/6-em)]](https://www.rsc.org/images/entities/char_2009.gif) 45, ultrasound power in three levels of 60, 90 and 120 W and leaching time in three levels of 1, 5, 10 min. The mixture was filtered by vacuum filtration system to obtain pregnant leach liquor. Ultrasonic-assisted leaching experimental parameters and their levels can be found Table 1. Afterwards, Taguchi and analysis of variance (ANOVA) analyses were conducted to define the optimal process conditions. To achieve maximum leaching efficiency with minimum leaching time, an additional control experiment was conducted with the specified parameters. The contents of REEs and Fe in the leach liquor were determined by ICP-OES.
45, ultrasound power in three levels of 60, 90 and 120 W and leaching time in three levels of 1, 5, 10 min. The mixture was filtered by vacuum filtration system to obtain pregnant leach liquor. Ultrasonic-assisted leaching experimental parameters and their levels can be found Table 1. Afterwards, Taguchi and analysis of variance (ANOVA) analyses were conducted to define the optimal process conditions. To achieve maximum leaching efficiency with minimum leaching time, an additional control experiment was conducted with the specified parameters. The contents of REEs and Fe in the leach liquor were determined by ICP-OES.
| Parameters | Levels | ||
|---|---|---|---|
| −1 | 0 | 1 | |
Solid![[thin space (1/6-em)]](https://www.rsc.org/images/entities/char_2009.gif) : :![[thin space (1/6-em)]](https://www.rsc.org/images/entities/char_2009.gif) liquid ratio liquid ratio |
1/15 | 1/30 | 1/45 |
| Ultrasound power | 60 | 90 | 120 |
| Leaching time | 1 | 5 | 10 |
Experimental methodology for production of RE oxides by solution combustion
RE oxides were produced by solution combustion method from leach liquor with citric acid and acetic acid as fuels. First, the leach liquor was stirred, proper amounts of citric acid or acetic acid as fuels were added in leach liquor. The amounts of citric acid and acetic acid were calculated according to the followed eqn (1) and (2), respectively. Fuels with appropriate ϕ ratios were added to leach liquor to initiate solution combustion.| 2Nd(NO3)3 + 1.667C6H8O7 = Nd2O3 + 3N2 + 10CO2 + 6.667H2O | (1) |
| 2Nd(NO3)3 + 3.75C2H4O2 = Nd2O3 + 3N2 + 7.5CO2 + 7.5H2O | (2) |
The effects of the fuel to oxidizer (ϕ) ratios, i.e., stoichiometric (ϕ = 1), fuel lean (ϕ < 1) and fuel rich (ϕ > 1) on properties of RE oxides were investigated. The fuel to oxidizer (ϕ) ratios were ϕ = 0.5, ϕ = 1.0 and ϕ = 2.0 for fuel-lean, stoichiometric and fuel-rich, respectively. The amount of oxidizer was calculated by the amount of REEs in the leach liquor determined by ICP analysis. Table 2 illustrates the experimental parameters for solution combustion.
| Experiment | Fuel species | Fuel ratio (ϕ) | Calcination |
|---|---|---|---|
| SC1 | Citric acid | 0.5 | — |
| SC2 | Citric acid | 0.5 | 800 °C |
| SC3 | Citric acid | 1 | 800 °C |
| SC4 | Citric acid | 2 | 800 °C |
| SC5 | Citric acid | 0.5 | 700 °C |
| SC6 | Citric acid | 0.5 | 600 °C |
| SC7 | Acetic acid | 0.5 | — |
| SC8 | Acetic acid | 0.5 | 600 °C |
| SC9 | Acetic acid | 0.5 | 800 °C |
The leach liquor was continuously stirred and heated for 1 hour on a magnetic stirrer at approximately 100 °C. Then the formation of viscous gel was observed subsequently the gel was ignited by further heating up by a magnetic stirrer. After the ignition of the gel powders, the burned powders formed. Fig. 2 shows the schematic representation of solution combustion method for production of RE oxides.
These burned powders were annealed at various calcination temperatures in a muffle furnace under an ambient atmosphere. During the heat treatment process, the crystalline phase of RE oxides formed.
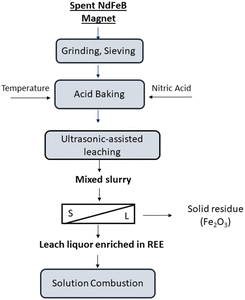
Fig. 3 illustrates the proposed experimental flowsheet for production of RE oxides.
Results and discussion
Characterization of scrap-NdFeB magnets
The composition of NdFeB magnet powder was determined using X-ray fluorescence analysis. Table 3 shows the phase composition of NdFeB magnet powder. The presence of Fe, Nd and Pr, as well as small amounts of Tb, Al, Si, Co, Mn, and Pd was detected with XRF analysis.| Component | Na2O | Al2O3 | SiO2 | MnO | Fe2O3 |
| Concentration (%) | 0.34 | 0.42 | 0.24 | 1.97 | 68.1 |
| Component | Co3O4 | CuO | Ga2O3 | As2O3 | Nb2O5 |
| Concentration (%) | 0.70 | 0.14 | 0.20 | 0.21 | 0.12 |
| Component | PdO | Pr2O3 | Nd2O3 | Tb4O7 | Other |
| Concentration (%) | 0.24 | 5.72 | 20.4 | 0.70 | 0.50 |
Table 4 shows the result of ICP-OES analysis of NdFeB magnet′ powders in a solution.
| Composition | B | Co | Cr | Cu | Dy |
| Concentration (ppm) | 278 | 245 | <1 | 32.6 | 210 |
| Composition | Fe | Mo | Nd | Ni | Pr |
| Concentration (ppm) | 21![[thin space (1/6-em)]](https://www.rsc.org/images/entities/char_2009.gif) 000 000 |
<1 | 7580 | <1 | 2340 |
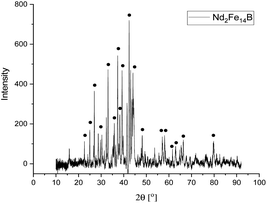
The presence of Fe, Nd and Pr, as well as small amounts of Cu, B, Co, Dy, was detected with ICP analysis. The results matched those obtained by XRF analysis. The phase analysis of NdFeB magnet powder were performed by (XRD) analysis. Fig. 4 depicts the XRD pattern of the magnet powders.
The XRD peaks in the pattern of NdFeB magnet powders correspond to tetragonal structure Nd2Fe14B with the space group of P42/mnm (JCPDS #40-1028).
Characterization of the pre-treated NdFeB powder
After the magnet powders were exposed to nitric acid, they were calcined considering the thermal decomposition behavior of iron and REEs. The thermal decomposition of REE nitrates and iron nitrates were proposed as follows by researchers;31–33| REE(NO3)3·6H2O → REE(NO3)3 → REEONO3 → R2O3 | (3) |
| Fe(NO3)3·9H2O → Fe(OH)(NO3)2·2H2O + HNO3↑ + 6H2O↑ | (4) |
| Fe(OH)(NO3)2·2H2O → Fe(OH)2NO3 + HNO3↑ + H2O↑ | (5) |
| Fe(OH)2NO3 → FeOOH + HNO3↑ | (6) |
| FeOOH → Fe2O3 + H2O↑ | (7) |
Nd(NO3)3, Pr(NO3)3 and Dy(NO3)3 decompose within the 290–380 °C, 300–375 °C, 260–280 °C range, respectively, which is higher than the temperature ranges for iron nitrate. Different thermal behavior of iron nitrates and REEs nitrates allows the selectively leaching of REEs. After the magnet powders exposed to nitric acid, they were calcined at 200 °C for 2 hours taking into account thermal decomposition of REE nitrate and iron nitrate to oxides. The pre-treated powders calcined at 200 °C were characterized by various analyses.
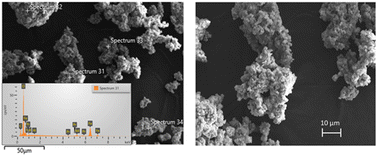
The morphology and size of the pre-treated powder were revealed by Scanning Electron Microscopy (SEM). Fig. 5 shows the SEM micrographs of the pre-treated powders.
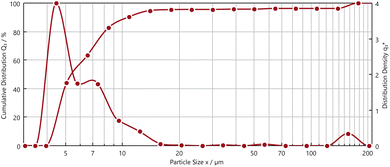
The pre-treated powder by nitric acid had non-uniform morphology with narrow size distribution. The presence of Fe, Nd, and Pr were observed with EDS analysis. Fig. 6 illustrates dynamic particle analysis of the pre-treated powders.
Fig. 6 shows the cumulative distribution (Q3) and the distribution density (q3*) of the pre-treated powders with diameter (EQPC)-value. d10.3, d50.3, d90.3 values are 4.19 μm, 5.51 μm and 10.76 μm, respectively. These results show that 90.3% of the pre-treated powder showed a size range of 2–18 μm with a global maximum at ∼4 μm.
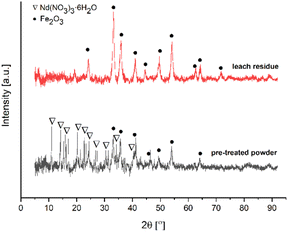
Fig. 7 depicts the XRD pattern of the pre-treated powders and leach residue obtained by ultrasound-assisted water leaching for 1 minute.
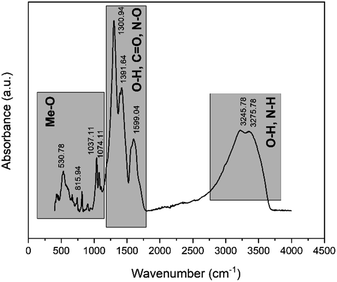
XRD peaks in the pattern of leach residue belong to Fe2O3 (card no. 01-079-1741). The pre-treated powders pattern revealed that peaks originate from Nd(NO3)3·6H2O (card no. 030-0858) and Fe2O3 as expected. Fig. 8 shows the FTIR spectrum of the pre-treated powders calcined at 200 °C for 2 hours.
The broad absorbance peak in the range of 3000 and 3600 cm−1 was attributed the hydrated water within the RE-nitrates. The peak about 3200 cm−1 corresponded to the presence of N–H bonding due to the RE-nitrate in the calcine. The peaks appeared at about 1391 cm−1 corresponded to the antisymmetric stretching mode of NO3−. The absorption bands at approximately at 1300 cm−1 and 1590 cm−1 were attributed to the C–O bonding which is arisen from the adsorbed atmospheric carbon dioxide. The wavelength ranges within the 1074 and 530 cm−1 corresponded to the Me–O bonds.
Taguchi analysis of ultrasound-assisted water leaching process and statistical analysis
The three-level L9 orthogonal array was employed to optimize the leaching efficiency of iron and REEs. Table 6 gives the ultrasonic-assisted leaching parameters, the level of experiments and chemical analysis results determined by ICP analysis. The S/N ratios for REEs and Fe were calculated with eqn (8) (larger is better) and eqn (9) (smaller is better), respectively. Table 1 presents the S/N ratio values for each experiment.
 | (8) |
 | (9) |
| Experiment | Solid/liquid | Power (W) | Time (min) | ICP [Fe] (mg L−1) | S/N for Fe (db) | Extract [REEs] (mg L−1) | S/N for Fe (db) |
|---|---|---|---|---|---|---|---|
| 1 | 1![[thin space (1/6-em)]](https://www.rsc.org/images/entities/char_2009.gif) : :![[thin space (1/6-em)]](https://www.rsc.org/images/entities/char_2009.gif) 15 15 |
60 | 1 | <1 | 20 | 740 | 57.38 |
| 2 | 1![[thin space (1/6-em)]](https://www.rsc.org/images/entities/char_2009.gif) : :![[thin space (1/6-em)]](https://www.rsc.org/images/entities/char_2009.gif) 15 15 |
90 | 5 | 530 | −54.48 | 700 | 56.90 |
| 3 | 1![[thin space (1/6-em)]](https://www.rsc.org/images/entities/char_2009.gif) : :![[thin space (1/6-em)]](https://www.rsc.org/images/entities/char_2009.gif) 15 15 |
120 | 10 | 450 | −53.06 | 810 | 58.16 |
| 4 | 1![[thin space (1/6-em)]](https://www.rsc.org/images/entities/char_2009.gif) : :![[thin space (1/6-em)]](https://www.rsc.org/images/entities/char_2009.gif) 30 30 |
60 | 5 | <1 | 18.41 | 368 | 51.31 |
| 5 | 1![[thin space (1/6-em)]](https://www.rsc.org/images/entities/char_2009.gif) : :![[thin space (1/6-em)]](https://www.rsc.org/images/entities/char_2009.gif) 30 30 |
90 | 10 | <1 | 15.39 | 405 | 52.14 |
| 6 | 1![[thin space (1/6-em)]](https://www.rsc.org/images/entities/char_2009.gif) : :![[thin space (1/6-em)]](https://www.rsc.org/images/entities/char_2009.gif) 30 30 |
120 | 1 | <1 | 17.72 | 356 | 51.02 |
| 7 | 1![[thin space (1/6-em)]](https://www.rsc.org/images/entities/char_2009.gif) : :![[thin space (1/6-em)]](https://www.rsc.org/images/entities/char_2009.gif) 45 45 |
60 | 10 | <1 | 16.47 | 263 | 48.39 |
| 8 | 1![[thin space (1/6-em)]](https://www.rsc.org/images/entities/char_2009.gif) : :![[thin space (1/6-em)]](https://www.rsc.org/images/entities/char_2009.gif) 45 45 |
90 | 1 | <1 | 15.39 | 262 | 48.36 |
| 9 | 1![[thin space (1/6-em)]](https://www.rsc.org/images/entities/char_2009.gif) : :![[thin space (1/6-em)]](https://www.rsc.org/images/entities/char_2009.gif) 45 45 |
120 | 5 | <1 | 19.17 | 265 | 48.46 |
ANOVA analysis was used for determining the contribution of each process parameter. Sum square (SS) values, square (MS) and F value for the extraction of REEs and iron are tabulated in Tables 6 and 7, respectively.
| Parameter | DoF | SS | MS | F-Value |
|---|---|---|---|---|
Solid![[thin space (1/6-em)]](https://www.rsc.org/images/entities/char_2009.gif) : :![[thin space (1/6-em)]](https://www.rsc.org/images/entities/char_2009.gif) liquid ratio liquid ratio |
2 | 127.746 | 63.873 | 0.0044 |
| Power | 2 | 0.053 | 0.0265 | 0.9147 |
| Time | 2 | 0.878 | 0.4391 | 0.3933 |
| Error | 2 | 0.569 | 0.2847 | |
| Total | 8 | 129.247 |
| Parameter | DoF | SS | MS | F-Value |
|---|---|---|---|---|
Solid![[thin space (1/6-em)]](https://www.rsc.org/images/entities/char_2009.gif) : :![[thin space (1/6-em)]](https://www.rsc.org/images/entities/char_2009.gif) liquid ratio liquid ratio |
2 | 4283.39 | 2141.69 | 0.2228 |
| Power | 2 | 1253.86 | 626.93 | 0.4948 |
| Time | 2 | 1160.15 | 580.07 | 0.5142 |
| Error | 2 | 1228.1 | 614.05 | |
| Total | 8 | 7925.49 |
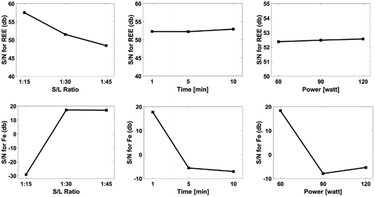
F-Value illustrates the effect of ultrasound-assisted leaching parameters on leaching efficiency. Statistical analysis revealed that, solid/liquid ratio was important parameter for the leaching efficiency of REEs. Fig. 9 exhibits the effect of the ultrasound assisted leaching parameters on the optimization criteria for both REEs and iron extraction.
The S/N plot shows overall relative importance of the factors of ultrasound-assisted leaching. The influence of experimental parameters including leaching time, ultrasound power and solid/liquid ratio were important on extraction of REEs and iron. In particular, solid/liquid ratio was the most important parameter for the maximum extraction of REEs. As a result of the S/N plots, solid/liquid ratio of 1/15, ultrasound power of 60 W and leaching time of 1 minute were the optimal process parameters for the maximum REEs extraction.
Solid/liquid ratio of 1/45, ultrasound power of 60 W and leaching time of 1 minute were the optimal process parameters for the minimum iron extraction. It is noteworthy mentioning that at a 1/15 of solid/liquid ratio and prolonged leaching time, iron extraction was observed due to higher interaction of the pre-treated powders and water. An increment in the interaction causes an increase in the leaching temperature. This increase allows iron to dissolve. If a higher solid/liquid ratio were chosen, iron could be dissolved even in short periods. Therefore, a solid/liquid ratio of 1/15 is the ideal leaching parameter. A validation experiment was performed at a 1![[thin space (1/6-em)]](https://www.rsc.org/images/entities/char_2009.gif) :
:![[thin space (1/6-em)]](https://www.rsc.org/images/entities/char_2009.gif) 15 of solid/liquid ratio with 60 W of ultrasound power for 1 minute.
15 of solid/liquid ratio with 60 W of ultrasound power for 1 minute.
After the validation experiment, the leach residue was characterized by XRF analysis. Table 8 illustrates XRF analysis of the leach residue from validation experiment.
| Component | Na2O | Al2O3 | SiO2 | MnO | Fe2O3 | MgO | K2O |
| Concentration (%) | 0.34 | 2.18 | 0.88 | 0.066 | 85.7 | 0.23 | 0.11 |
| Component | Co3O4 | CuO | PdO | Pr2O3 | Nd2O3 | P2O3 | Other |
| Concentration (%) | 0.77 | 0.11 | 0.24 | 0.14 | 0.64 | 0.25 | 6.99 |
The presence of a small amount of Nd and Pr was detected by chemical analysis. Table 9 shows the chemical analysis result determined by ICP analysis.
| Composition | B | Co | Nd | Pr | Dy |
| Concentration (mg L−1) | 80 | 30 | 4580 | 1300 | 100 |
REEs with 98.5% of purity in the leach liquor was achieved after the ultrasound-assisted water leaching process. It is worth mentioning that iron dissolution was not observed for 1 minute.
Characterization of RE oxides produced by solution combustion
Citric acid and acetic acid were used with different amounts of fuel in the RE oxides production process to evaluate the effect of fuel type and fuel amount on combustion behavior. Fig. 10 depicts RE oxides produced with the different amount of fuel by solution combustion.DTA-TG analysis was employed to define the thermal decomposition of the dry gel produced by the nitrate and citric acid. Fig. 11 shows the dry gel produced with citric acid as fuel under air atmosphere at a heating rate of 10 °C min−1.
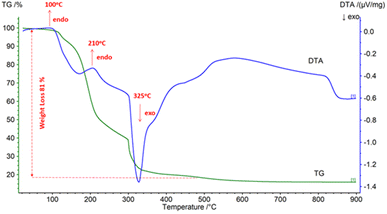 | ||
| Fig. 11 DTA-TG analysis of the dry gel produced with citric acid as fuel under air atmosphere at a heating rate of 10 °C min−1. | ||
DTA-TG analysis showed the ignition temperature of the dry gel and revealed the phase transformation of the gel powders.
Fig. 11 shows two endothermic transitions at 110 °C and 210 °C, and one exothermic transition at 325 °C. The first weight loss on the TG curve was attributed to the removal of the absorbed water. At approximately 100 °C and 210 °C, small endothermic peaks were observed, which were ascribed to the loss of physical and crystal water, respectively.
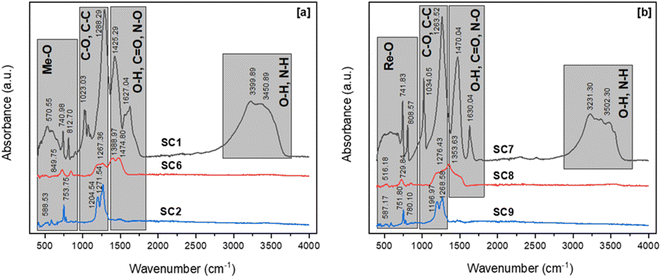
During the combustion process (eqn (1)), the reaction of citric acid with nitric acid was followed by the emission of gaseous oxidation products such as CO2, H2O, and N2, resulting in a main mass loss in the temperature range of 110 °C to 325 °C. The combustion reaction of the gel produced with citric acid was associated with the intense exothermic peak at 325 °C. The straight line on the TG curve between 500 °C and 900 °C shows the formation of RE oxides with no further weight loss. Fig. 12 illustrates the FTIR spectra of dry-gel powders and the powders calcined at 600 °C and 800 °C.
The dry gels produced by the combustion process, which used citric acid and acetic acid as fuels, had nearly identical bands in the FTIR spectra. The broad bands in the two FTIR spectra in the regions of 3600 cm−1 and 3000 cm−1 represent the symmetrical vibration of N–H and O–H bonds, respectively. The bands in the 1600–1200 cm−1 range can be attributed to C![[double bond, length as m-dash]](https://www.rsc.org/images/entities/char_e001.gif) O, N–O, and O–H. C–O, and C–C absorption peaks were identified in the range of 1000 to 1200 cm−1, proving the presence of carboxyl groups in the dry-gel powders. Furthermore, the peaks at approximately 1600 cm−1 were associated with O–H flexural vibration bonds.
O, N–O, and O–H. C–O, and C–C absorption peaks were identified in the range of 1000 to 1200 cm−1, proving the presence of carboxyl groups in the dry-gel powders. Furthermore, the peaks at approximately 1600 cm−1 were associated with O–H flexural vibration bonds.
The characteristic peak of the antisymmetric stretching mode of NO3− was observed at approximately 1380 cm−1 in the FTIR spectra of the powders calcined at 600 °C. Furthermore, the loss of this band in the FTIR spectra of the powders calcined at 800 °C indicated the formation of RE oxides crystals. Because of the presence of C–C bonding in the samples, the spectra of the powders calcined at 800 °C revealed peaks at 1204 cm−1 and 1271 cm−1. Minor quantities of fuel residue were seen in the samples calcined at 800 °C, despite the heat treatment process. In all samples, absorption peaks associated with REEs-O and REEs-O-REEs stretching vibrations were observed at about 580, 750, and 780 cm−1. The calcination temperature of RE oxides was determined by XRD, and Fig. 13 illustrates the XRD patterns of RE oxides calcined at different calcination temperatures.
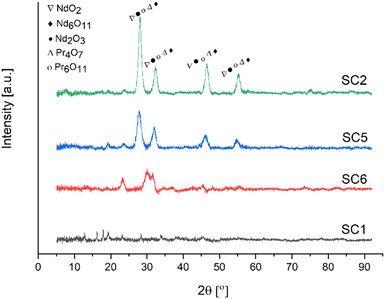 | ||
| Fig. 13 XRD analysis of RE oxides calcined at different temperatures [SC1/RT], [SC6/600 °C], [SC5/700 °C], [SC2/800 °C]. | ||
The dry gels produced by the combustion process, which used citric acid and acetic acid as fuels, had nearly identical bands in the FTIR spectra. The broad bands in the two FTIR spectra in the regions of 3600 cm−1 and 3000 cm−1 represent the symmetrical vibration of N–H and O–H bonds, respectively. The bands in the 1600–1200 cm−1 range can be attributed to C![[double bond, length as m-dash]](https://www.rsc.org/images/entities/char_e001.gif) O, N–O, and O–H. C–O, and C–C absorption peaks were identified in the range of 1000 to 1200 cm−1, proving the presence of carboxyl groups in the dry-gel powders. Furthermore, the peaks at approximately 1600 cm−1 were associated with O–H flexural vibration bonds.
O, N–O, and O–H. C–O, and C–C absorption peaks were identified in the range of 1000 to 1200 cm−1, proving the presence of carboxyl groups in the dry-gel powders. Furthermore, the peaks at approximately 1600 cm−1 were associated with O–H flexural vibration bonds.
The characteristic peak of the antisymmetric stretching mode of NO3− was observed at approximately 1380 cm−1 in the FTIR spectra of the powders calcined at 600 °C. Furthermore, the loss of this band in the FTIR spectra of the powders calcined at 800 °C indicated the formation of RE oxides crystals. Because of the presence of C–C bonding in the samples, the spectra of the powders calcined at 800 °C revealed peaks at 1204 cm−1 and 1271 cm−1. Minor quantities of fuel residue were seen in the samples calcined at 800 °C, despite the heat treatment process. In all samples, absorption peaks associated with REEs-O and REEs-O-REEs stretching vibrations were observed at about 580, 750, and 780 cm−1. The calcination temperature of RE oxides was determined by XRD, and Fig. 13 illustrates the XRD patterns of RE oxides calcined at different calcination temperatures.
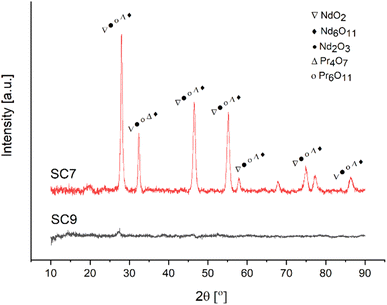
Fig. 13 represents the XRD patterns of RE oxides samples calcined at temperatures ranging from 600 to 800 °C. These RE oxides samples were produced with a fuel ratio of 0.5. All samples had NdO2, Nd6O11, Nd2O3, Pr4O7 and Pr6O11 phases in the XRD patterns. These RE-oxides patterns were consistent with standards JCPDF 46-1074, JCPDF 45-0087, JCPDF 21-0579, JCPDF 03-065-6027, and JCPDF 42-1121, respectively. The XRD patterns of the sample calcined at 600 °C displayed very low intensity peaks of NdO2, Nd6O11, Nd2O3, Pr4O7 and Pr6O11 because of the incomplete thermal decomposition of the nitrate medium. However, the samples calcined at 700 and 800 °C showed sharper peaks, indicating that RE oxides have a higher degree of crystallinity. The formation of crystalline RE oxides occurs as the calcination temperature increases.
Fig. 14 exhibits the XRD pattern of RE oxides produced as a function of fuel ratio from 0.5 to 2 ϕ at 800 °C.
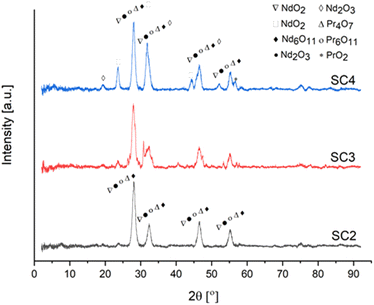 | ||
| Fig. 14 XRD analysis of RE oxides produced at various fuel ratios [SC2/ϕ = 0.5], [SC3/ϕ = 1], [SC4/ϕ = 2]. | ||
The change in fuel ratio from 0.5 to 2 resulted in the formation of different crystal structures of RE oxides. The increased fuel ratio may result in a non-uniform distribution of combustion flame temperature. Because of this non-uniform behavior, different RE oxides with different formation energies form. The XRD patterns of NdO2, Nd2O3, and PrO2 were compatible with JCPDF 89-0510, JCPDF 89-0671, and JCPDF 03-065-0325.
XRD analysis was performed to elucidate the effect of the fuel type on the RE oxides formation mechanism. Fig. 15 depicts the XRD patterns of samples produced with acetic acid as fuel.
Similar to the powders produced by citric acid, NdO2, Nd6O11, Nd2O3, Pr4O7 and Pr6O11 were observed in the sample produced by acetic acid as fuel.
Fig. 16 exhibits FESEM micrographs and EDS analysis of RE oxides powders at 700 °C and 800 °C. EDS analysis revealed the presence of Nd, Pr, Dy, and Tb in the samples. Because of the liberation of exhausted gases (CO2, H2O, N2) and the high combustion temperature, the powder calcined at 700 and 800 °C had macro-porous and sponge-shaped agglomerates. Furthermore, voids and primary particles can be observed in samples calcined at 700 °C and 800 °C.
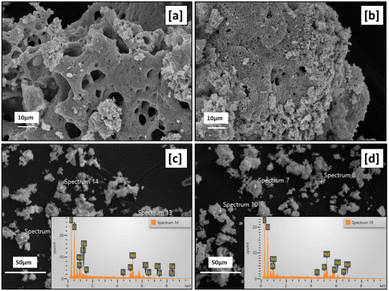 | ||
| Fig. 16 SEM micrographs and EDS analysis of samples labeled [a] SC5, [b] SC2 with magnification 10k×, [c] SC5, [d] SC5 with magnification 500×. | ||
Fig. 17 presents the SEM micrographs ([a]–[c]) of RE oxides produced with various fuel-to-oxidizer ratios. The morphology of RE oxides produced with acetic acid as fuel is illustrated in the SEM micrograph encoded with [d].
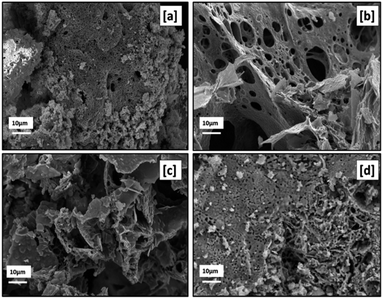 | ||
| Fig. 17 SEM micrographs of samples labeled [a] SC2, [b] SC3, [c] SC4, [d] SC8 with 10k× magnification. | ||
The morphology of particles produced by solution combustion was influenced by the gas formation during the calcination and combustion process, the heat released during the combustion process, and the type of fuel used. Furthermore, RE oxides produced by solution combustion had a sponge-like shape and a high specific surface area. It's also worth noting that RE oxides were extremely agglomerated. As can be seen in Fig. 17, all samples produced with different fuel-to-oxidizer ratios had voids and micro- and macro-pores.
Furthermore, non-uniform shape and size of the powders were ascribed to the non-uniform distribution of the combustion flame's temperature and mass flow. The formation of irregular flake-shaped particles was observed when the higher fuel-to-oxidizer ratio was used. As seen in Fig. 17[a] and 14[d], the fine primary particles were observed in powders prepared by citric acid and acetic acid as fuels.
When compared to SEM micrographs in Fig. 17, the amount of macro-porosity in the produced powders increased with the rise in the fuel-to-oxidizer ratio from 0.5 ϕ to 1 ϕ. However, the increase in fuel-to-oxidizer ratio from 1 ϕ to 2 ϕ results in the formation of aggregated powders due to the extreme reaction temperature with a higher amount of fuel, as reported elsewhere.34,35
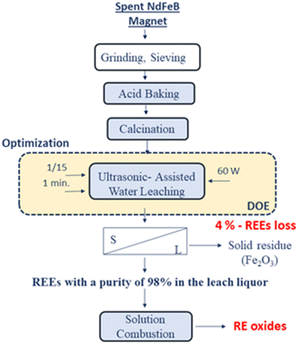
Fig. 18 represents the proposed flowchart for the ultrasound-assisted water leaching and the production of RE oxides by solution combustion.
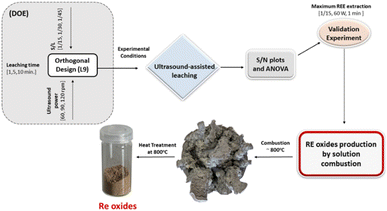 | ||
| Fig. 18 The proposed flowchart for the ultrasound-assisted water leaching and the production of RE oxides by solution combustion. | ||
In this study, a flowsheet is proposed for unraveling the problems in the conventional precipitation methods. Fig. 19 illustrates the proposed conceptual flowsheet for REEs recovery from spent NdFeB magnets.
Conclusion
The impact of hazardous waste and radioactive lakes on the production of REEs from primary sources has prompted more research into REEs recovery from secondary sources. In this study, solution combustion was proposed for the production of RE oxides from secondary sources with the aim of reducing the environmental impact of RE oxides produced from primary sources. Several remarkable findings of this chapter can be summarized as follows.NdFeB powders were subjected to nitric acid (65%). Subsequently, the powders were calcined at 200 °C taking into account the difference between the thermal decomposition behavior of REE nitrates and iron nitrate. On the basis of the Taguchi design, the leaching experiments were conducted to identify optimal ultrasonic-assisted water leaching parameters.
The validation experiments were carried out with the optimal process parameters (solid/liquid ratio of 1/15, ultrasonic power of 60 W, and leaching period of 1 minute), as determined by findings of the S/N plot and ANOVA analysis. The statistical analyses revealed that the solid/liquid ratio was the most important parameter for maximum REEs extraction. RE oxides were produced by one-step solution combustion from the leach liquor obtained by the validation experiments. RE oxides with macro/micro-pores morphology might be suggested as functional materials for usage. Moreover, RE oxides produced by solution combustion can be used as an initial raw material for the production of REEs by molten salt electrolysis.
RE oxides powders were produced without precipitation agents by solution combustion for the first time. Thus, the reduction of the consumption of chemicals was achieved. Moreover, the time-consuming filtration step is not part of the abovementioned method. Therefore, solution combustion method might be an alternative to conventional production method.
Author contributions
Conceptualization: E. E. K., data curation: E. E. K, formal analysis: E. E. K., funding acquisition: S.·S., S. G., B.·F., investigation: E. E. K., methodology: E. E. K., project administration: S.·S., S. G., B.·F., resources: S.·S., S. G., B.·F., supervision: S. G. and B.·F., validation: E. E. K, writing – original draft: E. E. K, writing – review & editing: S.·S., S. G., B.·F.Conflicts of interest
There are no conflicts to declare.Acknowledgements
This research was funded by the Federal Ministry for Economic Affairs and Climate Action, grant number 273 EN, and The Scientific of Technological Research Council of Turkey under grant agreement 120N331. The APC was funded by the project “Sustainable recovery of rare earth elements (Nd, Pr, Dy) from spent magnets”. Elif Emil-Kaya would like to thank TUBITAK 2214-A – International Research Fellowship Programme for PhD Students.References
- K. T. Rim, J. Toxicol. Environ. Health Sci., 2016, 8, 189–200 CrossRef.
- E. Lewicka, K. Guzik and K. Galos, Resources, 2021, 10, 50 CrossRef.
- U. K. Mudali, M. Patil, R. Saravanabhavan and V. K. Saraswat, Int. J. Eng. Res. Technol, 2021, 1–19 Search PubMed.
- J. Wang, M. Guo, M. Liu and X. Wei, Resour. Policy, 2020, 65, 101569 CrossRef.
- Y. Zhang, F. Gu, Z. Su, S. Liu, C. Anderson and T. Jiang, Metals, 2020, 10, 841 CrossRef CAS.
- A. Y. Barkov, E. V. Sharkov, A. A. Nikiforov, V. N. Korolyuk, S. A. Silyanov and B. M. Lobastov, Geol. Geofiz., 2021, 62, 427–444 Search PubMed.
- S. L. Tay, J. M. Scott, M. C. Palmer, M. R. Reid and C. H. Stirling, N. Z. J. Geol. Geophys., 2021, 64, 89–106 CrossRef CAS.
- X. Du and T. E. Graedel, J. Ind. Ecol., 2011, 15, 836–843 CrossRef CAS.
- M. T. Thompson, Proc. IEEE, 2009, 97, 1758–1767 CAS.
- M. Honshima and K. Ohashi, J. Mater. Eng. Perform., 1994, 3, 218–222 CrossRef CAS.
- E. G. Polyakov and A. S. Sibilev, Metallurgist, 2015, 59, 368–373 CrossRef CAS.
- S. Stopic, B. Polat, H. Chung, E. Emil-Kaya, S. Smiljanić, S. Gürmen and B. Friedrich, Metals, 2022, 12, 1464 CrossRef CAS.
- Y. Yang, A. Walton, R. Sheridan, K. Güth, R. Gauß, O. Gutfleisch and K. Binnemans, J. Sustain. Metall., 2017, 3, 122–149 CrossRef.
- M. Honshima and K. Ohashi, J. Mater. Eng. Perform., 1994, 3, 218–222 CrossRef CAS.
- E. Uysal, S. Al, E. Emil-Kaya, S. Stopic, S. Gürmen and B. Friedrich, Can. Metall. Q., 2022, 1–12 Search PubMed.
- H. Chung, S. Stopic, E. Emil-Kaya, S. Gürmen and B. Friedrich, Metals, 2022, 12, 1615 CrossRef.
- Y. Ma, S. Stopic and B. Friedrich, Johnson Matthey Technol. Rev., 2019, 63, 2–13 CrossRef CAS.
- G. Alkan, B. Yagmurlu, L. Gronen, C. Dittrich, Y. Ma, S. Stopic and B. Friedrich, Hydrometallurgy, 2019, 185, 266–272 CrossRef CAS.
- C. R. Borra, B. Blanpain, Y. Pontikes, K. Binnemans and T. Van Gerven, J. Sustain. Metall., 2017, 3, 393–404 CrossRef.
- M. A. R. Önal, C. R. Borra, M. Guo, B. Blanpain and T. Van Gerven, J. Sustain. Metall., 2015, 1, 199–215 CrossRef.
- M. A. R. Önal, E. Aktan, C. R. Borra, B. Blanpain, T. Van Gerven and M. Guo, Hydrometallurgy, 2017, 167, 115–123 CrossRef.
- K. N. Han, Minerals, 2020, 10, 178 CrossRef CAS.
- R. G. Silva, C. A. Morais, L. V. Teixeira and E. D. Oliveira, Mining, Metall. Explor, 2019, 36, 967–977 Search PubMed.
- J. W. Lyman, and G. R. Palmer, Recycling of neodymium iron boron magnet scrap, US Department of the Interior, Bureau of Mines, Washington, DC, 1993 Search PubMed.
- B. Greenberg, US Pat., 5362459, U.S. Patent and Trademark Office, Washington, DC, 1994 Search PubMed.
- J. P. Rabatho, W. Tongamp, Y. akasaki, K. Haga and A. Shibayama, J. Mater. Cycles Waste Manag., 2013, 15, 171–178 CrossRef CAS.
- C. H. Lee, Y. J. Chen, C. H. Liao, S. R. Popuri, S. L. Tsai and C. E. Hung, Metall. Mater. Trans. A, 2013, 44, 5825–5833 CrossRef CAS.
- E. E. Kaya, O. Kaya, S. Stopic, S. Gürmen and B. Friedrich, Metals, 2021, 11, 716 CrossRef CAS.
- S. V. Chavan, P. U. M. Sastry and A. K. Tyagi, J. Alloys Compd., 2008, 456, 51–56 CrossRef CAS.
- S. V. Ushakov, S. Hayun, W. Gong and A. Navrotsky, Materials, 2020, 13, 3141 CrossRef CAS PubMed.
- W. W. Wendlandt, Anal. Chim. Acta, 1956, 15, 435–439 CrossRef CAS.
- K. H. Stern, High temperature properties and thermal decomposition of inorganic salts with oxyanions, CRC Press, Boca Raton, FL, 2000 Search PubMed.
- K. Wieczorek-Ciurowa and A. Kozak, J. Therm. Anal. Calorim., 1999, 58, 647–651 CrossRef CAS.
- S. S. Kaplan and M. S. Sonmez, Mater. Chem. Phys., 2020, 240, 122152 CrossRef CAS.
- H. Q. Jiang, H. Endo, H. Natori, M. Nagai and K. Kobayashi, J. Eur. Ceram. Soc., 2008, 28, 2955–2962 CrossRef CAS.
| This journal is © The Royal Society of Chemistry 2022 |

