
 Open Access Article
 This Open Access Article is licensed under a Creative Commons Attribution-Non Commercial 3.0 Unported Licence
Quantification of clofarabine in urine and plasma by LC-MS/MS: suitable for PK study and TDM in pediatric patients with relapsed or refractory ALL
Xi Zhang†
a,
Xinbei Jia†bc,
Weihang Tongd,
Hui Chena,
Ning Leid,
Guangrun Lia,
Jun Tai*b and
Pengfei Li *a
*a
aPharmacy Department of Beijing Chaoyang Hospital, Capital Medical University, No. 8 Gongti South Road, Chaoyang District, Beijing, China. E-mail: lee-pf@163.com
bDepartment of Otorhinolaryngology, Children's Hospital, Capital Institute of Pediatrics, No. 2 Yabao Road, Chaoyang District, Beijing, China. E-mail: trenttj@163.com
cChinese Academy of Medical Sciences, Peking Union Medical College, No. 30 Shuangqing Road, Haidian District, Beijing, China
dPharmacy Department of PLA Rocket Force Characteristic Medical Center, No. 16 Xinwai Street, Xicheng District, Beijing, China
First published on 18th November 2022
Abstract
Clofarabine is approved for the treatment of relapsed or refractory acute lymphoblastic leukemia (ALL) in pediatric patients aged 1 to 21 years. Its pharmacokinetic (PK) exposure is strongly related to clinical outcomes and high risk of adverse reactions. PK-guided dosing of nucleoside analogs has the potential to improve survival and reduce toxicity in children. Considering that blood collection is an invasive operation and that the volume of blood collected is usually limited in pediatric ALL patients, a convenient and efficient method for the quantification of clofarabine in human urine and plasma was established with an LC-MS/MS system. Standard curves were shown to be liner in the range of 2.00–1000.00 ng mL−1 in both urine and plasma. Analytical validation of the assay included the assessment of linearity, accuracy (RE: −6.62% to 2.32%), intra-assay precision (RSD: 0.81% to 3.87%) and inter-assay precision (RSD: 1.88% to 5.69%). The absolute recovery rates of clofarabine were 85.50 ± 4.80%, 89.40 ± 0.70% and 98.00 ± 0.40% in urine and were 80.76 ± 1.88%, 86.81 ± 0.75%, 88.10 ± 0.61% in plasma at 5.00, 30.00 and 800.00 ng mL−1, respectively. The selectivity, stability and matrix effects conformed to the biological sample analysis requirements. The cumulative urine excretion rates for 24 hours of the three children with relapsed and refractory acute lymphoblastic leukemia were 72.22%, 87.88%, 82.16%, respectively. The PK data of the pediatric patient numbered lflb13-05 are very inconsistent with that of the other two children subjects, demonstrating that there may be an individual variation in Chinese pediatric patients, so the dose should be individualized based on the monitoring of drug concentration. The method is convenient, sensitive, and accurate, and it is suitable for the determination of clofarabine urine and plasma concentration. This is the first report on the pharmacokinetics of clofarabine in Chinese ALL children. Furthermore, it could be an alternative method to clinical monitoring of clofarabine.
Introduction
Clofarabine is a second-generation purine nucleoside analog that was indicated for the treatment of children (<21 years) with relapsed or refractory ALL.1 Recently, it has also been found to be effective for allogeneic hematopoietic stem cell transplantation (HCT) in children.2In previously reported studies,2–5 patient responses to the clofarabine-based treatment regimens were diverse, and there was a high risk of infection, hepatotoxicity, and death from treatment-related adverse effects. Toxic effects of clofarabine include liver function abnormalities, dose-limiting toxicities of hand-foot syndrome, skin toxicity, and systemic inflammatory response syndrome.6–8 The study by Bozena Büttner9 showed that with increased individual clofarabine exposure, the risk of damage to hepatocytes measured by elevated liver enzymes increased, but antileukemic efficacy did not increase. Clofarabine can also cause acute kidney injury (AKI), the established AKI profile for clofarabine occurred in 16% of patients.10 Increased exposure to clofarabine is associated with an increased risk of renal toxicity in older adults.11
Vijay Ivaturi12 reported that PK-guided dosing of nucleoside analogs has the potential to improve survival and reduce toxicity in children at high risk for graft rejection and disease relapse. Therefore, personalized assays such as PK evaluation of systemic clofarabine exposures are urgently important. Clofarabine population PK for ALL or HCT in pediatric patients from the Netherlands2 and America13 have been reported, however, there were no PK data from Chinese pediatric patients.
Plasma concentrations were usually determined for routine therapeutic drug monitoring (TDM). Current practice includes monitoring clofarabine elimination via serum concentration, a lot of approaches have been reported for the determination of clofarabine concentration in blood.1,13–16 However, considering that the blood collection is an invasive operation, this process could easily cause infection in the patient,17 and the volume of blood collected is usually limited in pediatric patients with ALL.18 The clinical application of these studies is limited. In recent years, the role of biomarkers (e.g., urine) is actively being investigated, drug exposures could be robustly back-calculated by the known urinary excretion fraction.19 The literature20 reported that the urine monitoring system would allow for immediate and accurate prediction and intervention to prevent methotrexate-induced AKI. Approximately 60% of clofarabine is excreted from urine, it is mostly cleared from renal system. Therefore, the level of clofarabine in the urine is physiologically correlated with the circulation of clofarabine in the blood. However, urine collection is noninvasive and can prevent infection during the sample collection and blood consumption in pediatric ALL patients, so the quantification of clofarabine in urine has much more benefits than the determination in other sample matrices. Perhaps, dynamic monitoring of urine clofarabine concentration in patients could be an alternative to clinical monitoring.
In this study, a sensitive and convenient LC-MS/MS method was developed for the first time for the determination of clofarabine in human urine, and the method for the quantification of clofarabine in plasma was established at the same time. The calculation curve, selectivity, accuracy, precision, stability, matrix effect, and recovery were fully validated. The proposed method was successfully applied to three pediatric Chinese ALL patients.
Materials and methods
Materials and reagents
Clofarabine was purchased from Shenzhen Main Luck Pharmaceuticals Inc. (Shenzhen, China), with batch number 081001 and purity 100.1%. Telmisartan was purchased from Guangzhou Qingping Pharmaceuticals Inc. (Guangdong, China), with batch number M060601 and purity 99.80%. Acetonitrile and methanol were HPLC grade, and were purchased from Fisher Scientific (Fair Lawn, NJ, USA). All other chemicals were analytical grade. The distilled demineralized water was produced by a Milli-Q reagent water system (Millipore, MA, USA).Preparation of calibration standards and quality control (QC) samples
The stock solution of clofarabine (50 μg mL−1) was made by dissolving 5.00 mg clofarabine in 100 mL acetonitrile, and stored at 4 °C. Clofarabine urine and plasma standards (1000.00 ng mL−1) were freshly made by spiking the prepared stock solution of clofarabine into the blank urine or plasma. Calibration curves for urine and plasma were prepared with blank urine or plasma at concentrations of 2.00, 5.00, 10.00, 30.00, 100.00, 300.00, 1000.00 ng mL−1, and low, medium and high QC samples for urine and plasma (5.00, 30.00, 800.00 ng mL−1) were also prepared. Care was taken to protect clofarabine solutions and QC samples from direct sunlight. In each analytical run, QC samples, calibration standards, and unknown bio-samples were extracted together.Sample preparation
The stock internal standard solution (IS, 0.10 mg mL−1) was prepared by dissolving 10.00 mg telmisartan in a 100 mL volumetric flask and diluted to 20.00 ng mL−1 working solution with acetonitrile. 100 μL urine or plasma sample and 300 μL of IS working solution were transferred to a 1.5 mL Eppendorf tube. The mixture was vortex for 30 s and centrifuged at 13![[thin space (1/6-em)]](https://www.rsc.org/images/entities/char_2009.gif) 200 rpm for 5 min. An aliquot of 150 μL supernatant was transferred into the autosampler vial and injected 10 μL to the instrument for analysis by LC-MS/MS.
200 rpm for 5 min. An aliquot of 150 μL supernatant was transferred into the autosampler vial and injected 10 μL to the instrument for analysis by LC-MS/MS.
LC-MS/MS conditions
The LC-MS/MS system consisted of an Agilent 1100 series HPLC (Agilent Technologies, Palo Alto, CA, USA) coupled to an Applied Biosystems Sciex 3200 Qtrap™ mass spectrometer (Applied Biosystems Sciex, Ontario, Canada). Applied Biosystems/MDS SCIEX Analyst software was applied for data acquisition and processing.Gradient elution chromatography was carried out at 35 °C on a 150 mm × 4.6 mm, 5 μm Aglient TC-C18 column (Agilent Technologies, Palo Alto, CA, USA), and maintained at a flow rate of 1.0 mL min−1. The mobile phase consisted of methanol and 1 mM aqueous ammonium acetate. The proportion of methanol gradually increased from 10% to 95% during the first 0.90 min. During 0.90 to 2.49 min, the proportion of methanol remained 95%. After that, methanol represented 10% until 5.00 min. The column effluent was split and the speed of which entered the mass spectrometer was approximately 0.5 mL min−1. The injection volume was 10 μL.
The ESI source in positive-ion mode was selected for all experiments. The LC-MS/MS detector was operated at medium resolution in MRM mode using the mass transition ion pairs m/z 304.0 → 170.0 for clofarabine, m/z 515.1 → 276.1 for telmisartan. To optimize the MS parameters, we used a syringe pump for infusing a standard solution of analyte and IS into the mass spectrometer. The optimized parameters were as follows: curtain gas, gas 1 and gas 2 (nitrogen) 25, 45 and 55 units, respectively; dwelling time 200 ms; source temperature 550 °C; ion spray voltage 5500 V. Declustering potential (DP) and collision energy (CE) were 32 V and 29 eV for clofarabine, 35 V and 50 eV for telmisartan, respectively. The collision gas and interface heater were set to ‘medium’ and ‘on’ mode.
Method validation
The analytical method was validated within the guidelines for the validation of bioanalytical methods established by the National Pharmaceuticals Administration, China. A full validation (selectivity, calculation curve, accuracy, precision, recovery, matrix effect, stability, and dilution suitability) was investigated.Calibration standards and QC samples (6 samples per day per concentration level) for urine and plasma were analyzed for at least three separate days. The linearity of the calibration curves which were based on peak areas were assessed by weighted (1/x2) least-squares linear integral analysis (y = ax + b as regression model). The lower limits of quantification (LLOQ) of clofarabine in urine or plasma were the lowest limit of the calibration curves and meet the requirement that the mass spectrum signal was greater than or equal to 10 signal-to-noise ratio. Relative standard deviation (RSD) represented intra- and inter-day precision, and relative error (RE) was used to assess accuracy. Absolute recovery rates of clofarabine were measured by comparing the peak areas of extracted QC samples with those of reference QC solutions reconstituted in blank urine or plasma. Matrix effect was evaluated by comparing peak areas of QC and IS solutions reconstituted in blank urine or plasma extracts with those of the same solutions injected directly into the LC-MS/MS system.
The stabilities of clofarabine both in urine and plasma were evaluated by the spiked QC samples with six replicates under the following conditions: one freeze–thaw cycle and three freeze–thaw cycles at −20 °C, long term at −20 °C for 20, 50, 90 days, short-term and autosampler stabilities at room temperature for 24 h. Samples for stability tests were quantified using freshly prepared calibration standards.
To investigate the suitability of this method for high concentration samples that exceeded the upper limit of detection, high concentration plasma samples were diluted to 6 replicates of dilution samples, and the RSD was evaluated. Each high concentration urine or plasma sample contained clofarabine (15 μg mL−1) and was diluted 500 times with blank urine or plasma.
Application to samples
After ethical approval from the institutional Medical Ethics Committee of the Rocket General Hospital People's Liberation Army was obtained, three pediatric ALL patients were included after the written informed consents were obtained. Per protocol, clofarabine (52 mg m−2 d−1) was administered intravenously for 120 minutes, once daily for 5 days. All collection times corresponded to the infusion of clofarabine for convenience. Urine samples were taken before the beginning of the first administration (−2 to 0 h), during the first administration (0–2.5 h), and after the start of the first administration (2.5–6, 6–8, 8–12, 12–24, 12–24 h), respectively. These urine samples were stored at −20 °C before analysis. 2.0 mL of blood from each pediatric ALL patient was drawn into Eppendorf tubes containing sodium heparin before dosing (0 h) and 0.5, 1, 2, 3, 5, 8, 12, 22 h after the start of the first and fifth administration. On days 2 to 4 of administration, 2 mL of blood was still taken before the start and immediately after the end of administration. Plasma samples were collected by centrifuging the blood at 4000 rpm for 10 min and stored at 20 °C prior to analysis.The developed LC-MS/MS method was used in urine and plasma samples of three pediatric ALL patients. The pharmacokinetic parameters of clofarabine were calculated. The cumulative urinary excretion curves and the concentration–time curves of clofarabine were dawn.
Results and discussion
Optimization of mass spectrometry parameters
In established reports, both ESI1 and APPI13,14 were adopted for the analysis of clofarabine. But for the APPI source, ionization is mainly based on charge and proton transfer to the analytes from the protonated dopant molecules; therefore, the APPI ionization efficiency of the analytes may be affected by the use of dopant solvents and dopant flow.14,21 Clofarabine triphosphate contains a triphosphate group in its structure; however, the electrospray source (ESI) was determined to be more sensitive to clofarabine than APPI, due to its lower levels of background noises.Although instrumental tests with standard solutions in the positive ion detection mode produced a higher response than in the negative mode, presumably because of the high proton affinity of clofarabine. But the signal intensity was not the most ideal. 1 mM ammonium acetate16 or the mixture of 2 mM ammonium acetate and formic acid1 were reported to increase the intensity of the signal compared to the neutral mobile phase solvents. To facilitate fully evaporation of ionized analytes at the ion source, different concentrations of formic acid and ammonium acetate were tested, and 1 mM aqueous ammonium acetate was finally adopted as the mobile phase.
The clofarabine and telmisartan spectra contained predominant protonated molecules at m/z 304.0 and 515.1 in full-scan positive mode, respectively. The product ion spectra of [M + H]+ showed fragment ions of clofarabine at m/z 170.0 and those of telmisartan at m/z 276.1 (Fig. 1) were dominantly presented and finally chosen for the acquisition of multiple reaction monitoring (MRM) of clofarabine and telmisartan, respectively.
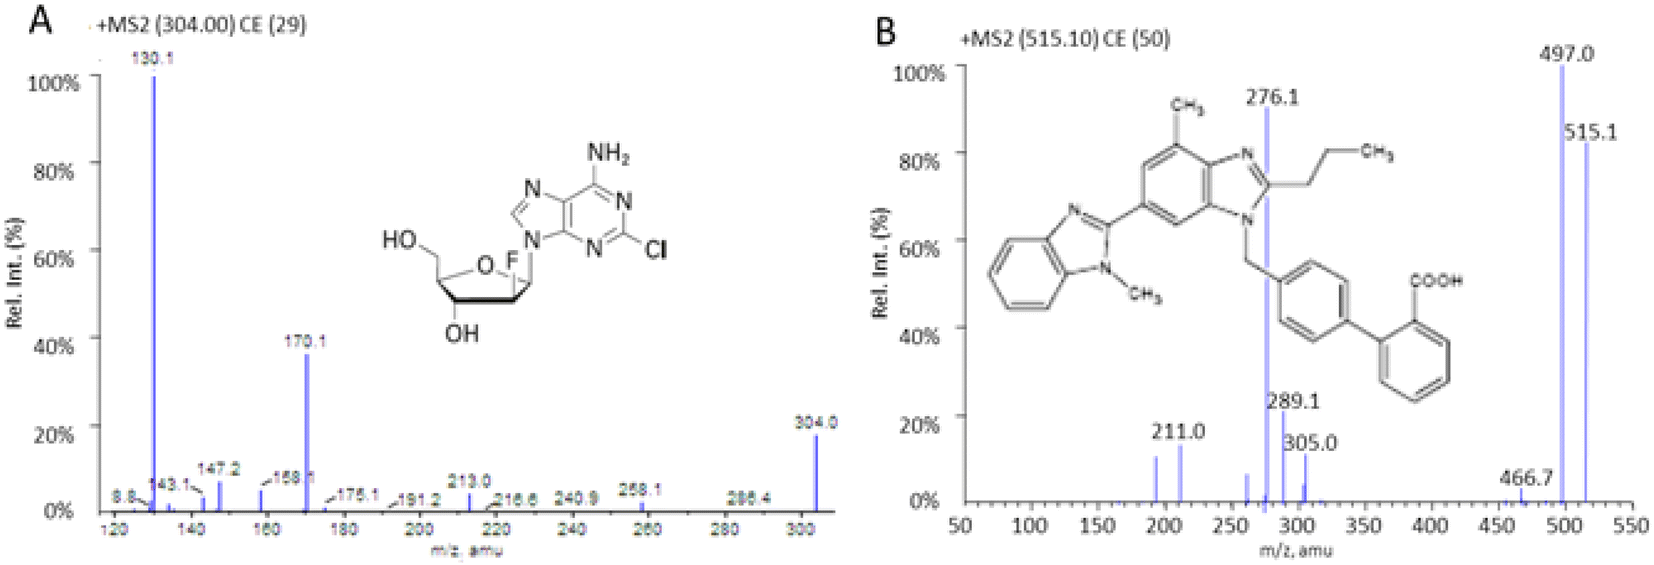 | ||
| Fig. 1 Scanning mass spectrometry of [M + H]+ product of clofarabine (A) and telmisartan (B). | ||
Optimization of chromatography parameters
It is difficult to achieve sufficient retention of clofarabine on the chromatographic column because of its high polarity. A number of analytical columns of C18 150 mm × 4.6 mm, 5 μm analytical column (Agilent Technologies, Palo Alto, CA, USA) were evaluated, such as the Zorbax Eclipse XDB column, the orbax Eclipse HC-C18 column, the Aglient TC-C18 column. The Aglient TC-C18 column gave the best retention times and peak shapes due to its good suitability for the analysis of polar compounds and high water phase.For the determination of the compound in biological samples by LC-MS/MS, sufficient chromatographic resolution is necessary to avoid possible interferences from drug-related biotransformation products.22 As many salts in urine are also polar compounds, achieving good resolution separation and high sensitivity of clofarabine is even more challenging; therefore, the composition of the mobile phase was optimized through several trials. Ammonium acetate is an organic salt; the buffer solution prepared from ammonium acetate was more stable than that from formic acid. At the same time, ammonium acetate can ensure better ionization efficiency of clofarabine, so a mobile phase consisted of methanol and 1 mM ammonium acetate in water was finally adopted. Gradient elution was final selected because it provides better chromatographic resolution and better loading capacity than isocratic elution. In order to avoid the disadvantage of longer analysis time for column re-equilibration of gradient elution, the concentration ratio of methanol was constantly changed from 10% to 95% during 0–0.9 min, and the flow rate was 1.0 mL min−1. Under optimized conditions, there were no co-elution interferences, and the retention time was typically 3.71 min for clofarabine, and 3.72 min for telmisartan. The cycle time was 5.00 min allowing a sample throughput of 200–250 samples per day. This newly established method has a substantially shorter total run time than the reported methods13,15 and a similar total run time with several methods,1,14,16 which are used only for the quantification of clofarabine in plasma. The present validated method is the first validated method for the quantification of clofarabine in urine.
Sample preparation
For plasma sample, protein precipitation with acetonitrile was proved to be a convenient and rapid preparation method because there was lower background noise and higher sensitivity compared to methanol. SPE23 and MESP24 are regularly chosen for urine sample clean-up because they are easy to automate, remove a number of interfering components and improve sensitivity thanks to the concentration factor. But they are tedious and solvent-consuming and are hazardous to health and harmful to the environment. In recent years, the dilution method is frequently adopted for urine sample preparation because it is not dependent on sample preparation and the effects of the matrix have no impact on the validated LOQs or the ability to detect in urine samples.25–27 In this study, the dilution method was adopted to simplify the preparation of the urine sample and the absolute recovery rates of clofarabine were greater than 85.00% at 5.00, 30.00 and 800.00 ng mL−1.Based on our previous experience, both telmisartan and ampicillin had good ionization ability in the positive ionization mode. Comprehensively considering the stability under the sample preparation and analysis procedure, telmisartan was finally chosen as IS after several trials.
Assay validation
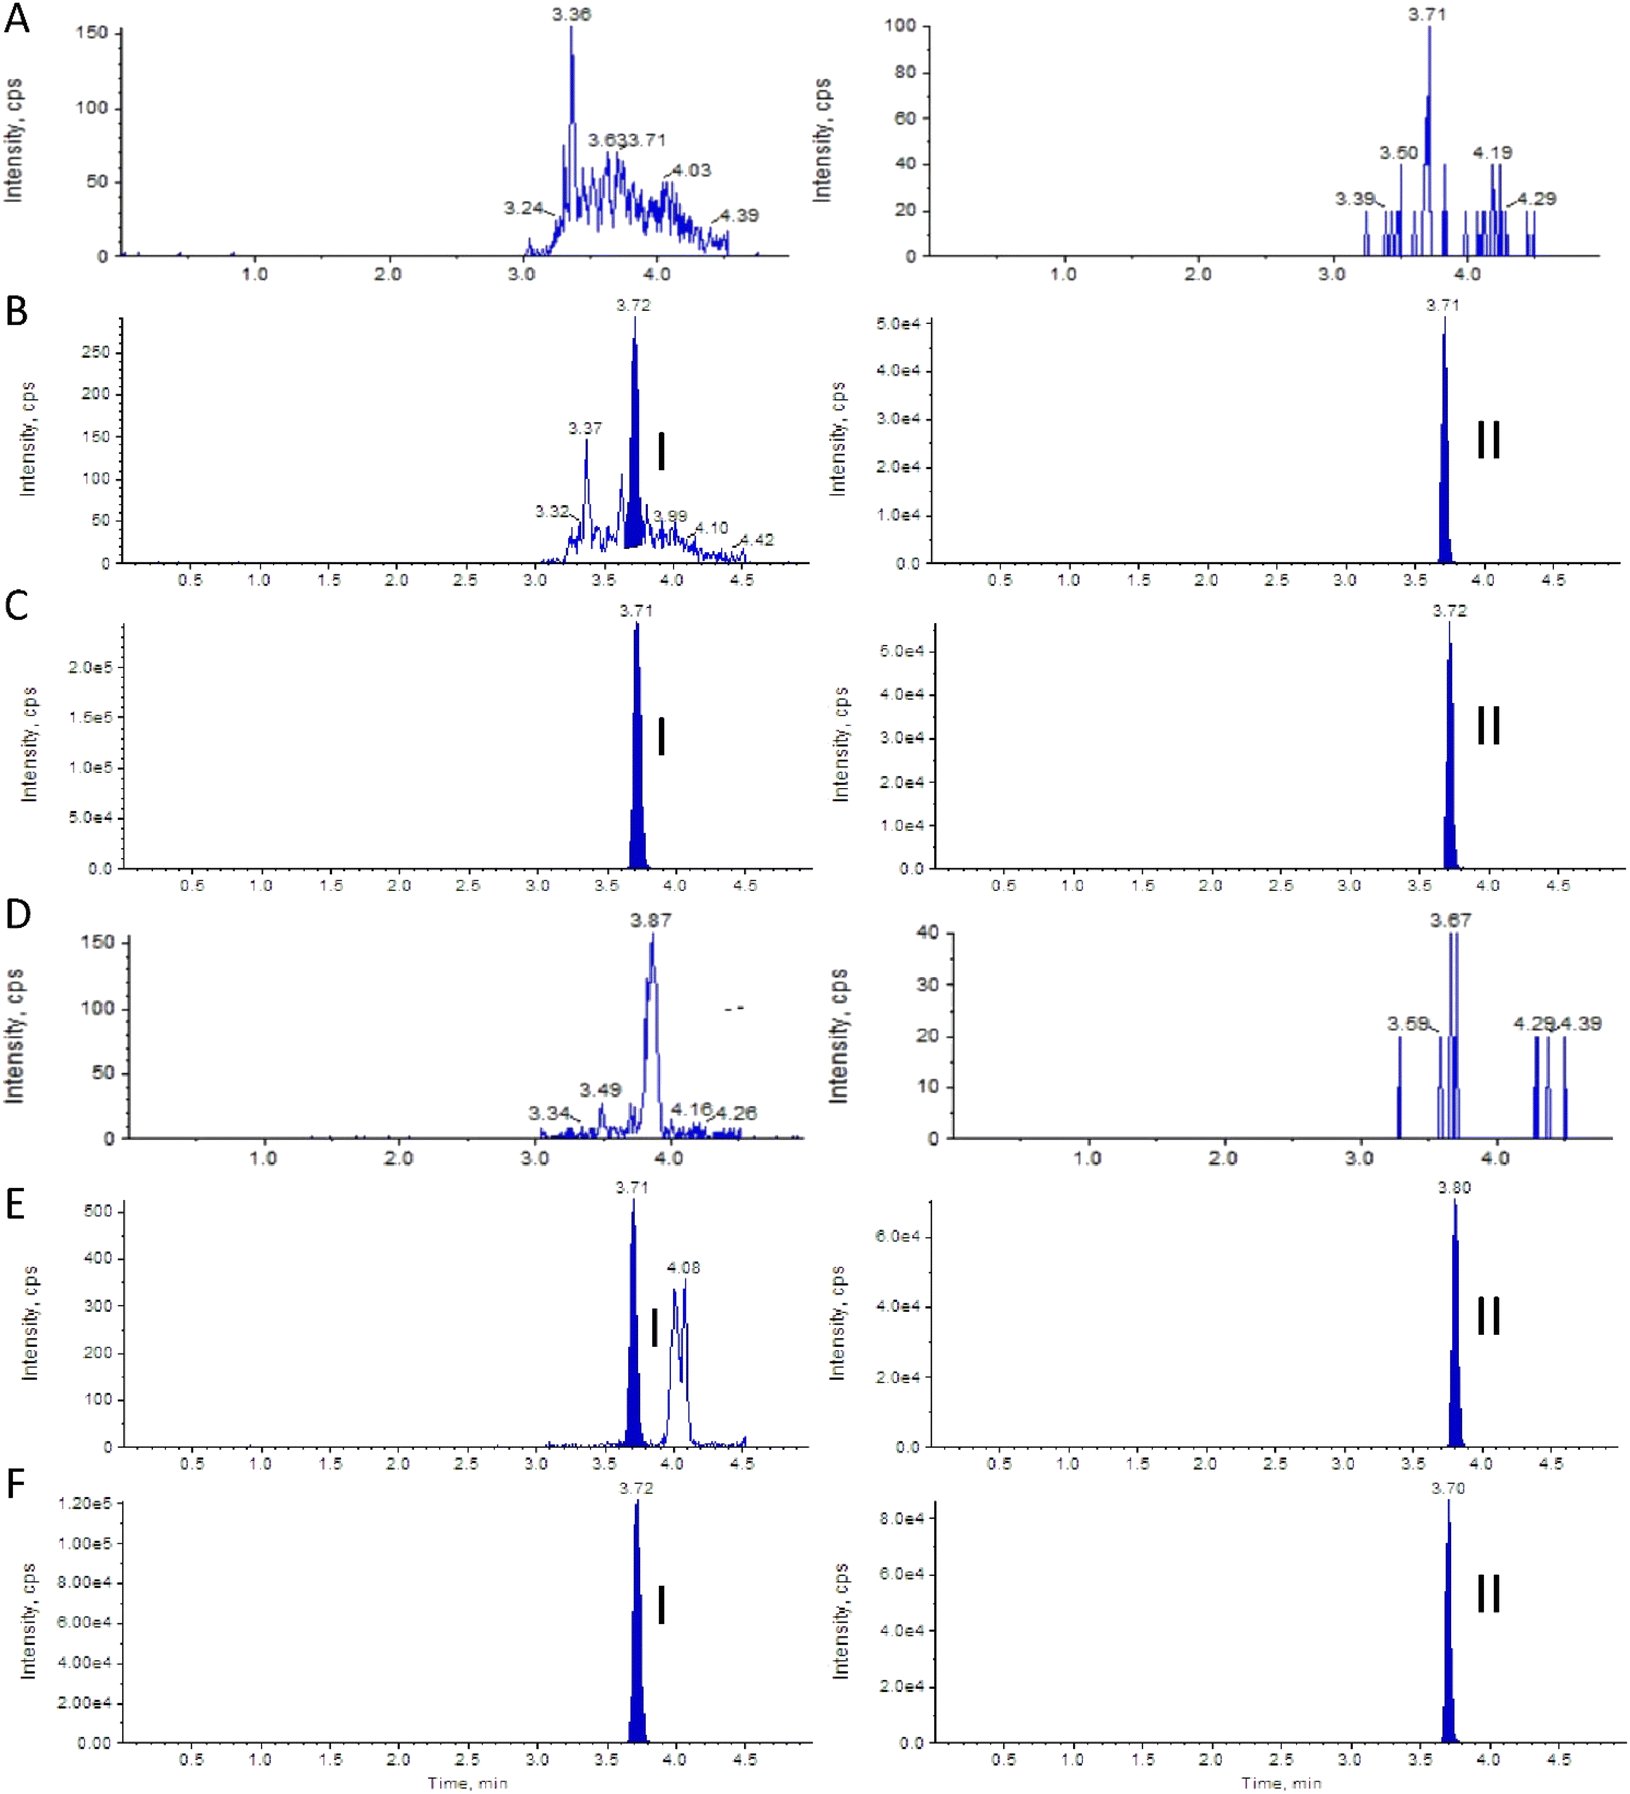 | ||
| Fig. 2 Representative multi-reaction monitoring mode chromatograms. Blank urine (A) and blank plasma (D); spiked with clofarabine (2 ng mL−1) and IS (20 ng mL−1) to blank urine (B) or plasma (E); patient u-LFLB13-02-02 urine (C) or plasma (F) after intravenous infusion of clofarabine injection. | ||
The typical calibration curve equation for the urine sample was y = 0.00306x + 0.00103, and the correlation coefficient was 0.9989. The calibration curve concentration range was 2.00–1000.00 ng mL−1 with the LLOQ of 2.00 ng mL−1 for urine.
As Table 1 shows, the intra- and inter-day RSDs of the urine QC were 0.81–3.59%, 1.88–4.12%, the REs were −6.33–2.32%, −6.62–1.23%. All values were within the acceptable range.
| Sample | Concentration (ng mL−1) | Intra-day | Inter-day | ||||
|---|---|---|---|---|---|---|---|
| Measured (ng mL−1, x ± s) | RSD (%) | RE (%) | Measured (ng mL−1, x ± s) | RSD (%) | RE (%) | ||
| a Abbreviations: RSD: relative standard deviation; RE: relative error. | |||||||
| Urine | 5.00 | 5.01 ± 0.18 | 3.59 | 0.28 | 5.06 ± 0.21 | 4.12 | 1.23 |
| 30.00 | 28.10 ± 0.43 | 1.53 | −6.33 | 28.01 ± 0.53 | 1.88 | −6.62 | |
| 800.00 | 818.60 ± 6.61 | 0.81 | 2.32 | 778.55 ± 31.02 | 3.98 | −2.68 | |
| Plasma | 5.00 | 4.90 ± 0.19 | 3.87 | −1.94 | 4.85 ± 0.28 | 5.69 | −3.08 |
| 30.00 | 29.22 ± 0.80 | 2.75 | −2.60 | 29.01 ± 1.62 | 5.60 | −3.30 | |
| 800.00 | 809.03 ± 8.09 | 1.00 | 1.13 | 806.86 ± 36.48 | 4.52 | 0.86 | |
The absolute recovery rates of clofarabine were 85.50 ± 4.80%, 89.40 ± 0.70% and 98.00 ± 0.40% in urine at 5.00, 30.00 and 800.00 ng mL−1, respectively. The results of the matrix effects indicated that no co-eluting endogenous substances significantly influenced the ionization of clofarabine and the internal standard.
The stability results (Table 2) suggested that the REs met the requirements, clofarabine in urine was stable under all conditions. The results of the stability of the dilution showed that the recovery rate of clofarabine was 96.73 ± 1.94% in urine. Thus, this determination method was not only suitable for samples within the detection limit, but also was superior for high-concentration samples that exceeded the upper limit of detection.
| Sample | Concentration (ng mL−1) | 1 freeze–thaw | 3 freeze–thaw | Long term at −20 °C for 20 days | Long term at −20 °C for 50 days | Long term at −20 °C for 90 days | Short-term and autosampler at room temperature for 24 h | |||||||
|---|---|---|---|---|---|---|---|---|---|---|---|---|---|---|
| Measured (ng mL−1) | RE (%) | Measured (ng mL−1) | RE (%) | Measured (ng mL−1) | RE (%) | Measured (ng mL−1) | RE (%) | Measured (ng mL−1) | RE (%) | Measured (ng mL−1) | RE (%) | |||
| a Abbreviations: RE: relative error. | ||||||||||||||
| Urine | 5.00 | 4.85 ± 0.12 | −3.07 | 5.25 ± 0.08 | 4.97 | 5.32 ± 0.14 | 2.69 | 5.44 ± 0.21 | 8.84 | 5.16 ± 0.20 | 3.14 | 5.01 ± 0.08 | 0.15 | |
| 30.00 | 32.17 ± 0.17 | 7.23 | 28.96 ± 0.64 | −3.45 | 27.33 ± 0.59 | 2.17 | 27.93 ± 1.40 | −6.90 | 33.49 ± 0.49 | 11.63 | 28.43 ± 1.18 | −5.23 | ||
| 800.00 | 715.15 ± 9.62 | −10.61 | 750.26 ± 12.26 | −6.22 | 765.31 ± 7.03 | 0.92 | 766.33 ± 7.58 | −4.21 | 885.68 ± 11.45 | 10.71 | 800.34 ± 21.34 | 0.04 | ||
| Plasma | 5.00 | 5.09 ± 0.26 | 1.77 | 5.02 ± 0.09 | 0.34 | 4.92 ± 0.18 | −1.56 | 4.88 ± 0.10 | −2.49 | 4.81 ± 0.17 | −3.71 | 4.77 ± 0.15 | −4.51 | |
| 30.00 | 27.29 ± 0.37 | −9.05 | 29.64 ± 0.42 | −1.21 | 29.31 ± 0.57 | −2.30 | 32.53 ± 1.38 | 8.42 | 30.00 ± 1.90 | 0.02 | 27.97 ± 1.19 | −6.75 | ||
| 800.00 | 700.94 ± 12.64 | −12.38 | 841.04 ± 20.48 | 5.13 | 874.00 ± 15.15 | 9.25 | 815.57 ± 17.73 | 1.95 | 802.50 ± 17.71 | 0.31 | 815.95 ± 19.72 | 1.99 | ||
The typical calibration curve equation for the plasma sample was y = 0.00385x + 0.00195, and the correlation coefficient was 0.9949. The calibration curve concentration range was 2.00–1000.00 ng mL−1 with the LLOQ of 2.00 ng mL−1 for plasma. The previous studies reported that the LOD of clofarabine in plasma were 2.50 ng mL−1 (ref. 14 and 16) or 20.00 ng mL−1.1 Compared with the previous studies, the established method in plasma has a lower LOD. In addition, the detection range of Liusheng Huang's13 study was 0.50–80.00 ng mL−1, although the LOD is lower than that of this study, the detection range of this study is wider and more suitable for the needs of clinical sample testing.
As Table 1 shows, the intraday and inter-day RSDs of plasma QC were 1.00–3.87%, 4.52–5.69%, RE were −2.60–1.13%, −3.30–0.86%. Both the RSDs and the REs were less than 15%.
The absolute recovery rates of clofarabine were 80.76 ± 1.88%, 86.81 ± 0.75%, 88.10 ± 0.61% in plasma at 5.00, 30.00 and 800.00 ng mL−1, respectively. The results of the matrix effects indicated that no co-eluting endogenous substances significantly influenced the ionization of clofarabine and the internal standard.
The stability results (Table 2) suggested that the REs in plasma all met the requirements, plasma sample was stable under all conditions. The results of the stability of the dilution showed that the recovery rate of clofarabine was 101.50 ± 0.58% in plasma. Thus, this determination method can meet the needs of clinical detection of higher concentration samples.
| Patient ID | lflb13-02 | lflb01-01 | lflb13-05 | |||
|---|---|---|---|---|---|---|
| PK parameters | Single-dose | Multiple-dose | Single-dose | Multiple-dose | Single-dose | Multiple-dose |
| a Abbreviations: Tmax: time of Cmax; Cmax: peak plasma concentration; AUC: area under the curve; Vd: the apparent volume of distribution; T1/2: terminal half-life; MRT: mean residue time; CL: clearance. | ||||||
| Tmax (h) | 2.50 | 2.50 | 2.50 | 2.50 | 2.50 | 2.50 |
| Cmax (ng mL−1) | 565.35 | 921.55 | 800.28 | 1675.00 | 524.58 | 513.84 |
| AUC0−t (h ng mL−1) | 3258.70 | 5193.25 | 5392.26 | 5156.59 | 2238.86 | 2503.96 |
| AUC0−INF (h ng mL−1) | 3295.17 | 5314.66 | 5434.06 | 5237.99 | 2320.29 | 2570.19 |
| Vd (L) | 0.10 | 0.09 | 0.07 | 0.11 | 0.19 | 0.18 |
| T1/2 (h) | 3.64 | 5.14 | 3.16 | 5.07 | 5.67 | 5.82 |
| MRT (h) | 5.59 | 100.11 | 5.98 | 99.73 | 4.99 | 100.23 |
| CL (L h−1) | 0.02 | 0.01 | 0.01 | 0.02 | 0.02 | 0.02 |
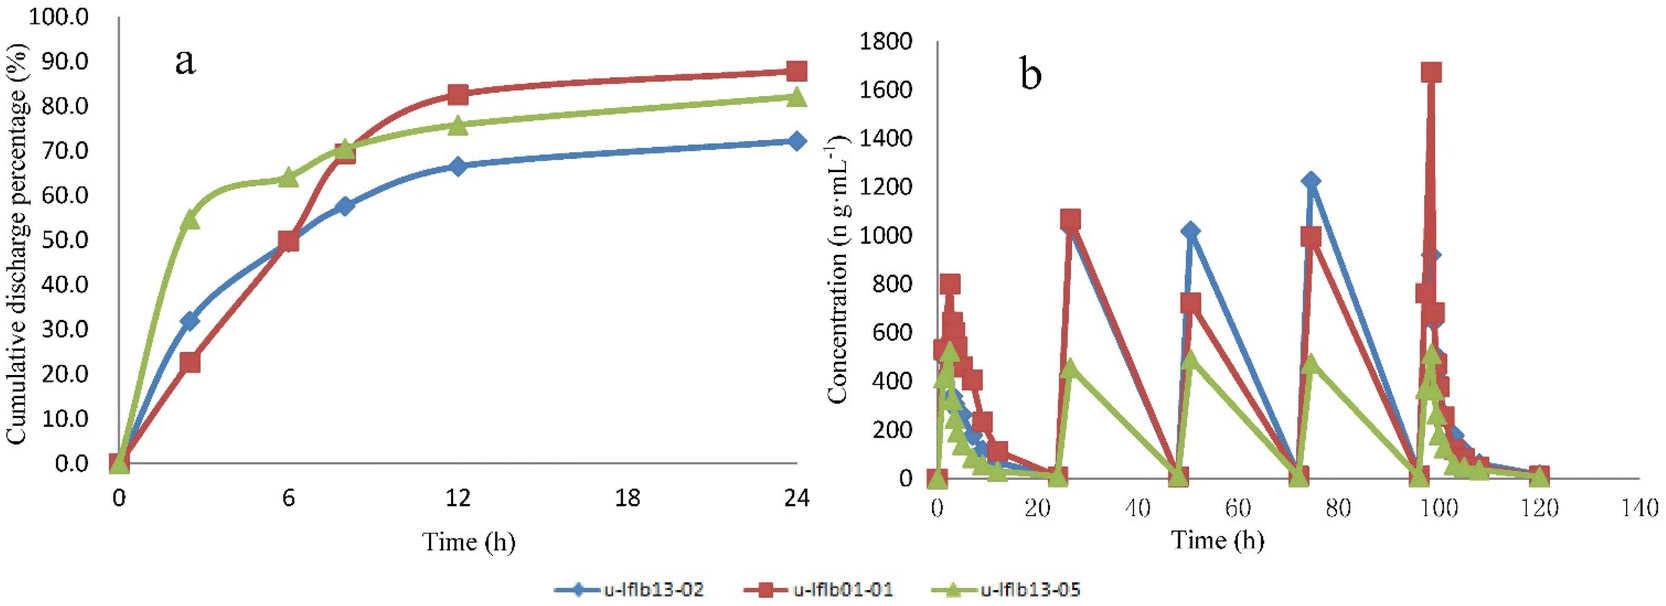 | ||
| Fig. 3 Cumulative urinary excretion curves (a) and plasma concentration–time curve (b) of clofarabine after clofarabine injection. | ||
Previous literature27 reported that renal function and body weight are two important covariates for clearance, therefore, they should be fully considered as components when determining the individual dose of clofarabine.27 For a basis for optimizing the schedule of clofarabine administration, urine concentration should be standardized by the basal creatinine level. At present, the quantitative method ultimately remains qualitative in that clofarabine can relate only to positive or negative aspects of treatment. Future research should focus on the relationship between serum and urine clofarabine concentrations and determining approximate therapeutic concentration ranges of urine to facilitate safety and efficacy.
Conclusions
In the present paper, an LC-MS/MS method for the quantification of clofarabine in human urine was developed and validated for the first time, and the detection method of clofarabine in plasma by LC-MS/MS was established and was more advanced than previous studies. For a single sample, the sample preparation had a consumption of blood and urine volumes as low as 100 μL. The cycle time was 5.0 min. With the ESI-MS/MS detector, the detection range of clofarabine was 2.00–1000.00 ng mL−1. The method was fully validated and successfully used for the analysis of Chinese pediatric patients with relapsed or refractory ALL, demonstrating that the quantitative method was miniaturized, effective, portable, and convenient. It is suitable for the determination of clofarabine in urine and plasma, and provides a clinically useful tool for the monitoring and individualized therapy of therapeutic drugs. This is the first report on the pharmacokinetics of clofarabine in Chinese ALL children. As the present study included a relatively small number of patients, in the future, a larger number of pediatric patients should be included to realize the precise dose guided by PK of clofarabine in Chinese ALL children.Author contributions
All the authors have accepted responsibility for the entire content of this submitted manuscript and approved submission. All authors have read and agreed to the published version of the manuscript. Xi Zhang: validation, sample testing, data curation, writing – original draft. Xinbei Jia: data curation, writing – original draft. Weihang Tong: sample collection. Hui Chen: investigation. Ning Lei: investigation. Guangrun Li: sample collection. Jun Tai: conceptualization, writing – review & editing, supervision. Pengfei Li: conceptualization, methodology, validation, writing – review & editing, project administration.Conflicts of interest
The authors declare that the research was conducted in the absence of any commercial or financial relationships that could be construed as a potential conflict of interest.Acknowledgements
This research did not receive any specific grant from funding agencies in the public, commercial, or not-for-profit sectors.References
- B. Buttner, R. Oertel, J. Schetelig, J. M. Middeke, M. Bornhauser, A. Seeling and H. Knoth, J. Pharm. Biomed. Anal., 2016, 125, 286–291 CrossRef PubMed.
- A. L. Nijstad, S. Nierkens, C. A. Lindemans, J. J. Boelens, M. Bierings, A. B. Versluys, K. C. M. van der Elst and A. D. R. Huitema, Br. J. Clin. Pharmacol., 2021, 87, 3218–3226 CrossRef CAS PubMed.
- N. Hijiya, P. Gaynon, E. Barry, L. Silverman, B. Thomson, R. Chu, T. Cooper, R. Kadota, M. Rytting, P. Steinherz, V. Shen, S. Jeha, R. Abichandani and W. L. Carroll, Leukemia, 2009, 23, 2259–2264 CrossRef CAS PubMed.
- N. Hijiya, B. Thomson, M. S. Isakoff, L. B. Silverman, P. G. Steinherz, M. J. Borowitz, R. Kadota, T. Cooper, V. Shen, G. Dahl, J. V. Thottassery, S. Jeha, K. Maloney, J. A. Paul, E. Barry, W. L. Carroll and P. S. Gaynon, Blood, 2011, 118, 6043–6049 CrossRef CAS PubMed.
- F. Locatelli, A. M. Testi, M. E. Bernardo, C. Rizzari, A. Bertaina, P. Merli, A. Pession, E. Giraldi, R. Parasole, W. Barberi and M. Zecca, Br. J. Haematol., 2009, 147, 371–378 CrossRef CAS PubMed.
- S. Jeha, V. Gandhi, K. W. Chan, L. McDonald, I. Ramirez, R. Madden, M. Rytting, M. Brandt, M. Keating, W. Plunkett and H. Kantarjian, Blood, 2004, 103, 784–789 CrossRef CAS PubMed.
- CLOLAR® (clofarabine) label, last revised January 2013, available from http://products.sanofi.us/clolar/clolar.html.
- S. Jeha, B. Razzouk, M. Rytting, S. Rheingold, E. Albano, R. Kadota, L. Luchtman-Jones, L. Bomgaars, P. Gaynon, S. Goldman, K. Ritchey, R. Arceci, A. Altman, K. Stine, L. Steinherz and P. Steinherz, J. Clin. Oncol., 2009, 27, 4392–4397 CrossRef CAS PubMed.
- B. Büttner, H. Knoth, M. Kramer, R. Oertel, A. Seeling, K. Sockel, M. von Bonin, F. Stolzel, N. Alakel, U. Platzbecker, C. Rollig, G. Ehninger, M. Bornhauser, J. Schetelig and J. M. Middeke, Leuk. Lymphoma, 2017, 58, 2865–2874 CrossRef PubMed.
- W. L. Salzer, M. J. Burke, M. Devidas, S. Chen, L. Gore, E. C. Larsen, M. Borowitz, B. Wood, N. A. Heerema, A. J. Carroll, J. M. Hilden, M. L. Loh, E. A. Raetz, N. J. Winick, W. L. Carroll and S. P. Hunger, Cancer, 2021, 127, 4106–4107 CrossRef PubMed.
- C. R. Petri, P. H. O'Donnell, H. Cao, A. S. Artz, W. Stock, A. Wickrema, M. Hard and K. van Besien, Leuk. Lymphoma, 2014, 55, 2866–2873 CrossRef CAS PubMed.
- V. Ivaturi, C. C. Dvorak, D. Chan, T. Liu, M. J. Cowan, J. Wahlstrom, M. Stricherz, C. Jennissen, P. J. Orchard, J. Tolar, S. Y. Pai, L. Huang, F. Aweeka and J. Long-Boyle, Biol. Blood Marrow Transplant., 2017, 23, 1701–1713 CrossRef CAS PubMed.
- L. Huang, P. Lizak, C. C. Dvorak, F. Aweeka and J. Long-Boyle, J. Chromatogr. B: Anal. Technol. Biomed. Life Sci., 2014, 960, 194–199 CrossRef CAS PubMed.
- Y. Hsieh, C. J. Duncan, S. Lee and M. Liu, J. Pharm. Biomed. Anal., 2007, 44, 492–497 CrossRef CAS PubMed.
- V. Gandhi, W. Chen, M. Ayres, J. K. Rhie, T. L. Madden and R. A. Newman, Cancer Chemother. Pharmacol., 2002, 50, 85–94 CrossRef CAS PubMed.
- A. M. Punt, J. B. Langenhorst, A. C. Egas, J. J. Boelens, C. van Kesteren and E. M. van Maarseveen, J. Chromatogr. B: Anal. Technol. Biomed. Life Sci., 2017, 1055–1056, 81–85 CrossRef CAS PubMed.
- K. Khachornsakkul, A. Tiangtrong, A. Suwannasom, W. Sangkharoek, O. Jamjumrus and W. Dungchai, Analyst, 2022, 147, 695–703 RSC.
- J. Long-Boyle, J. Huang, N. Rydholm, A. Smith, P. Orchard, J. Tolar and P. Jacobson, J. Clin. Pharmacol., 2011, 51, 679–686 CrossRef CAS PubMed.
- B. Ringbeck, D. Bury, A. Ikeda-Araki, Y. Ait Bamai, R. M. Ketema, C. Miyashita, T. Bruning, R. Kishi and H. M. Koch, Environ. Int., 2022, 161, 107145 CrossRef CAS PubMed.
- J. R. Greenmyer, L. Burd and N. L. Kobrinsky, J. Pediatr. Pharmacol. Therapeut., 2021, 26, 300–305 CrossRef PubMed.
- T. J. Kauppila, T. Nikkola, R. A. Ketola and R. Kostiainen, J. Mass Spectrom., 2006, 41, 781–789 CrossRef CAS PubMed.
- Y. Hsieh, M. Chintala, H. Mei, J. Agans, J. M. Brisson, K. Ng and W. A. Korfmacher, Rapid Commun. Mass Spectrom., 2001, 15, 2481–2487 CrossRef CAS PubMed.
- G. Magliocco, F. Le Bloc'h, A. Thomas, J. Desmeules and Y. Daali, J. Chromatogr. B: Anal. Technol. Biomed. Life Sci., 2021, 1181, 122938 CrossRef CAS PubMed.
- M. Protti, R. Mandrioli and L. Mercolini, Bioanalysis, 2020, 12, 769–782 CrossRef CAS PubMed.
- S. Feng, J. R. Enders, O. T. Cummings, E. C. Strickland, T. McIntire and G. McIntire, J. Anal. Toxicol., 2020, 44, 331–338 CrossRef CAS PubMed.
- P. Gatarek, J. Kaluzna-Czaplinska, M. Pawelczyk, K. Jastrzebski, J. Giebultowicz, A. Glabinski and B. Bobrowska-Korczak, Molecules, 2020, 25, 4959 CrossRef CAS PubMed.
- Z. Galla, G. Racz, N. Grecso, A. Barath, M. Kosa, C. Bereczki and P. Monostori, J. Chromatogr. B: Anal. Technol. Biomed. Life Sci., 2021, 1179, 122846 CrossRef CAS PubMed.
- S. Faderl, V. Gandhi, S. O'Brien, P. Bonate, J. Cortes, E. Estey, M. Beran, W. Wierda, G. Garcia-Manero, A. Ferrajoli, Z. Estrov, F. J. Giles, M. Du, M. Kwari, M. Keating, W. Plunkett and H. Kantarjian, Blood, 2005, 105, 940–947 CrossRef CAS PubMed.
Footnote |
| † These authors contributed equally to this work. |
| This journal is © The Royal Society of Chemistry 2022 |