 Open Access Article
Preparation of immobilized pepsin for extraction of collagen from bovine hide
Youdan Duana and
Haiming Cheng *ab
*ab
aKey Laboratory of Leather Chemistry and Engineering of Ministry of Education, Sichuan University, Chengdu, 610065, China. E-mail: chenghaiming@scu.edu.cn
bNational Engineering Research Center of Clean Technology in Leather Industry, Sichuan University, Chengdu 610065, China
First published on 1st December 2022
Abstract
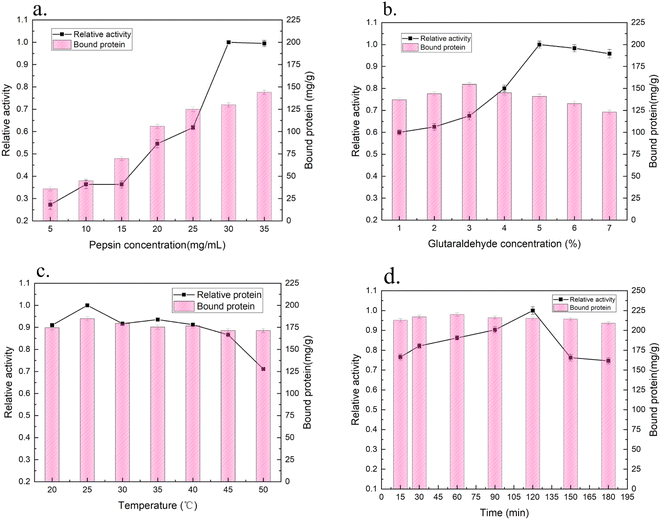
In the extraction of collagens from mammalian tissues, the free pepsin used in the acid–pepsin extraction system is hard to recycle, and there is a risk of enzyme protein contamination in the extracted collagen products, which limits their applications. To solve this problem, an immobilized pepsin was successfully prepared via the covalent crosslinking of glutaraldehyde using a 3-aminopropyltriethoxysilane (APTES) surface modified silica clay as the support. The immobilized pepsin was applied for the extraction of collagen from bovine hide. The optimal immobilization process involves incubating pepsin with an initial concentration of 35 mg mL−1 and glutaraldehyde with 5% activated APTES modified silica clay at 25 °C for 60 min, by which the loading amount of pepsin was 220 mg g−1 and the activity of the immobilized pepsin was 4.2 U mg−1. The collagen extracted using acetic acid and the immobilized pepsin method retained its complete triple helix structure. This research thus details an effective separation method using pepsin for extraction of collagen via an acetic acid–enzyme method, where the extracted collagen may be a candidate for use in biomaterial applications.
1. Introduction
Type I collagen, the most abundant protein in vertebrates, has been widely used as a biomaterial as it has excellent biological functions and properties.1,2 Extracting type I collagen from mammalian tissues using acetic acid combined with pepsin has been commonly used for decades.3 Schmitt developed methods using the enzyme pepsin and acetic acid for extracting collagen in a high yield from bovine skin4. Pepsin is a single chain enzyme with high specificity that is secreted by inactive pepsinogen and its autocatalytic activation occurs at a pH of <5, where the N-terminal group is removed to leave the enzyme with a molecular weight of around 34 kDa.5,6 The optimum pH of pepsin is between 1.5 and 2.0, and it is inactive above pH 6.5. Residues of Asp 32 and Asp 215 at the active sites are hydrogen-bonded by folding into two independent Asp–Thr–Gly sequences, which allow pepsin to exhibit optimal biological activity in acidic environments.7 Pepsin is quite rich in Asp and Glu, but it has only one lysine residue. Pepsins play a critical role in the solubilization of extracted collagen. During collagen extraction, pepsin preferentially acts on the C-terminus of aromatic amino acids, such as Phe, Try, Leu and Tyr.8,9Although the acetic acid–pepsin method is still preferred for obtaining highly purified solubilized collagen from bones,10–13 tendon,14–16 and various ocean fish skins,17–19 the added pepsin is a difficult material to recycle for reuse. Moreover, it is difficult to separate pepsin completely from the extracted collagen, where it may remain and serve as a potential allergen.
Therefore, the solution to these limitations may be solved by using immobilized pepsin in the extraction process. Immobilized enzymes refer to enzymes that play a catalytic role in a certain spatial range and can be used repeatedly and continuously. Immobilized enzymes can solve the problems of the high costs associated with using free enzymes, the time-consuming separation of enzymolysis products from substrates, restriction of recovery and sample contamination, and are easy to use, separate and reuse.11
The immobilization process can prevent molecular interaction and self-digestion,20–22 as well as improving enzyme stability, activity, and selectivity.23 Several methods have been used for enzyme immobilization, such as adsorption, trapping and covalent binding.24 The applicability and advantages of enzyme immobilization in practical applications depend on the specific enzyme characteristics, reaction characteristics, substrate and product properties. Furthermore, pepsin has been successfully immobilized on different types of support using various immobilization methods. Santos successfully immobilized pepsin on biochar via adsorption and covalent binding.9 Dascalu reported the immobilization of pepsin on magnetite nanoparticles.7 Moreover, pepsin can also be immobilized on agarose,25 organosilicon,5 mesoporous silica,26 and chitosan.27 Glutaraldehyde is one of the most common tools for enzyme immobilization, as it contains two active aldehyde groups and can react with the primary amino group of proteins. Glutaraldehyde is usually used to enable the first immobilization on the support to activate the ammoniated support.30
Porous silica clay (specific surface area 79 m2 g−1) has been used as a pepsin support due to its low cost and abundance.28 The inner surface of the porous material can prevent digestion, and the protein can also gain a high internal surface area to realize high load catalyst immobilization. Moreover, enzymes located in pore channels are protected against microbial attack and physical/mechanical damage.29
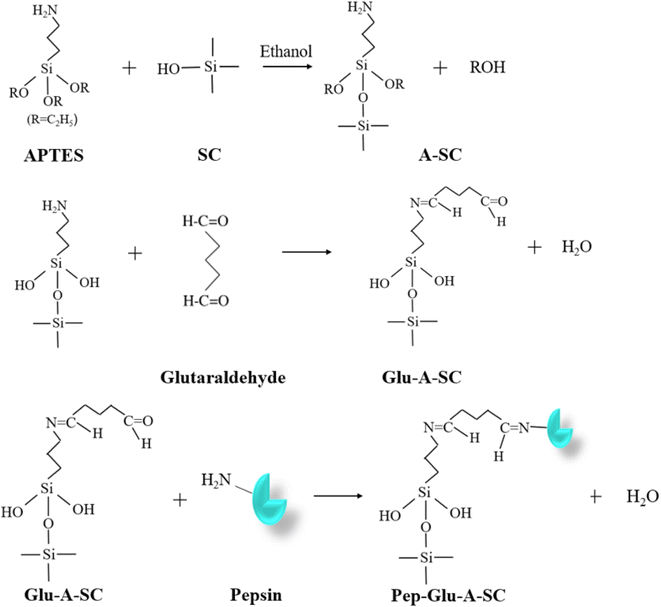
Herein, silica clay was modified with 3-aminopropyltriethoxysilane (APTES) to introduce amino groups on the surface of the support. In addition, glutaraldehyde was used to further react with the amino group on the support surface and pepsin was immobilized by the reaction of glutaraldehyde with the amino group on the side chain of pepsin16. The properties of the immobilized pepsin were investigated. Then, the prepared immobilized pepsin was applied in an acetic acid–pepsin extraction process of collagen from mature bovine hides.
2. Materials and methods
2.1. Materials
Silica clay was obtained from Ningbo Create New Materials Co., (Ningbo, China). Pepsin was purchased from Sinopharm Reagent Co. (Shanghai, China). 3-Aminopropyltriethoxysilane (APTES), glutaraldehyde, and hemoglobin were obtained from Aladdin Biochemical Technology Co (Shanghai, China). All other reagents were analytical grade reagents and used without further purification.2.2. Preparation of immobilized pepsin
The modification of silica clay (SC) and the immobilization of pepsin onto the modified SC was conducted according to our previous work.31 The preparation is briefly described as follows. Step 1: a quantity of 4.0 g of silica clay (SC) was dispersed in 30 mL of ethanol for 30 min using ultrasonication. Then, 8 mL of 3-aminopropyltriethoxysilane (APTES) was injected into the ultrasonicated solution. The mixture was heated under reflux for 24 h under a nitrogen gas atmosphere with gentle magnetic stirring. Then, the modified support was filtered and rinsed with ethanol several times to remove the unreacted APTES. Then, the washed APTES-modified silica (assigned as A-SC) was dried at 60 °C. Step 2: a mixture of 1.0 g of A-SC and 10 mL of a set concentration glutaraldehyde solution was incubated at 30 °C with gentle shaking. And then the solid powder was rinsed several times with 0.01 mol L−1 of HCl and dried at 60 °C. The product was assigned as Glu-A-SC. Step 3: to immobilize pepsin onto Glu-A-SC, 1.0 g of Glu-A-SC was incubated with 10 mL of a 5–35 mg per mL pepsin solution (in 0.01 mol per L HCl) at a certain temperature (20–50 °C) for a certain time (20–180 min). After the reaction, the mixture was filtered, and then washed with 0.01 mol L−1 of HCl several times. The solid was lyophilized and stored at 4 °C for use (assigned as Pep-Glu-A-SC). A scheme of the preparation process is shown in Fig. 1.2.3. Characterization
The Fourier-transform infrared (FTIR) spectra of the samples were collected on a Nicolet Is10 infrared spectrometer (Thermo Fisher Scientific, Boston, MA, USA) using the KBr pellet method over a range from 4000 to 400 cm−1. The morphologies of the samples were observed using a FEI XL-30 scanning electron microscope (SEM) (FEI, Hillsboro, OR, USA). X-ray diffraction profiles were obtained from an X'Pert Pro MPD DY 129 X-ray diffractometer (Oxford Instruments, UK). The specific surface area of the samples was measured using a Gemini VII 2390 (Micromeritics, USA) automatic rapid specific surface area and porosity analyzer using nitrogen as the medium. The elemental contents of C, H, N, and S of the samples were determined using a Flash-Smart NCS element analyzer (Thermo Fisher Scientific, Boston, MA, USA).2.4. Activity and enzymatic properties of immobilized pepsin
Pepsin activity was determined using hemoglobin solution (2%) as a substrate.32 First, 0.1 mL of free pepsin solution (dissolved in 0.01 mol per L HCl) or 20 mg of immobilized pepsin was mixed with 0.3 mL of substrate. After incubation at 37 °C for 10 min, the reaction was terminated by adding 0.6 mL of 0.3 mol per L trichloroacetic acid, and the undigested hemoglobin substrate was precipitated. The mixture was centrifuged at 3500 rpm for 5 min, the supernatant was removed and the absorbance value was measured at 280 nm on a UV1900 UV-vis spectrophotometer (JingHua Instruments, China). The activity (U) was calculated using eqn (1):
 | (1) |
To determine the amount of pepsin loaded onto the support, the protein content in the solution before and after the immobilization process was determined by Lowry assay33 using bovine serum albumin (BSA) as a standard. The pepsin loading on the support was calculated according to eqn (2):
 | (2) |
The stability of free and immobilized pepsin on pH was determined in disodium hydrogen phosphate–citric acid buffer (CPBS) (pH 2.0–8.0). Enzymes (free or immobilized) were incubated in the set pH value buffer for 30 min, and then their hydrolytic activities towards a hemoglobin substrate were determined. The stability of free and immobilized pepsin towards temperature was determined by incubating the enzymes in CPBS buffer (pH = 2.0) in the range of 20–70 °C to measure their hydrolytic activity towards hemoglobin substrate. The stability of the free and immobilized enzyme on duration in CPBS buffer (pH = 2.0) at 50 °C was investigated. The results are presented in standardized form, with the highest activity value as 1.0.
2.5. Extraction of collagen by using immobilized pepsin
The extraction conditions were selected as follows: 1.0 g of pretreated bovine hide powder was placed in 125 mL of 0.5 mol L−1 of acetic acid at 25 °C for 2 h to swell and disperse the hide powder. To cleave the terminal domains of collagen, 100 mg of immobilized pepsin was added and incubated for 24 h. Then, the solution was centrifuged at 10![[thin space (1/6-em)]](https://www.rsc.org/images/entities/char_2009.gif) 000 rpm for 20 min to collect the supernatant. The resulting pellet was then incubated with 125 mL of 0.5 mol L−1 of acetic acid for 24 h and centrifuged to collect the supernatant. The pH value of the supernatant was adjusted to 7.0 with 5.0 mol L−1 of NaOH solution, and then sodium chloride was gradually added to a final concentration of 2.5 mol L−1 for salting out the type I collagen. The suspension was centrifuged at 10
000 rpm for 20 min to collect the supernatant. The resulting pellet was then incubated with 125 mL of 0.5 mol L−1 of acetic acid for 24 h and centrifuged to collect the supernatant. The pH value of the supernatant was adjusted to 7.0 with 5.0 mol L−1 of NaOH solution, and then sodium chloride was gradually added to a final concentration of 2.5 mol L−1 for salting out the type I collagen. The suspension was centrifuged at 10![[thin space (1/6-em)]](https://www.rsc.org/images/entities/char_2009.gif) 000 rpm for 15 min. The extracted collagen was collected and dissolved in 0.5 mol L−1 of acetic acid for 24 h under magnetic stirring. After centrifugation at 5000 rpm for 10 min, the supernatant was dialyzed using 0.05 mol L−1 of acetic acid for 1–2 days. After dialysis, the samples were lyophilized and stored at 4 °C, which were designated as PIEC. As controls, collagens extracted using acetic acid alone and the acetic acid-free pepsin method were designated as AEC and PEC, respectively.
000 rpm for 15 min. The extracted collagen was collected and dissolved in 0.5 mol L−1 of acetic acid for 24 h under magnetic stirring. After centrifugation at 5000 rpm for 10 min, the supernatant was dialyzed using 0.05 mol L−1 of acetic acid for 1–2 days. After dialysis, the samples were lyophilized and stored at 4 °C, which were designated as PIEC. As controls, collagens extracted using acetic acid alone and the acetic acid-free pepsin method were designated as AEC and PEC, respectively.
SDS-PAGE of the extracted collagens was performed using a Bio-Rad Mini-PROTEAN tetra cell electrophoresis instrument (Bio-Rad, USA). Circular dichroism (CD) spectra were recorded on an MOS-500 CD spectrophotometer (Bio-Logic, France). Cells with a path length of 1 mm were used, and the scanning wavelength was in the range of 190–250 nm. Samples were prepared at a concentration of 0.5 mg mL−1 in 0.1 mol L−1 of acetic acid at pH 2.9. The powder X-ray diffraction (PXRD) profiles of the lyophilized collagen samples were collected using an X' Pert Pro MPD DY129 X-ray diffractometer employing Cu Kα radiation (1.54 Å) and scanning over a 2θ range from 5 to 35°.
3. Results and discussion
3.1. Characterization of immobilized pepsin
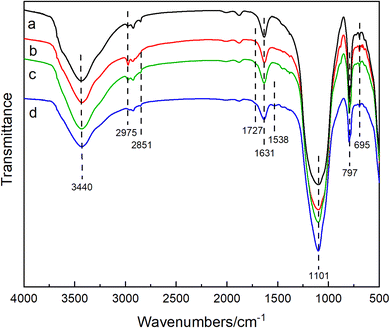
The FT-IR spectra of the modified silica support and immobilized pepsin are shown in Fig. 2. For the SC (Fig. 2a), the bands at 3440 cm−1 and 1631 cm−1 are characteristic absorption peaks associated with the –OH stretching and bending vibration of Si–OH.31 The peaks at 1101 cm−1 and 797 cm−1 can be ascribed to the strong antisymmetric and symmetric stretching vibrations of Si–O–Si, respectively. Moreover, the band at 695 cm−1 can be ascribed to an asymmetric O–Si–C stretching mode. For A-SC (Fig. 2b), the two bending vibration peaks of –CH2 and –CH3 could be observed at 2975 cm−1, implying that the APTES was successfully coated onto the support.34 Moreover, the peaks at 1727 cm−1 and 2851 cm−1 correspond to the C![[double bond, length as m-dash]](https://www.rsc.org/images/entities/char_e001.gif) O and C–H stretching vibrations of glutaraldehyde, respectively (Fig. 2c). By comparison with Glu-A-SC, as shown in Fig. 2d (Pep-Glu-A-SC), a new absorption band at 1538 cm−1 arises due to the amide II, which is a typical feature of a protein35. The results indicate that pepsin was successfully immobilized onto Glu-A-SC.
O and C–H stretching vibrations of glutaraldehyde, respectively (Fig. 2c). By comparison with Glu-A-SC, as shown in Fig. 2d (Pep-Glu-A-SC), a new absorption band at 1538 cm−1 arises due to the amide II, which is a typical feature of a protein35. The results indicate that pepsin was successfully immobilized onto Glu-A-SC.
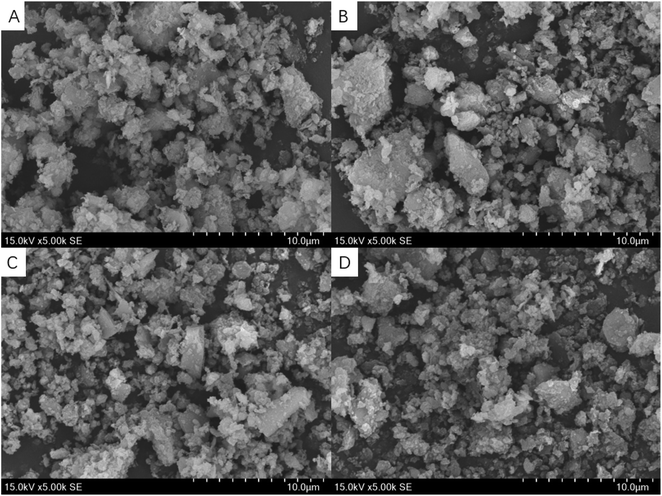
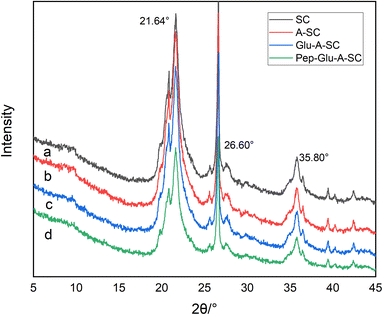
The SEM images show the typical irregular sheet structure of SC, with thick aggregates and multiple folds on its surface (Fig. 3a). As for A-SC and Glu-A-SC, the support appears to decrease the thickness of the SC, and the functional modification increases the interlayer space of the SC, showing fine spherical particles with good dispersibility (Fig. 3b and c). In Fig. 3d, it can be seen that more tiny particles were agglomerated on the surface, suggesting that pepsin was well-bonded onto the surface of support. Table 1 shows the specific surface areas of SC, A-SC, Glu-A-SC and Pep-Glu-A-SC. After APTES modification and glutaraldehyde crosslinking, the specific surface area of the support decreased from 79 m2 g−1 to 65 m2 g−1, while after immobilization with pepsin, the specific surface area further decreased to 54 m2 g−1. The results thus illustrate that the surface modification process and immobilization might destroy the porous structures. The XRD profile of SC has characteristic peaks within the 2θ range of 15°–30° (Fig. 4a). The peaks at 2θ = 21.64° and 2θ = 26.60° are the diffraction peaks of SiO2, which are consistent with previous reports.31 After APTES modification, these typical peaks were maintained (Fig. 4b). As for Glu-A-SC and Pep-Glu-A-SC (Fig. 4c and d), the 2θ values corresponding to the two characteristic peaks were slightly reduced, which proved that the intermolecular distance of the silica layer increased. The XRD patterns indicate that the modification and immobilization processes has no effect on the crystal structure of the support.
| Sample | SC | A-SC | Glu-A-SC | Pep-Glu-A-SC |
|---|---|---|---|---|
| Specific surface area (m2 g−1) | 79.17 | 67.24 | 65.04 | 54.89 |
| N (%) | 0.20 | 0.66 | 0.79 | 1.05 |
| C (%) | 0.22 | 1.95 | 2.81 | 3.89 |
| H (%) | 0.68 | 0.90 | 1.13 | 1.19 |
| S (%) | 0 | 0 | 0 | 0.08 |
The elemental content of N, C, H, and S in SC, A-SC, Glu-A-SC and Pep-Glu-A-SC are shown in Table 1. Pure SC contains a small amount of N and C, which indicates that the silica clay used contained certain organic components.31 Compared to pure SC, the elemental contents of N, C, and H of A-SC, Glu-A-SC and Pep-Glu-A-SC increased significantly, which should be attributed to the successful introduction of APTES. Furthermore, after immobilization with pepsin, 0.08% of elemental S content could be observed on Pep-Glu-A-SC, illustrating that the sulfur-containing pepsin was successfully immobilized onto the support.
3.2. Factors affecting the immobilization process
A highly activated glutaraldehyde support may have three different interactions with proteins (hydrophobic, ion exchange and covalent interactions). Immobilization of an enzyme via ion exchange has a positive effect on its stability, therefore the twisted deactivation of the enzyme would also be slowed.30 Ferreira41 reported that the use of glutaraldehyde was beneficial to the reticulation between pepsin molecules and could improve the overall activity of pepsin. Monsan42 showed that it was possible to modify the main amino group in the support with just one or two glutaraldehyde molecules or by allowing uncontrolled polymerization of glutaraldehyde. The optimal reactivity of the glutaraldehyde preactivated support against the primary amino group was obtained when two glutaraldehyde molecules were introduced into each amino group in the support.
However, the stability of the glutaraldehyde was relatively low.43 Since there were only two major amino residues on pepsin, even if the pepsin on the glutaraldehyde preactivated support was covalently immobilized, it took a long time to obtain maximum multipoint covalently immobilization.44 Furthermore, due to the high loading of pepsin immobilized with modified SC, it could be speculated that the diffusion rate of pepsin was faster than the immobilization rate during the immobilization process, which was similar to the results shown in Fig. 5d. The introduction of glutaraldehyde changed the molecular conformation of the enzyme to a certain extent and reduced the immobilized enzyme activity.27 Moreover, due to the irreversible denaturation of pepsin under neutral and alkaline conditions, the Schiff base generated by the reaction of glutaraldehyde with pepsin may be unstable,44 and pepsin molecules might be absorbed into the porous structure. Under these conditions, the pepsin molecules are very close to each other, and if two reactive groups meet, these molecules are cross-linked, in some cases reinforcing the stabilization effect.
The results showed the load of pepsin immobilized by the modified SC support was close to 220 mg g−1. Since the lack of a primary amino group on pepsin (only one Lys residue), adsorption between the porous SC support and pepsin should occur in addition to a certain extent of covalent cross-linking with glutaraldehyde.45 The NH2 and C![[double bond, length as m-dash]](https://www.rsc.org/images/entities/char_e001.gif) O groups of pepsin interact with the silanol groups on the SC support.26 In summary, the optimal process conditions for the immobilization of pepsin onto modified SC were found to be incubation of an initial pepsin concentration of 35 mg mL−1 and a glutaraldehyde concentration of 5% at 25 °C for 60 min, by which the loading amount of pepsin was 220 mg g−1. The activity of the immobilized pepsin was 4.2 U mg−1.
O groups of pepsin interact with the silanol groups on the SC support.26 In summary, the optimal process conditions for the immobilization of pepsin onto modified SC were found to be incubation of an initial pepsin concentration of 35 mg mL−1 and a glutaraldehyde concentration of 5% at 25 °C for 60 min, by which the loading amount of pepsin was 220 mg g−1. The activity of the immobilized pepsin was 4.2 U mg−1.
3.3. Enzymatic properties of immobilized pepsin
Fig. 6a shows the pH dependence of the free and immobilized enzyme activities. The maximum enzyme activity measured was 100%. Both enzymes decreased with an increase in solution pH, and showed a maximum activity when the pH was 2. At pH 7.0, neither free nor fixed pepsin showed any activity. | ||
| Fig. 6 Effect of (a) pH, (b) temperature and (c) time on the enzyme properties of the immobilized pepsin. | ||
The most reasonable explanation for the irreversible denaturation of pepsin above pH 6.0 is N-terminus specific denaturation caused by the carboxyl ionization of some residues in the neutral and alkaline ranges.27,46 However, for immobilized pepsin, the mutual aggregation of the support prevented the substrate from approaching the active site of the pepsin, which reduced the stability of the multi-point covalent immobilization of the pepsin in an unsuitable pH environment, and even prevented the immobilization of the pepsin, resulting in a sharp decrease in its activity. Fig. 6b shows the influence of temperature on the activity of free and immobilized pepsin at pH 2.0. The activity of immobilized pepsin was relatively high in the range of 20–40 °C, and maximum hydrolysis activity was reached at 30 °C, while free pepsin had high activity in the range of 20–50 °C and reached a maximum at 40 °C. This is consistent with that reported by David.32 The change in the optimum temperature may be related to the binding of pepsin onto the support surface.27 Compared with the free enzyme, the decrease in the optimal temperature of the immobilized enzyme may be due to the change in the enzyme conformation by the covalent bonds formed by the amino groups, thus affecting the temperature tolerance. Moreover, when the pepsin is crosslinked with glutaraldehyde on the surface of the support, it may adsorb to the silica. Different from immobilized lipase, these conditions will inhibit the activity of pepsin to a certain extent. The results showed that the immobilized pepsin needs to be conducted at a lower temperature to maximize the expansion of the interface of the enzyme to achieve good recognition and binding of substrate molecules. Gamze47 immobilized porcine pepsin on chitosan beads and observed the high stability of the immobilized enzyme at 40–50 °C. Free pepsin showed high stability at 40 °C. Therefore, the activity of the enzyme will be very different while the enzyme immobilized by different immobilization methods and supports.
Fig. 6c studied the thermal stability activities of the free and immobilized enzymes stored at 50 °C at pH 2, under acidic conditions for 0–12 h. The results showed that both enzymes maintained high activity before the 8 h of incubation. The relative activity of immobilized and free enzymes reached a maximum at around 5 h. The immobilized pepsin was inactivated after 11 h, while the free enzyme retained about 30% activity at 12 h. The results showed that the free and immobilized pepsin were stable at 50 °C.
However, compared with the characteristics of free enzymes, the activity characteristics of pepsin changed after immobilization. The correlation between enzyme stability and activity is very complex and inverse. It is not always possible to achieve 100% of recovered activity of the enzyme after the immobilization process.48 The activity of pepsin was closely related to the orientation of the active center. Glutaraldehyde directly immobilized pepsin on the pre-activated support, with a change in the orientation of the enzyme to some extent.27,39,49 Therefore, the load of immobilization was higher, and the chance for pepsin molecules to react with substrates may be smaller.
Furthermore, a certain amount of pepsin was adsorbed onto the inner surface of the porous support, and the spatial structure of pepsin may have been distorted.50 Even though the support retained its ability to interact with pepsin44, the molecules gathered together to a certain extent and exhibited no mobility, resulting in additional steric hindrance. Haresh indicated that the low catalytic activity of hemoglobin as a substrate can be attributed to the fact that the hemoglobin macromolecule is a large substrate that cannot reach the inner pores of SC.26 The substrate could only interact with pepsins attached to the surface of the support, which confirmed that pepsin was primarily adsorbed within the pores. Santos9 found that the activity value of free enzymes was higher since they have greater mobility in the solution. The thermal stability of the immobilized pepsin was affected greatly at a higher temparature in compasion to the free enzyme.
3.4. Application of immobilized pepsin for collagen extraction
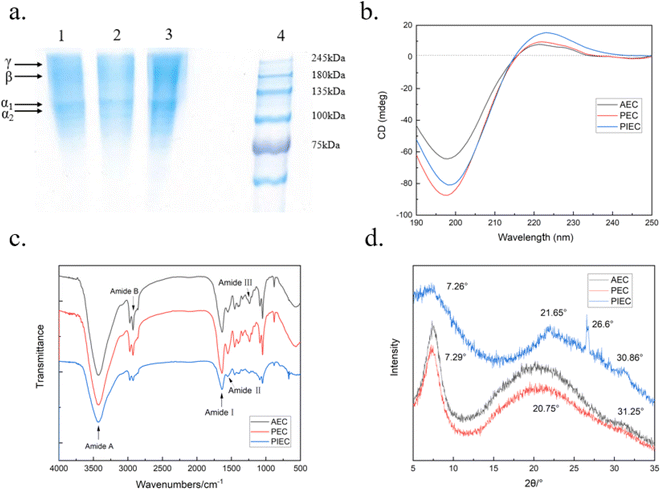
The immobilized pepsin was separated from the extraction mixture via centrifugation. The supernatants were collected and salted out. Then the collected protein was dialyzed for 3–5 days, followed by lyophilization. The collagen extracted by acetic acid and immobilized pepsin was designated as PIEC.SDS-PAGE profiles show that the α1 and α2 chains of the collagen molecule are clear for collagens extracted using acetic acid (AEC), acetic acid-free pepsin (PEC), and acetic acid-immobilized pepsin (PIEC), indicating that the triple helical structure of the collagen was retained (Fig. 7a). Compared with PEC, PIEC exhibits fewer degraded bands, demonstrating a lower degree of degradation using immobilized pepsin45,51. The circular dichroism (CD) profiles of the collagen samples are shown in Fig. 7b. A negative peak at 198 nm and a positive peak at 223 nm for the extracted collagens are characteristic of collagen triple helix conformation detected by CD,14 where the Rpn values of AEC, PEC, and PIEC are 0.12, 0.11, and 0.18, respectively, indicating that all three samples retained the unique secondary structure of collagen.52 The FTIR spectra show bands appeared 3422 cm−1 and 2923 cm−1, which can be ascribed to amides A and B, respectively (Fig. 7c). The bands at 1636 cm−1, 1554 cm−1 and 1238 cm−1 can be ascribed to the amide I, II and III bands of collagen, respectively.53 The ratios of the AEC, PEC and PIEC amide III bands to the absorbance at 1450 cm−1 (AIII/A1450) were 0.984, 0.983 and 1.005, respectively, which further indicated the integrity of the triple helix structure.54 The 2θ profile of PIEC with peaks at 7.26° and 21.65° is typical of collagen (Fig. 7d). Furthermore, an indistinct characteristic peak also appeared at around 30°, implying that the extracted collagen self-assembled into fibrils during the lyophilizing process.55
4. Conclusions
In summary, to prepare immobilized pepsin, a covalent immobilization method was carried out by using glutaraldehyde with pepsin and APTES modified silica clay. FTIR, SEM and elemental analysis results confirmed that the immobilized pepsin was successfully prepared. The optimal immobilization conditions of the pepsin were obtained under experimental conditions by incubating 35 mg mL−1 of pepsin and 5% glutaraldehyde with A-SC at 25 °C for 90 min. The loading amount of pepsin reached 220 mg g−1 and the activity of the immobilized pepsin was 4.2 U mg−1. The optimum pH of the free and immobilized enzymes was 2.0, and both showed good activity under acidic conditions. The collagen extracted by the immobilized pepsin retained a good triple helix structure.Conflicts of interest
There are no conflicts to declare.Acknowledgements
The authors are grateful for the support of the Natural Science Foundation of China (No. 22178231).References
- J. Chen, G. Wang and Y. Li, Mar. Drugs, 2021, 19, 597 CrossRef CAS PubMed.
- T. A. T. Araújo, A. de Souza, A. F. Santana, A. R. C. Braga, M. R. Custódio, F. R. Simões, G. M. Araújo, A. Miranda, F. Alves, R. N. Granito, N. Yu and A. C. M. Renno, Membranes, 2021, 11, 522 CrossRef PubMed.
- A. K. M. Asaduzzaman, A. T. Getachew, Y. J. Cho, J. S. Park, M. Haq and B. S. Chun, Int. J. Biol. Macromol., 2020, 148, 1290–1297 CrossRef CAS PubMed.
- J. Gross, J. H. Highberger and F. O. Schmitt, Proc. Natl. Acad. Sci. U. S. A., 1955, 41, 1–7 CrossRef CAS PubMed.
- Y. Poojari, A. S. Palsule, S. J. Clarson and R. A. Gross, Silicon, 2009, 1, 37–45 CrossRef CAS.
- M. Rajčanová, M. Tichá and Z. Kučerová, J. Sep. Sci., 2012, 35, 1899–1905 CrossRef PubMed.
- I. A. Dascalu, L. Ignat, M. E. Ignat, F. Doroftei, K. Belhacene, R. Froidevaux and M. Pinteala, Rev. Roum. Chim., 2018, 63, 685–695 Search PubMed.
- M. J. T. Raaijmakers, T. Schmidt, M. Barth, M. Tutus, N. E. Benes and M. Wessling, Angew. Chem., Int. Ed., 2015, 54, 5910–5914 CrossRef CAS PubMed.
- M. P. F. Santos, M. J. P. Brito, E. C. S. Junior, R. C. F. Bonomo and C. M. Veloso, J. Chem. Technol. Biotechnol., 2019, 94, 1982–1990 CrossRef CAS.
- S. Cao, Y. Wang, L. Xing, W. Zhang and G. Zhou, Food Bioprod. Process., 2020, 121, 213–223 CrossRef CAS.
- M. Ye, W. Jia, C. Zhang, Q. Shen, L. Zhu and L. Wang, RSC Adv., 2019, 9, 14627–14637 RSC.
- Y. Zhang, K. Olsen, A. Grossi and J. Otte, Food Chem., 2013, 141, 2343–2354 CrossRef CAS PubMed.
- V. Ferraro, B. Gaillard-Martinie, T. Sayd, C. Chambon, M. Anton and V. Santé-Lhoutellier, Int. J. Biol. Macromol., 2017, 97, 55–66 CrossRef CAS PubMed.
- H. Ju, X. Liu, G. Zhang, D. Liu and Y. Yang, Materials, 2020, 13, 358 CrossRef CAS PubMed.
- S. Techatanawat, R. Surarit, T. Suddhasthira and S. P. Khovidhunkit, Asian Biomed., 2011, 5, 787–798 CAS.
- X. Ran and L. Wang, J. Sci. Food Agric., 2014, 94, 585–590 CrossRef CAS PubMed.
- V. M. Oliveira, C. R. D. Assis, B. A. M. Costa, R. C. A. Neri, F. T. D. Monte, H. M. S. C. V. Freitas, R. C. P. França, J. F. Santos, R. S. Bezerra and A. L. F. Porto, J. Mol. Struct., 2021, 1224, 129023 CrossRef CAS.
- L. Salvatore, N. Gallo, M. L. Natali, L. Campa, P. Lunetti, M. Madaghiele, F. S. Blasi, A. Corallo, L. Capobianco and A. Sannino, Mater. Sci. Eng., 2020, 113, 110963 CrossRef CAS PubMed.
- H. Jafari, A. Lista, M. M. Siekapen, P. Ghaffari-Bohlouli, L. Nie, H. Alimoradi and A. Shavandi, Polymers, 2020, 12, 2230 CrossRef CAS PubMed.
- K. Szałapata, M. Osińska-Jaroszuk, J. Bryjak, M. Jaszek and A. Jarosz-Wilkołazka, Braz. J. Chem. Eng., 2016, 33, 251–260 CrossRef.
- B. Li, J. Zhang, F. Dai and W. Xia, Carbohydr. Polym., 2012, 88, 206–212 CrossRef CAS.
- G. Cheng, P. Chen, Z. G. Wang, X. J. Sui, J. L. Zhang and J. Z. Ni, Anal. Chim. Acta, 2014, 812, 65–73 CrossRef CAS PubMed.
- S. A. Ansari and Q. Husain, Biotechnol. Adv., 2012, 30, 512–523 CrossRef CAS PubMed.
- H. H. Weetall, Appl. Biochem. Biotechnol., 1993, 41, 157–188 CrossRef CAS PubMed.
- E. Kurimoto, T. Harada, A. Akiyama, T. Sakai and K. Kato, J. Biochem., 2001, 130, 295–297 CrossRef CAS PubMed.
- H. G. Manyar, E. Gianotti, Y. Sakamoto, O. Terasaki, S. Coluccia and S. Tumbiolo, J. Phys. Chem. C, 2008, 112, 18110–18116 CrossRef CAS.
- G. Peng, X. Meng, B. Wang, B. Liu and H. Chen, J. Macromol. Sci., Part A: Pure Appl.Chem., 2015, 52, 20–29 CrossRef CAS.
- P. Zucca and E. Sanjust, Molecules, 2014, 19, 14139–14194 CrossRef PubMed.
- R. Morellon-Sterling, O. Tavano, J. M. Bolivar, A. B. Murcia, G. V. Gutierrez, J. S. M. Sabir, V. G. T. Pascacio and R. F. Lafuente, Int. J. Biol. Macromol., 2022, 210, 682–702 CrossRef PubMed.
- T. Jesionowski, J. Zdarta and B. Krajewska, Adsorption, 2014, 20, 801–821 CrossRef CAS.
- T. Zou, Y. Duan, Q. Wang and H. Cheng, Catalysts, 2020, 10, 1266 CrossRef CAS.
- D. Meridor and A. Gedanken, Enzyme Microb. Technol., 2014, 67, 67–76 CrossRef CAS PubMed.
- O. H. Lowry, N. J. Rosebrough, A. L. Farr and R. J. Randall, J. Biol. Chem., 1951, 193, 265–275 CrossRef CAS PubMed.
- H. M. Kayili and B. Salih, Talanta, 2016, 155, 78–86 CrossRef CAS PubMed.
- F. Wang, J. Li, D. Ran, M. Duan, X. Sun and L. Wang, J. Inorg. Mater., 2012, 27, 185–190 CrossRef CAS.
- S. Liu, J. Horak, M. Höldrich and M. Lämmerhofer, Anal. Chim. Acta, 2017, 989, 29–37 CrossRef CAS PubMed.
- C. Wu, J. Lee and W. Lee, Biotechnol. Appl. Biochem., 1998, 27, 225–230 CAS.
- O. Valentova, J. Turkova, R. Lapka, J. Zima and J. Čoupek, Biochim. Biophys. Acta, Enzymol., 1975, 403, 192–196 CrossRef CAS PubMed.
- E. H. Siar, S. A. Peña, O. Barbosa, M. N. Zidoune and R. F. Lafuente, Catalysts, 2018, 8, 149 CrossRef.
- H. Zhang, J. Luo, S. Li, Y. Wei and Y. Wan, Langmuir, 2018, 34, 2585–2594 CrossRef CAS PubMed.
- L. Ferreira, M. A. Ramos, J. S. Dordick and M. H. Gil, J. Mol. Catal. B: Enzym., 2003, 21, 189–199 CrossRef CAS.
- P. Monsan, J. Mol. Catal., 1978, 3, 371–384 CrossRef CAS.
- R. C. Rodrigues, Á. Berenguer-Murcia, D. Carballares, R. Morellon-Sterling and R. Fernandez-Lafuente, Biotechnol. Adv., 2021, 52, 107821 CrossRef CAS PubMed.
- O. Barbosa, C. Ortiz, Á. Berenguer-Murcia, R. Torres, R. C. Rodrigues and R. Fernandez-Lafuente, RSC Adv., 2014, 4, 1583–1600 RSC.
- D. Liu, X. Zhang, T. Li, H. Yang, H. Zhang, J. M. Regenstein and P. Zhou, Food Biosci., 2015, 9, 68–74 CrossRef CAS.
- X. Lin, J. A. Loy, F. Sussman and J. Tang, Protein Sci., 1993, 2, 1383–1390 CrossRef CAS PubMed.
- G. D. Altun and S. A. Cetinus, Food Chem., 2007, 100, 964–971 CrossRef CAS.
- O. L. Tavano, J. Mol. Catal. B: Enzym., 2013, 90, 1–11 CrossRef CAS.
- A. Bódalo, J. Bastida, M. F. Máximo, M. C. Montiel, M. Gómez and M. D. Murcia, Bioprocess Biosyst. Eng., 2008, 31, 587–593 CrossRef PubMed.
- C. Garcia-Galan, Á. Berenguer-Murcia, R. Fernandez-Lafuente and R. C. Rodrigues, Adv. Synth. Catal., 2011, 353, 2885–2904 CrossRef CAS.
- M. Atef, S. M. Ojagh, A. M. Latifi, M. Esmaeili and C. C. Udenigwe, J. Food Biochem., 2020, 44, e13256 CrossRef CAS PubMed.
- S. E. Moujahed, F. Errachidi, H. A. Oualid, A.-V. Botezatu-Dediu, F. O. Chahdi, Y. K. Rodi and R. M. Dinica, RSC Adv., 2022, 12, 4175–4186 RSC.
- S. Upasen, K. Naeramitmarnsuk, C. Antonio, S. Roces, H. Morillas and P. Wattanachai, Eng. J., 2019, 23, 183–195 CrossRef CAS.
- A. A. El-Rashidy, A. Gad, A. E. H. G. Abu-Hussein, S. I. Habib, N. A. Badr and A. A. Hashem, Int. J. Biol. Macromol., 2015, 79, 618–626 CrossRef CAS PubMed.
- Z. Xu, J. Liu, Y. Chen and H. Fan, Food Sci., 2016, 37, 12–16 CAS.
| This journal is © The Royal Society of Chemistry 2022 |

