
 Open Access Article
 This Open Access Article is licensed under a
 Creative Commons Attribution 3.0 Unported Licence
A holistic comparison of flavor signature and chemical profile in different harvesting periods of Chrysanthemum morifolium Ramat. based on metabolomics combined with bioinformatics and molecular docking strategy†
Mengxin Yanga,
Xi Tiana,
Miaoting Zhanga,
Jinhuan Weia,
Yukun Niua,
Jiali Houa,
Yiran Jin*b and
Yingfeng Du *a
*a
aDepartment of Pharmaceutical Analysis, School of Pharmacy, Hebei Medical University, Shijiazhuang, Hebei 050017, P. R. China. E-mail: yingfengdu@hotmail.com; Fax: +86-311-86266419; Tel: +86-311-86265625
bThe Second Hospital of Hebei Medical University, Shijiazhuang, Hebei 050000, P. R. China. E-mail: jinyiran@sohu.com; Fax: +86-311-86266419; Tel: +86-311-86265625
First published on 7th December 2022
Abstract
Taiju and Duoju are products of Hangbaiju (HJ) obtained during different collection periods, and they have been commonly used as ingredients in tea beverages and dietary traditional Chinese medicine. This study reports an integrated strategy based on metabolomics, bioinformatics and molecular docking to further explore the effect of the harvesting period on the metabolic profile and clinical efficacy of HJ. Firstly, gas chromatography-mass spectrometry (GC-MS) and ultra-high performance liquid chromatography-quadrupole time-of-flight mass spectrometry (UHPLC-Q-TOF/MS) were employed for non-targeted metabolomics profiling of essential oils and flavonoids. A sequential window acquisition of all theoretical fragment-ion spectra information-dependent acquisition (SWATH-IDA) bi-directionally verified (SIBDV) method was developed that integrates the advantages of both SWATH and IDA in characterizing flavonoids. Chemometric methods were then used to screen potential chemical markers. Furthermore, HJ is effective in hepatoprotective functions. Therefore, hepatocellular-carcinoma-related differentially expressed genes were obtained using bioinformatics, and the corresponding proteins were molecularly docked with diagnostic chemical markers. In total, 78 volatile oils and 63 flavonoids were tentatively identified. The results allowed the selection of 11 metabolites (5 volatile oils and 6 flavonoids), which are nominated as novel markers for material authentication of Taiju and Duoju. Additionally, two proteins associated with hepatoma were screened using bioinformatics. All six flavonoid markers with binding energies of <−5 kcal mol−1 were considered to be anti-hepatoma biomarkers. Noticeably, in Taiju, the content of hydroxygenkwanin showed a downward trend, but the content of the other five flavonoids and the five flavored volatile difference compounds had an upward trend. This bestows a unique flavor profile on Taiju, leading to differences in sensory aroma and clinical efficacy in Taiju and Duoju. In conclusion, the transformation of secondary metabolites was the dominant trend during HJ growth. These findings lay the foundation for food development and distinguishing clinical applications.
1 Introduction
The flowers of Chrysanthemum morifolium Ramat., Flos Chrysanthemi, which are cultivated in Zhejiang Province as ‘Hangbaiju’ (HJ), have been popular for 2000 years in China as a medicinal and edible cognate.1 The nutritional value of HJ was described and affirmed as early as the Compendium of Materia Medica. HJ is rich in many non-volatile and volatile metabolites that play a substantial role in flavor quality and health functions.2 Various volatile compounds determine the quality of tea aroma; these are composed mostly of diverse volatile compounds in different concentrations.3 There are many non-volatile metabolites, such as flavonoids, amino acids, phenolic acid compounds, etc. Among these, flavonoids have been shown to make a crucial contribution to the anti-inflammatory and hepatoprotective health functions of HJ.4 It is recorded in the Chinese Pharmacopoeia that Chrysanthemum has the effect of clearing the liver and brightening the eyes. Thus, it was used to prevent and treat liver damage.5 It is well-documented that Chrysanthemum extract significantly inhibits the proliferation of HepG2 and MHCC97H cells.6,7 These hepatoprotective effects of Chrysanthemum extract are probably mediated through antioxidative and antiapoptotic pathways.8 HJ, which is grown in the cities of Tongxiang and Jiaxing in the province of Zhejiang, is a cultivar of the Asteraceae family, and is listed as a national geographical indication of product protection.9 There are two main products of HJ, Taiju and Duoju, which are harvested at different times. The sensory differences between Taiju and Duoju have been demonstrated through previous research.10 The research showed that the content of volatile oil was positively correlated with the e-nose response value.11,12 These two types of HJ have unique flavor characteristics, which are closely related to their metabolite composition. In recent years, research on HJ has mainly focused on the qualitative and quantification of several unique components.13,14 However, there is a poor understanding of the differences between products from different harvesting periods, and the harvesting period of Chrysanthemum is not marked in herbal formulas. Hence, there is an impetus to establish a complete quality control technology platform to characterize and distinguish the two medicinal materials.Recent research has revealed that gas chromatography-mass spectrometry (GC-MS) and ultra-high performance liquid chromatography-quadrupole time-of-flight mass spectrometry (UHPLC-Q-TOF/MS) based untargeted metabolomics approaches combined with multivariate analysis can be used to assess food quality in an objective and reliable manner.15–17 Currently, plant metabolomics has the capacity for the comprehensive analysis of herbal compounds, involving the screening of high-throughput compositional data. It could reveal the subtle differences in the kinds of ingredients or contents of ingredients between different plants and find the material basis of metabolic variation.18,19 The combination of UPLC, GC and MS can provide comprehensive information for the qualitative analysis of components.20 Multivariate statistical analysis has also been used to study the statistical regularity of the interdependence of multiple variables in objective things.21,22
Chemometric analysis plays an essential role within the metabolomics research process, as it provides a comprehensive understanding of large data sets in food science and technology.23,24 Chemometric techniques, mainly including principal component analysis (PCA) and orthogonal projection to latent structure discriminant analysis (OPLS-DA),25 are frequently used to deal with this type of data. Additionally, the bioinformatics methodology based on the Gene Expression Omnibus (GEO) database is capable of screening out differential genes from the massive transcriptomics data.26 At the same time, interactions between ligands and receptor active sites can be predicted with the aid of energy-based scoring functions in molecular docking methods, whereby the pharmacological activity of food components can be evaluated.27,28 In short, this is not only a powerful strategy for detecting multiple classes of components as well as screening for differential metabolites but also provides ideas for evaluating bioactive substances.
The accurate mass-to-charge ratios (m/z) recorded in the MS and MS/MS spectra play a critical role in the structure determination of UHPLC-Q-TOF MS samples. Information-dependent acquisition (IDA) and sequential windowed acquisition of all theoretical fragment ions (SWATH) are two distinct methods for selecting precursor ions.29 Traditional IDA methods are typically used to select precursors and acquire MS2 masses, and IDA can theoretically provide a high-quality MS2 spectrum, but requires a longer cycle time and complex settings. Although longer exclusion times help prevent repetitive trigger events for a compound, they may also lead to the loss of active ingredients and reduce MS2 hit rates.30 Recently, a new data-independent acquisition method, variable window acquisition of SWATH mode, has been reported, which can continuously acquire the MS2 spectrum of the entire precursor ions.31 Before the TOF analysis is performed, precursor ions are selected with a variable Q1 mass window width. Compared to the traditional IDA-MS strategy, SWATH could significantly improve the hit rate of low-level and trace metabolites.32
This study aimed to establish a high-throughput screening platform for the classification and identification of Taiju and Duoju through non-target metabolomics based on GC-MS and UHPLC-Q-TOF/MS combined with the chemometrics method. A comprehensive SWATH-IDA bi-directionally verified (SIBDV) method that incorporates the advantages of SWATH along with those of traditional IDA was then used to analyze large amounts of flavonoids in the two herbs. Finally, we analyzed the distribution of volatile oils and flavonoids using OPLS-DA with a heat map visualization. It was possible to clarify the differences and find chemical markers that could distinguish between all Taiju and Duoju batches using the technology platform. In addition, bioinformatics approaches based on the GEO database focused on genes with the greatest differences in expression between the liver cancer disease group and the normal group, which were combined with molecular docking techniques to screen for potential bioactive substances and to find biomarkers that distinguish the clinical efficacy of Taiju and Duoju. This approach is very promising in the development and design of functional HJ foods. The overall workflow chart is shown in Fig. 1.
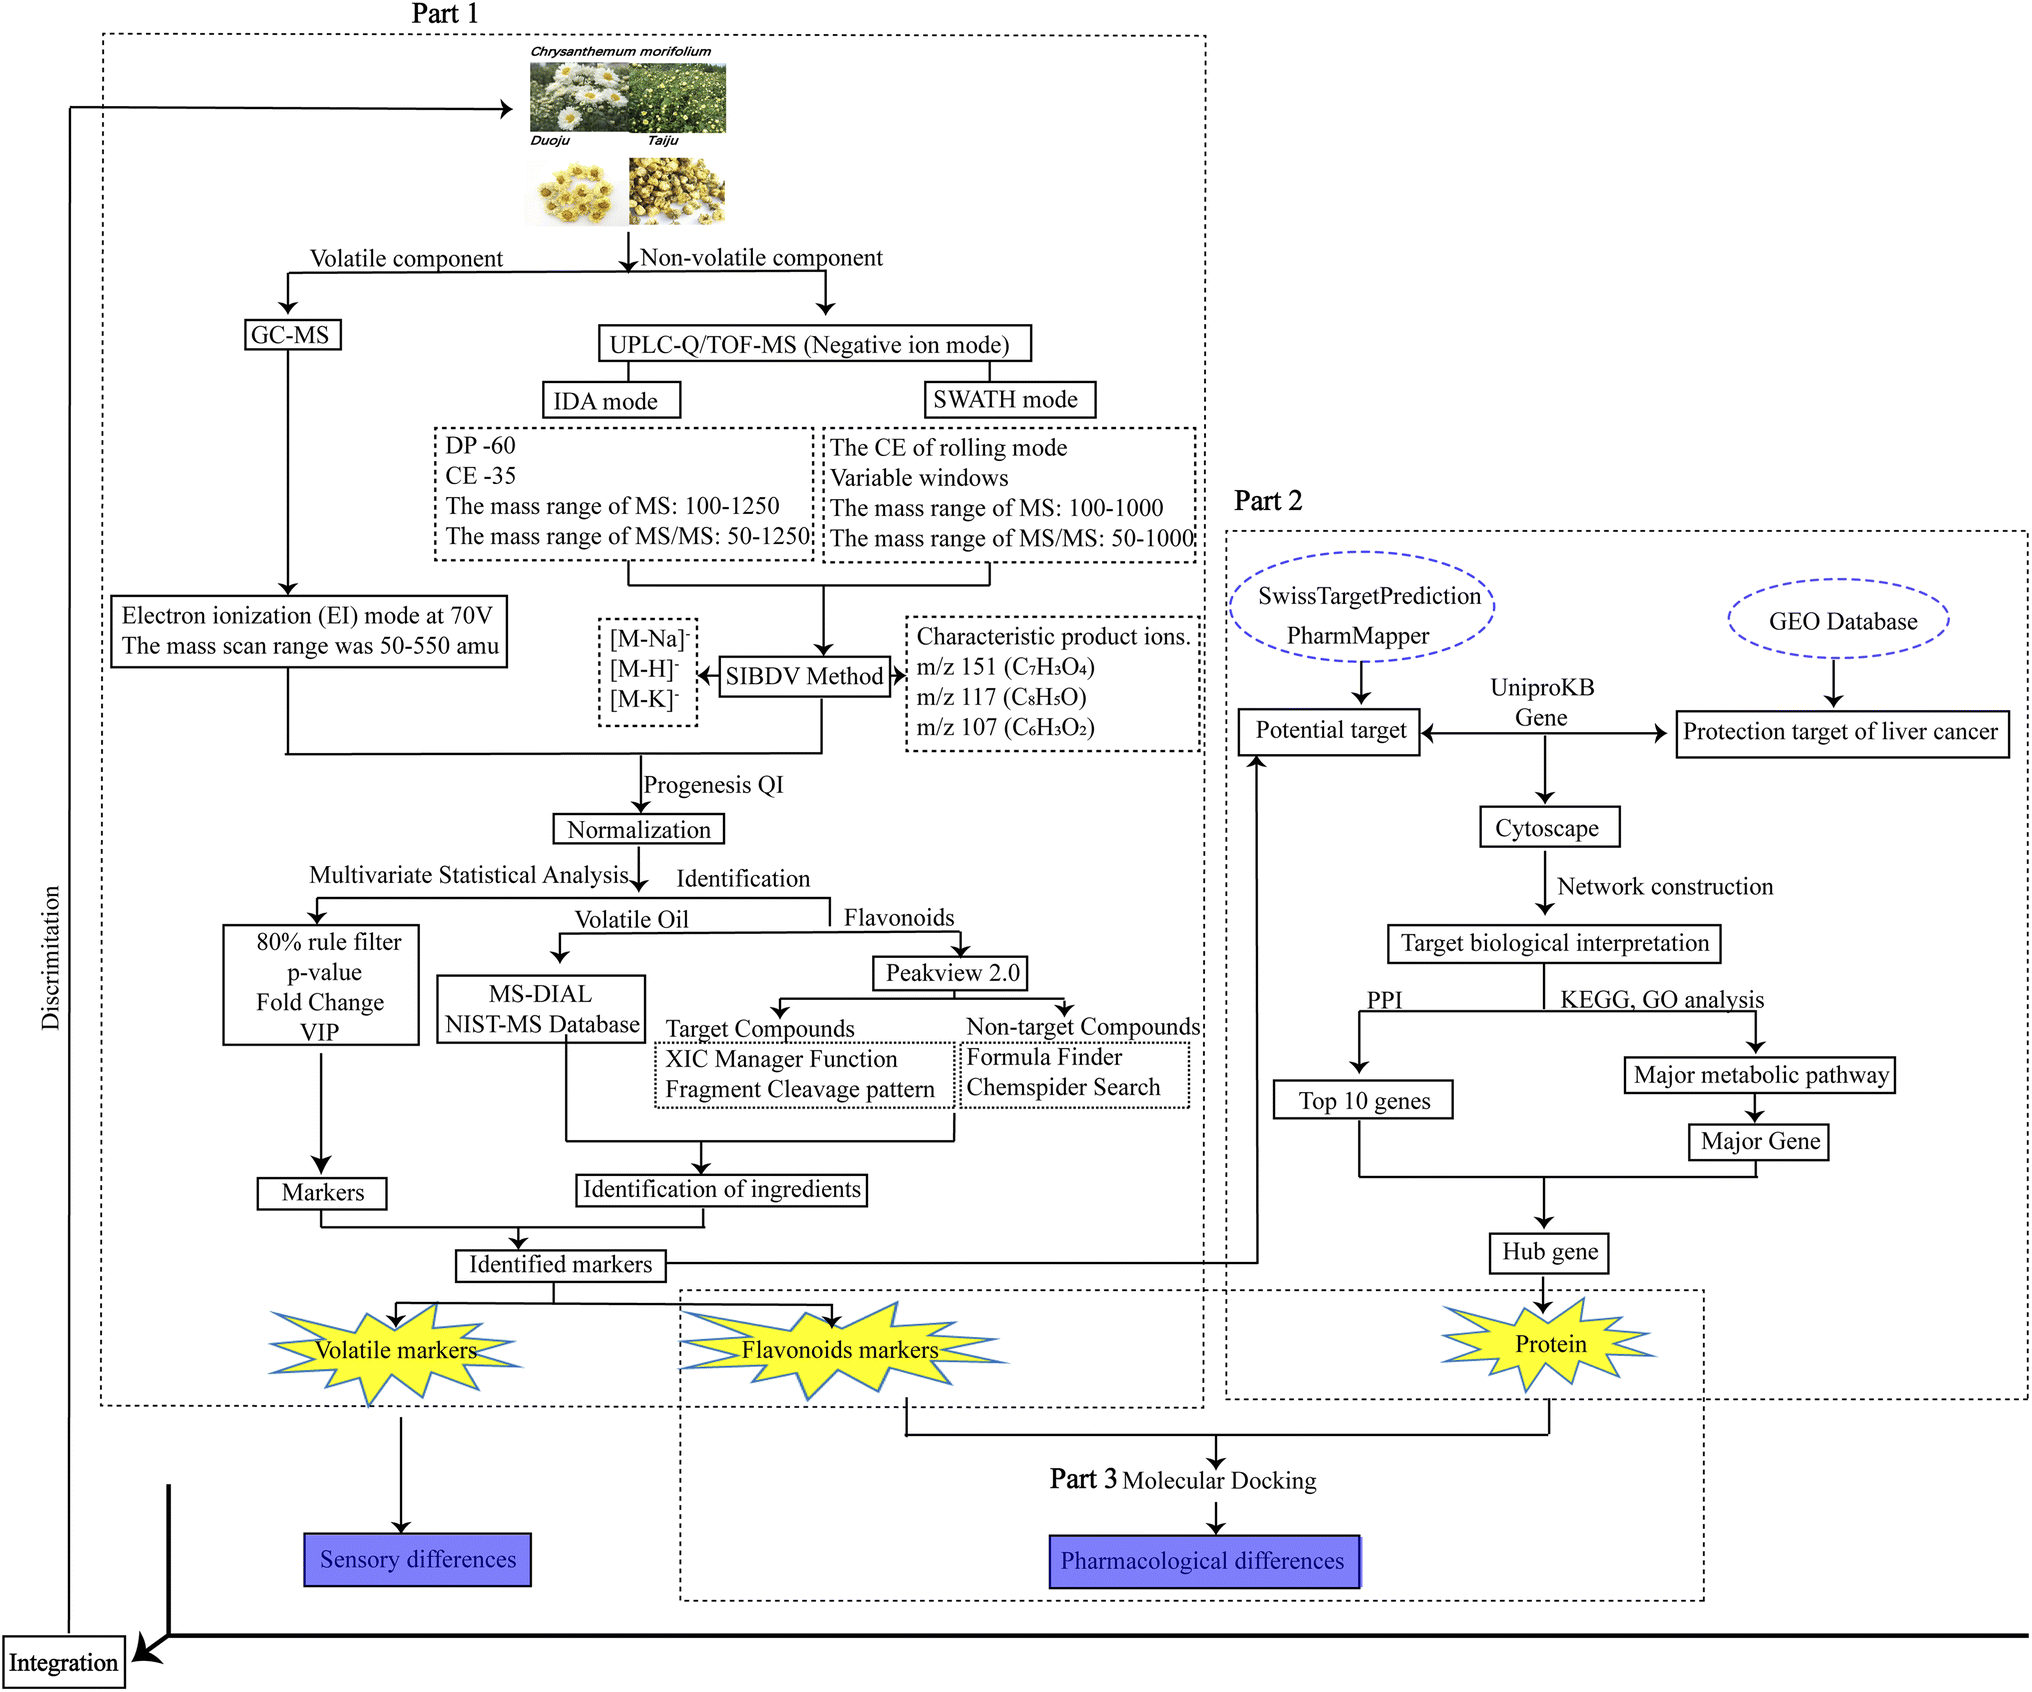 | ||
| Fig. 1 Workflow of the proposed approach for identifying and distinguishing HJ. | ||
2 Materials and methods
2.1 Chemical reagents and materials
HPLC-grade methanol and ethyl acetate were purchased from Tedia (Fairfield, USA). Purified water was supplied by Wahaha Corporation (Hangzhou, China). HPLC-grade formic acid was obtained from Fisher (Fair Lawn, NJ, USA). Anhydrous sodium sulfate (Analytical-grade, Tianjinyongda Chemical Reagent co., Ltd, P. R. China) was used for sample preparation. C7–C30 n-alkanes were purchased from Sigma-Aldrich (number: 49451-U) with 1000 μg mL−1 of each component in n-alkanes. Vitexin (170120), schaftoside (140402), diosmetin (101216), astragalin (101072), kaempferide-7-O-glucoside (20111603), hesperidin (20030407), quercitrin (20031704), quercimeritrin (20113007) and acacetin (20061901) were purchased from the SichuanWeikeqi Biological Technology Co., Ltd (Sichuan, China). Apigenin (ZL10852QCS), isoquercitrin (ZL54745YHP), luteolin (ZL10432MXC) and naringenin (ZL78156YPS) were provided by the Nanjing ZeLang medical technology co., Ltd (Nanjing, China). Baicalin (9SB3-UY4N), isorhamnetin (110860–200406), kaempferol (110861–200405), quercetin (100081–200406) and rutin (100080–200306) were obtained from the National Institute for the Control of Drugs and Biological Products (Beijing, China). Apigenin-7-O-glucuronide (BL18B013) was supplied by the Chengdu Push Bio-technology Co., Ltd (Chengdu, China). The purity of each reference component was no less than 98%.The origin of all plant materials including Taiju and Duoju (28 batches, respectively) was Dongfeng Chrysanthemum Factory in Tongxiang, Zhejiang Province of China. They were authenticated by Professor Jianhua Wang at Hebei Medical University and stored in a desiccator at room temperature. A voucher specimen was deposited in the herbarium of the College of Pharmacy, Hebei Medical University.
2.2 Preparation of samples
A total of 28 batches were powdered to a homogeneous size and sieved through a no. 60 mesh sieve. Twelve of the batches with known classification were used for compositional identification and to search for differential metabolites, and the grouping of the other 16 batches were disrupted to the unknown in advance and then performed to validate the established differentiation model. Then, 30 mL of distilled water was added to 2 g of dry sample. Subsequently, the samples were extracted using a clevenger-type apparatus by hydro-distillation for 3 hours at room temperature. After dissolving the volatile oil in ethyl acetate, anhydrous sodium sulfate was used to dehydrate it. The supernatant was then filtered through a 0.22 μm membrane before being injected for GC-MS analysis. Furthermore, 2 g of dry sample was suspended in 10 mL of 50% MeOH/H2O solution, soaked for 1 h, and extracted with ultrasonication for 0.5 h at room temperature. Then, 50% methanol was added to compensate for weight loss at the end. The sample solution was centrifuged at 12![[thin space (1/6-em)]](https://www.rsc.org/images/entities/char_2009.gif) 000 rpm for 10 min after transferring the supernatant to a 15 mL EP tube. Finally, the supernatant was filtered through a 0.22 μm filter membrane before injection for UHPLC analysis. Additionally, 19 separate stock solutions were prepared by dissolving an appropriate amount of each standard in 50% methanol. Afterward, the final mixed standard solution was prepared by mixing 50 μL of each stock solution. An equal volume of all samples analyzed was mixed for the preparation of pooled quality control (QC) samples to ensure broad metabolite coverage. It was injected throughout the analytical runs to further monitor the stability of the instrument status.
000 rpm for 10 min after transferring the supernatant to a 15 mL EP tube. Finally, the supernatant was filtered through a 0.22 μm filter membrane before injection for UHPLC analysis. Additionally, 19 separate stock solutions were prepared by dissolving an appropriate amount of each standard in 50% methanol. Afterward, the final mixed standard solution was prepared by mixing 50 μL of each stock solution. An equal volume of all samples analyzed was mixed for the preparation of pooled quality control (QC) samples to ensure broad metabolite coverage. It was injected throughout the analytical runs to further monitor the stability of the instrument status.
2.3 GC-MS and UHPLC-Q-TOF/MS analysis
The GC-MS system consisted of an Agilent 7890B GC system and 5977A series mass spectrometer with triple quadrupole (Agilent Technologies, USA). Chromatographic separation was conducted on a DB-17MS capillary column (30 m × 0.25 mm × 0.15 μm). The operating conditions of the GC system were as follows. Helium (99.999%) was the carrier gas with a flow rate of 1 mL min−1 throughout the analysis. The injection volume and split ratio were 5 μL and 10:1, respectively. Injection syringes were immediately washed with 5 μL ethyl acetate before and after each injection. The GC column temperature program was as follows: initially, 50 °C for 2 min, then a gradual increase to 130 °C at a rate of 5 °C min−1, and subsequently, rapid heating at 10 °C min−1 from 130 to 250 °C. For the mass spectrometry detection conditions, an electron ionization (EI) source with an ionization energy setting of 70 eV was used in this study. Temperatures of 260, 230, 150, and 280 °C were set for the injector, ion source, GC/MS interface, and quadrupole, respectively. In the full-scan acquisition mode, the mass range was 50–550 amu with a solvent delay of 3 minutes.
The LC-MS detection was carried out using a SHIMADZU LC-30A system coupled with a hybrid quadrupole time-of-flight tandem mass spectrometer with an electrospray ionization (ESI) interface (AB SCIEX, Triple-TOF 5600+, Foster City, CA, USA). Analytes were separated on a Phenomenex-C18 column (150 mm × 2 mm, 3 μm, Santa Clara, CA, USA) at 40 °C. The mobile phase consisted of 0.1% formic acid in water (A) and acetonitrile (B). The elution gradient was set as follows: 0–3 min, 5–10% B; 3–4 min, 25% B; 4–15 min, 95% B; 15–16 min, an isocratic elution of 95% B with equilibrium for 5 min. The flow rate and injection volumes were 0.3 mL min−1 and 2 μL, respectively. A pre-equilibration of 10 minutes followed to allow the instrument to equilibrate.
The mass spectrometry systems were both operated in negative ion electrospray mode. In IDA mode, the optimal operating conditions of MS were as follows: turbo spray temperature of 550 °C, ion spray voltage of −4500 V, declustering potential (DP) of −60 V, collision energy (CE) of −35 eV and collision energy spread (CES) of 15 eV for MS/MS. In this experiment, nitrogen was used as the nebulizer gas (GAS1), heater gas (GAS2) and curtain gas, which were set at 55, 55 and 35 psi, respectively. For the full MS scanning, the mass range was 100–1250 m/z. For production scanning, the range was from 50–1250 m/z with 0.2 s accumulation time. A total of eight ion precursors were selected from each full MS scan for MS/MS fragmentation, and dynamic background subtraction (DBS) was switched on. In addition, an automated calibration delivery system (CDS) was used every two hours to maintain mass accuracy. In SWATH mode, the scan range of precursor ion m/z was set as 100–1000 Da in full scan mode. The distributions of precursor ions were then used to calculate the SWATH MS acquisition windows using SWATH Variable Window Calculator_V1.0. There were twenty SWATH quadrupole isolation windows ranging from 50 to 1000 Da. The SWATH variable windows are shown in Table S1.† The CE voltage setting of the rolling mode was adopted to ensure high qualitative efficiency for flavonoids.
2.4 Summary of fragmentation patterns from standard compounds
Every standard solution and mixed standard was independently injected into the Triple TOF 5600+ mass spectrometer equipment, and the characteristics of the fragment ions and cleavage laws were determined. The fragmentation patterns of 19 standards were deduced from the TOF MS scan, Q1 scan, product ion scan and precursor ion scan for characterization. The molecular formula and molecular weight of the compound can be attained from the typical solvent adduct ions [M − Na]− and [M − K]− and protonated ion [M − H]−.2.5 Metabolomics analysis
000 amplitudes were selected for peak detection. Peaks with a σ-window value of 0.5 and EI spectral cutoff of 5000 amplitudes underwent a deconvolution operation. The identification parameters were set as follows: m/z tolerance of 0.5 Da, retention time tolerance of 0.5 min, EI similarity cutoff value of 70% and identification score cutoff value of 70%. The alignment parameters of retention time tolerance and retention time factor were set to 0.075 min and 0.5, respectively.Raw data from UHPLC-Q/TOF-MS were processed using Progenesis QI software (Waters, USA) for peak detection, alignment and normalization. Flavonoids were identified as follows. The analytic strategy can be roughly classified into three parts. Firstly, a self-constructed database was constructed to assist in the characterization, including compound name, exact molecular weight and molecular formula.35–38 The fragmentation rules were summarized by analyzing the fragmentation behavior of 19 standards. Secondly, SIBDV was used to determine flavonoid profiles. First, IDA survey scans were initially used to measure chemical components. This was then able to provide a reference for the parameter settings of SWATH mode, obtain the SWATH spectral ion library and calculate the variable window. After that, SWATH was used to search for relevant ions in the low-concentration range, and then more comprehensive flavonoid ion information based on different CE and Q1 isolation windows was obtained. Thirdly, it was combined with the analysis of target compounds and non-target compounds to identify probable compounds. Target compounds were detected using XIC Manager and IDA Explore in PeakView 2.1, which matched mass spectral fragmentation rules of sample chromatograms with features from the in-house chemical library for analysis. The errors of the secondary fragmentation ions were set to 10 ppm. Among them, comparison of the retention times, secondary characteristic fragment ions and exact molecular masses of reference substances can accurately identify the components. Additionally, for no-target compounds, PeakView 2.0 software was employed to speculate potential structures using the search functions of Formula finder and ChemSpider.
2.6 Bioinformatics analysis
In this study, the bioinformatics method was used to analyze differential genes of liver cancer, and the targets of flavonoids were searched for in databases. The predicted targets of the flavonoids were obtained from the following databases: PharmMapper (https://www.lilab-ecust.cn/pharmmapper/) and SwissTargetPrediction (https://www.swisstargetprediction.ch/). The GeneChip of the GSE84402 data set matrix data was downloaded from the GEO public database. Next, the VLOOOKUP function in Excel converted the gene symbols in the annotated probe matrix into gene annotation IDs. The samples of GSE84402 were grouped according to the data for liver cancer and non-cancerous tissues, and then the control group and experimental group were distinguished using Excel. Differential genes were obtained, and volcanoes were plotted using the limma package in R software according to the conditions |logFC| > 1 and P value < 0.005. The genes up-regulated in the experimental group are indicated in red, and the down-regulated genes in green. Subsequently, co-expressed genes were plotted using a Venn diagram. String online software was used to construct PPI network diagrams with a minimum interaction score of >0.400. Afterward, the PPI network was visualized using Cytoscape and the TOP10 genes were obtained using the Cytohubba plugin. Subsequently, hepatocarcinoma genes were screened out using ggplot2 graphs of GO and KEGG bubble maps. Finally, the stereoscopic structures of the core targets were obtained from the RCSB Protein Data Bank (http://www.pdb.org/).
2.7 Molecular docking
To explore the biological activity, the identified markers in the extracts were studied using a molecular modeling approach against liver cancer. The phytocompound ligands were used for molecular docking with the target protein for liver cancer using AutoDockTools-1.5.7 software. In the analysis, the protonation state of the protein was determined by adding hydrogen atoms to the protein structure without considering water molecules. Calculations for this study were conducted using the Lamarckian genetic algorithm.39 Docking effects were evaluated based on binding energies and action sites.3 Results and discussion
3.1 The advantages of the SIBDV online data acquisition method in qualitative studies of TCM
In the present study, a powerful method (SIBDV) based on identical LC and a Triple TOFTM 5600+ mass spectrometer was developed to bi-directionally verify large amounts of data. In particular, the independent data acquisition technology of SWATH was developed with variable Q1 isolation windows and different CEs.40 SWATH can therefore easily enhance the hit rate of the MS/MS spectrum and discover relevant ions in low-concentration ranges, complementing and expanding the data collected through IDA. For instance, the m/z 285.04155 peak of kaempferol in Taiju was identified by SWATH but was not detected in IDA mode due to the low ion response. As shown in Fig. 2 and 3, the base peak chromatograms (BPC) of Taiju and Duoju were obtained via UHPLC-QTOF-MS/MS using each of the two methods. It can be concluded that this method is not only efficient for identifying unknown trace compounds, but also improves the accuracy of the MS2 spectrum and subsequent exploration of chemical markers.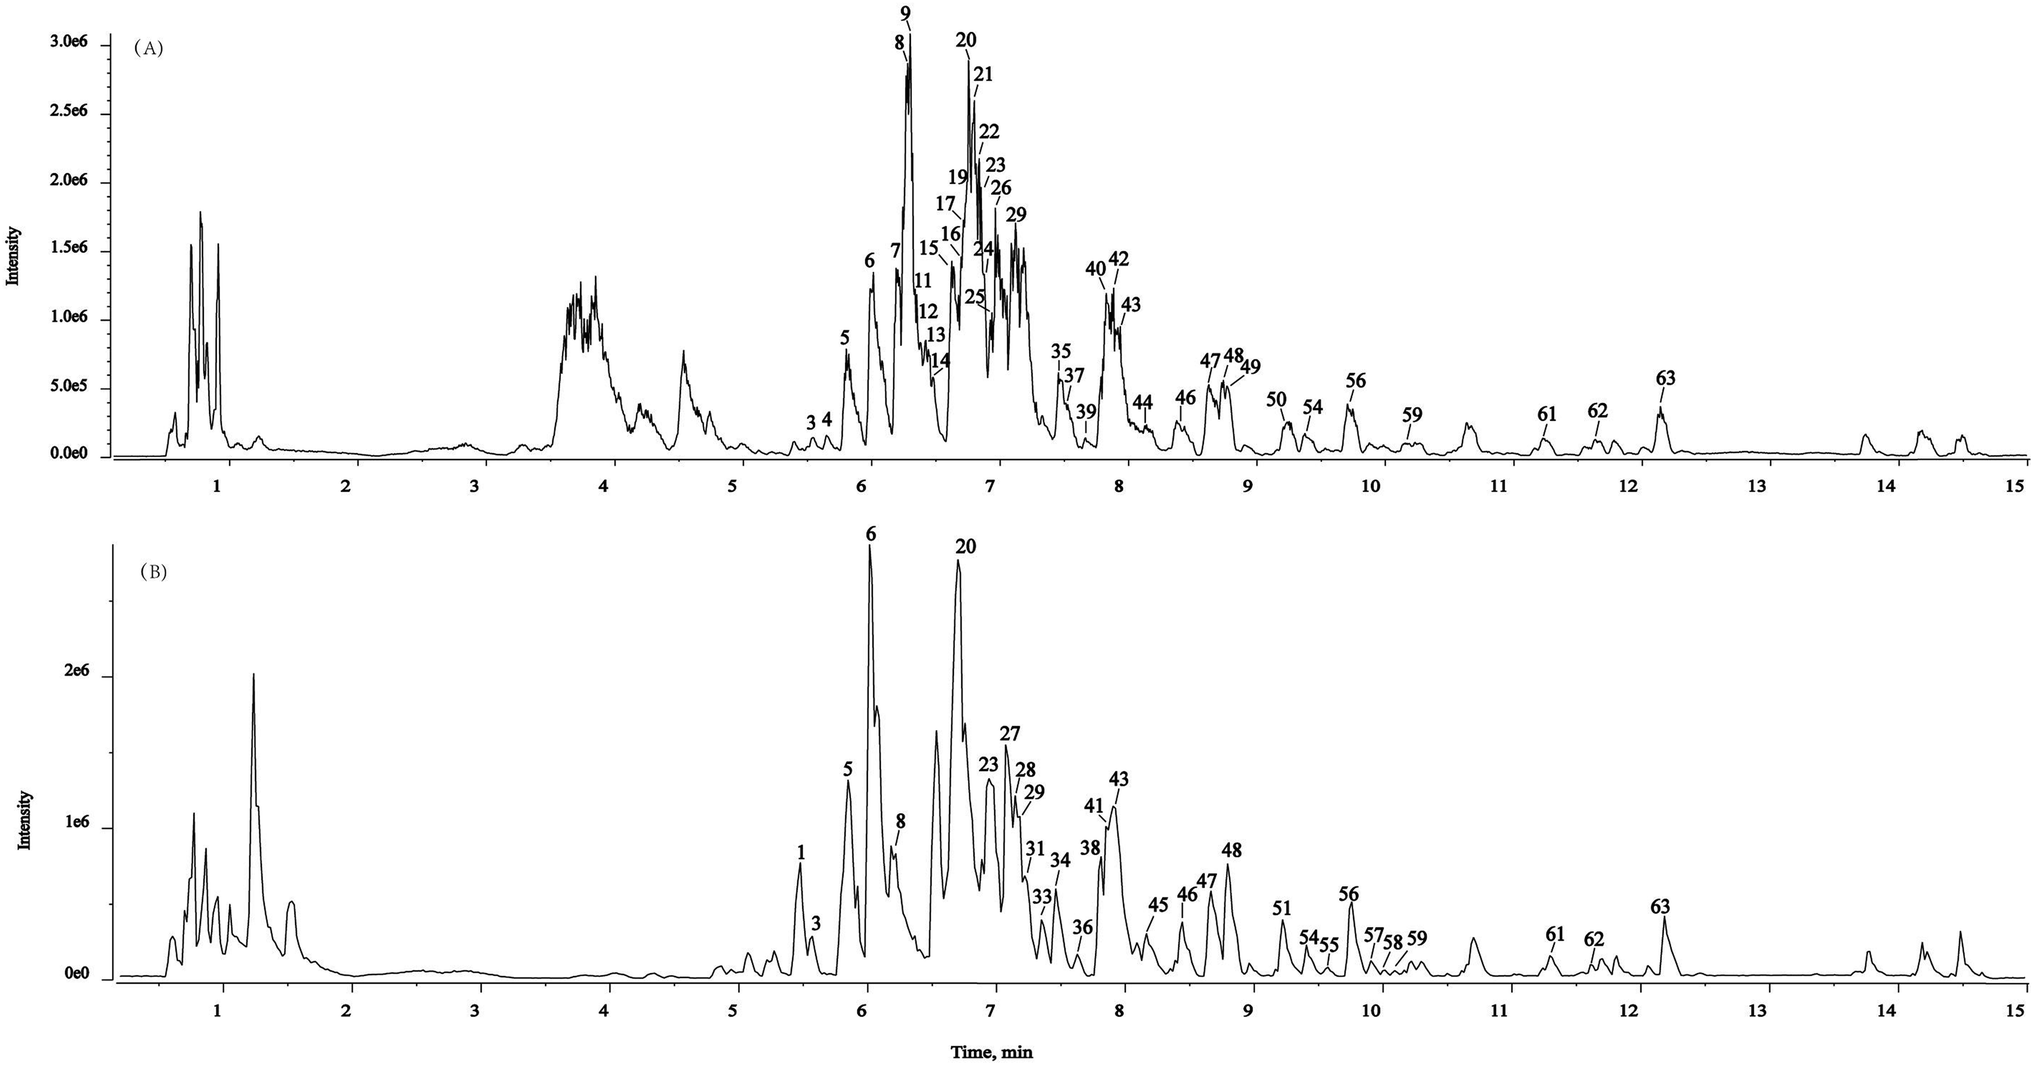 | ||
| Fig. 2 Representative base peak chromatogram (BPC) of Taiju samples acquired in IDA mode and SWATH mode. (A) IDA mode. (B) SWATH mode. | ||
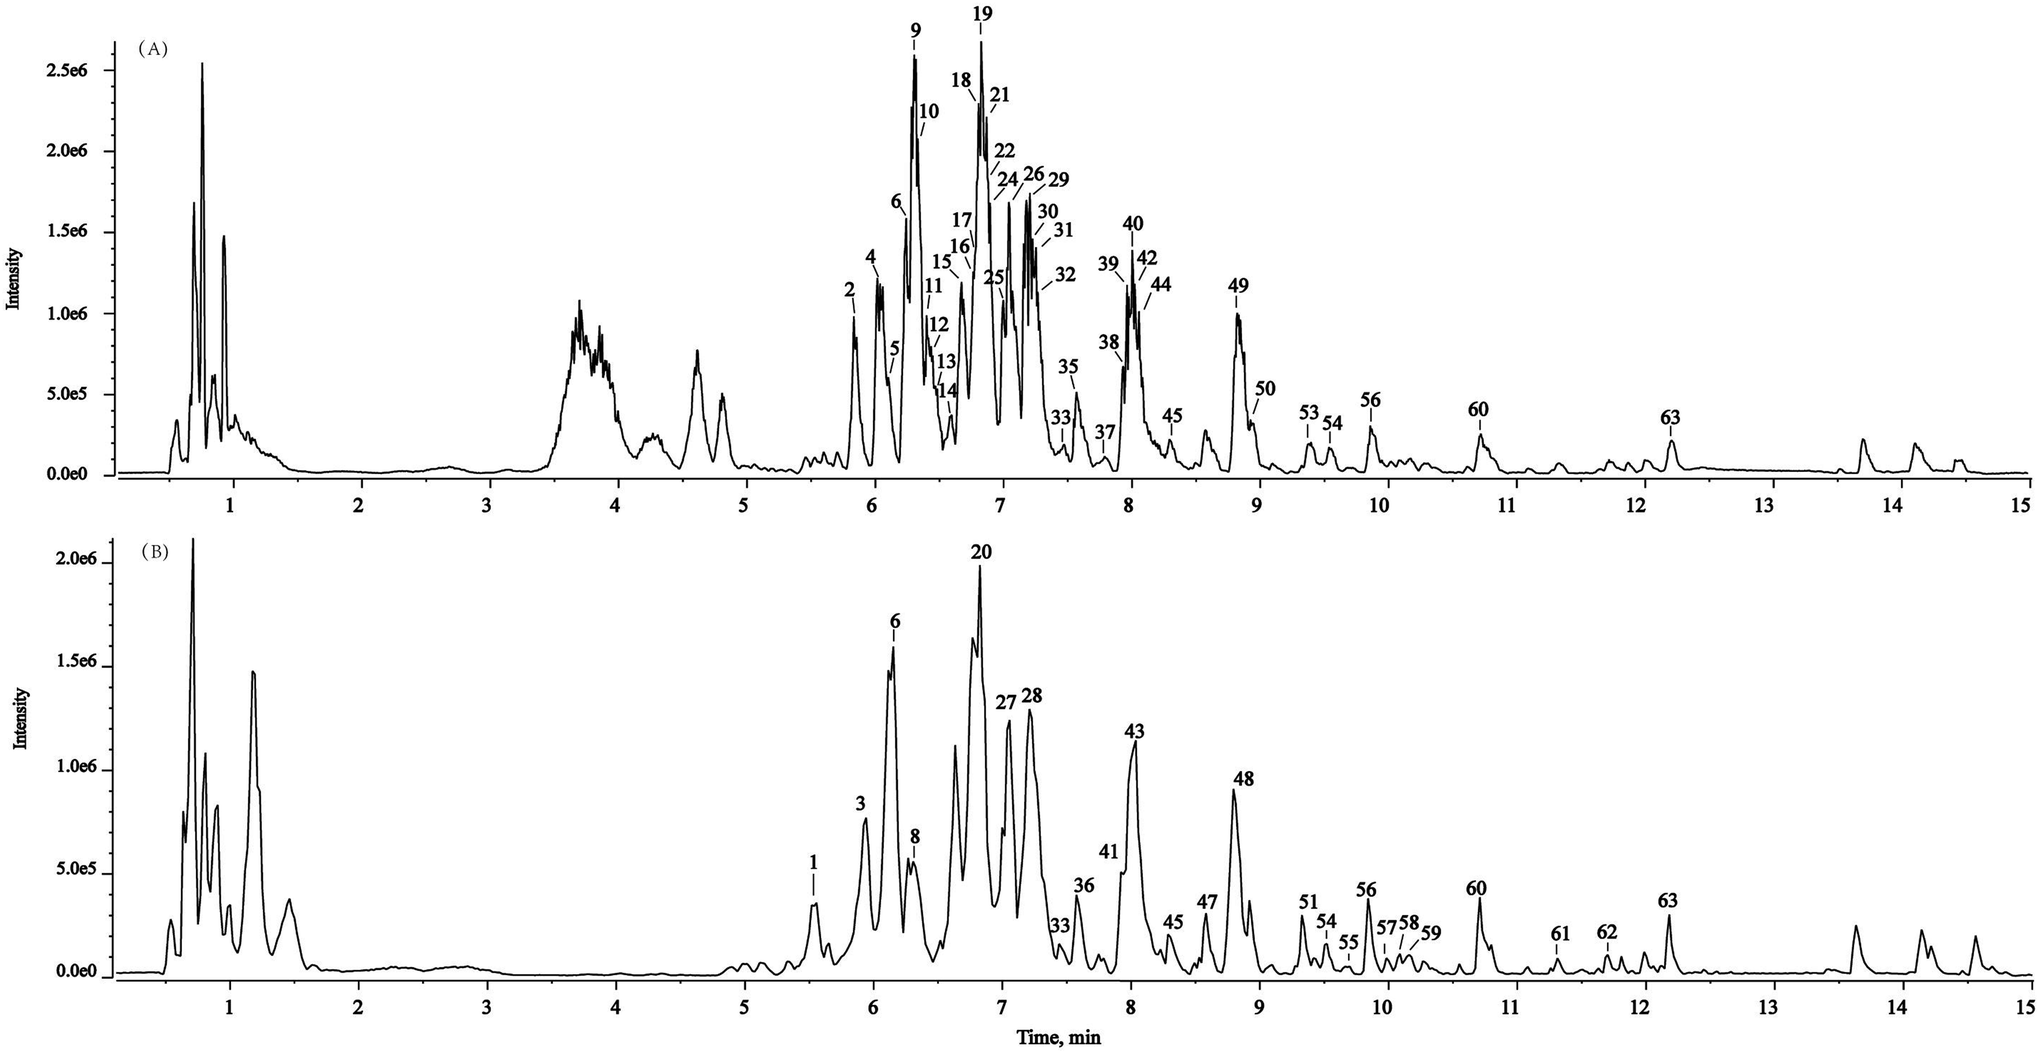 | ||
| Fig. 3 Representative base peak chromatogram (BPC) of Duoju samples acquired in IDA mode and SWATH mode. (A) IDA mode. (B) SWATH mode. | ||
3.2 Identification of the constituents in Taiju and Duoju
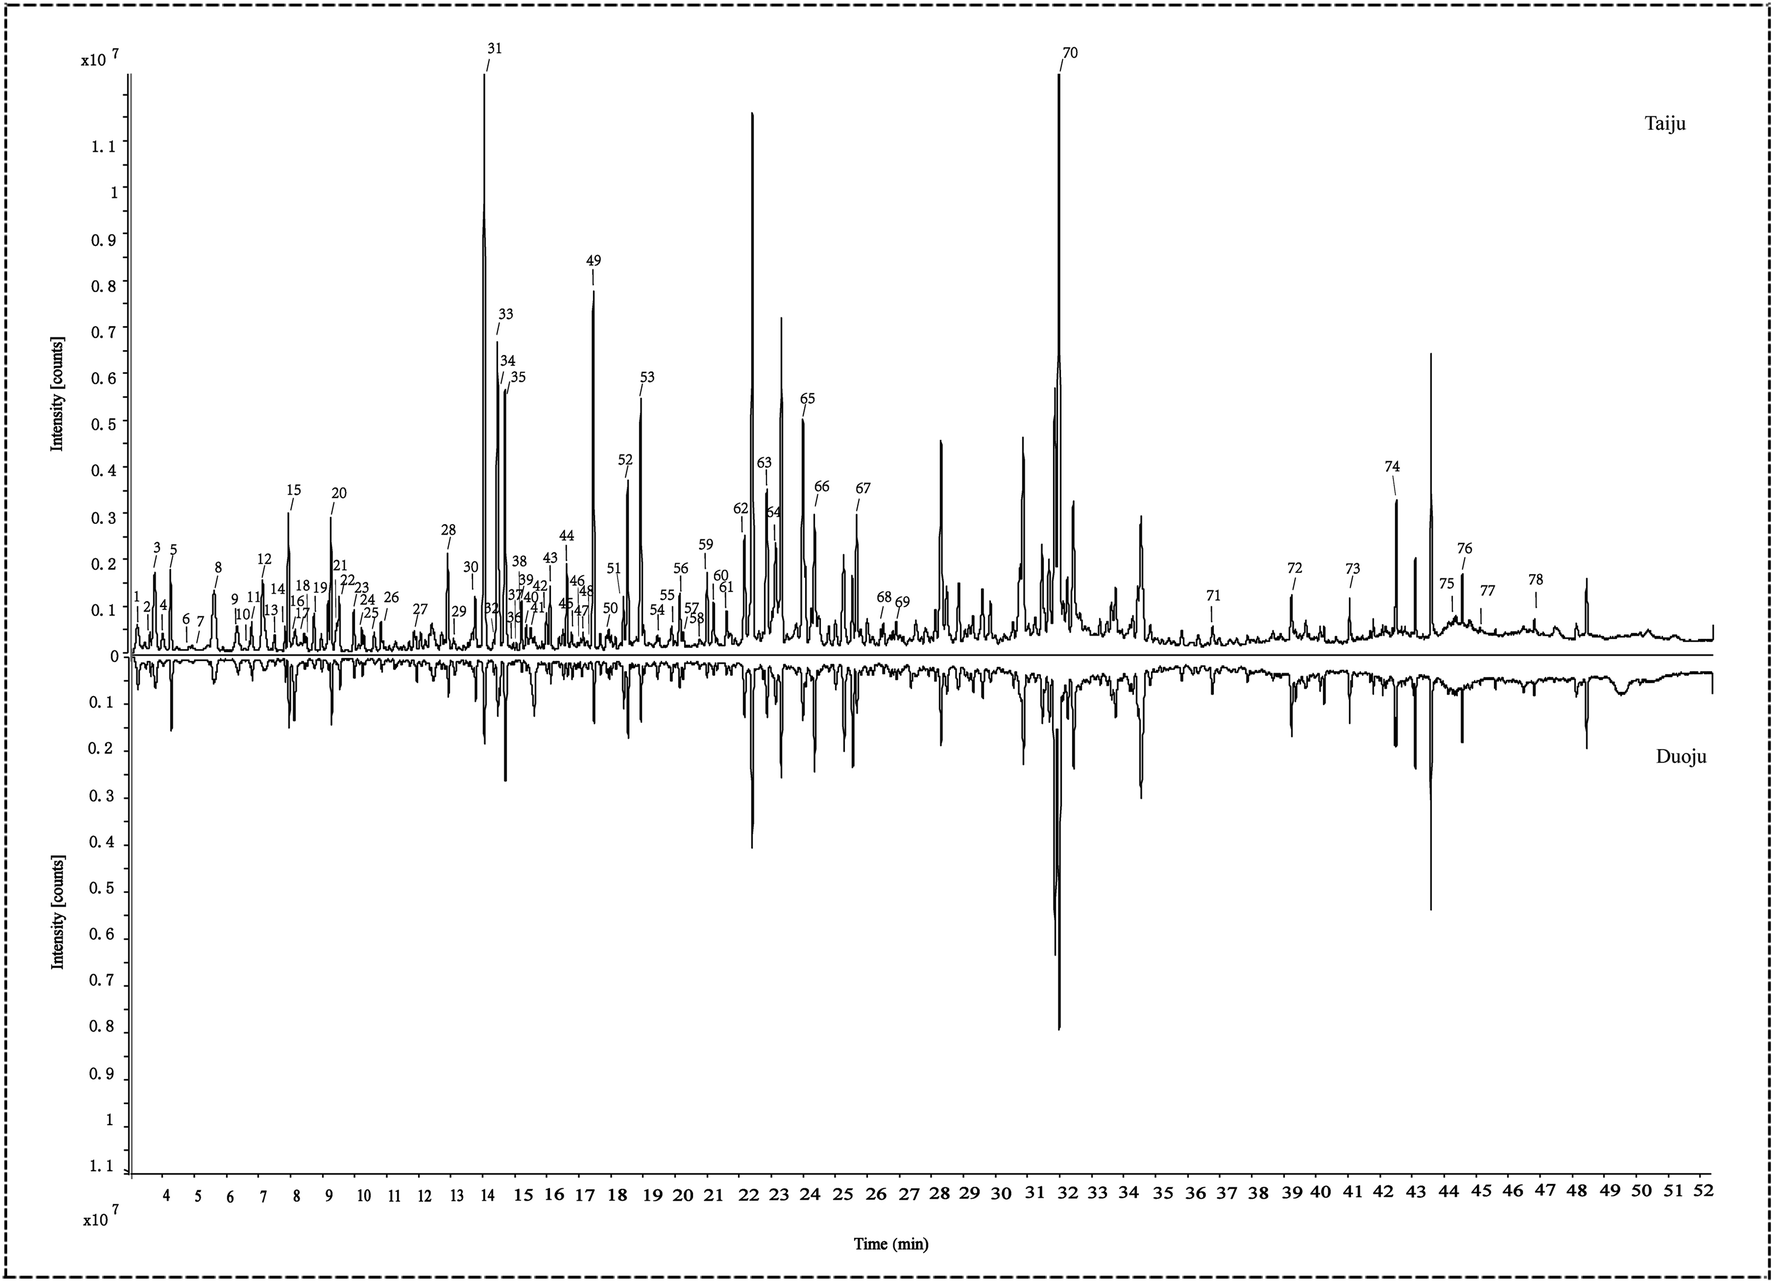 | ||
| Fig. 4 Total ion chromatograms of essential oils identified in Taiju and Duoju using GC-MS. | ||
| No. | tR (min) | CAS | Molecular formula | Identification |
|---|---|---|---|---|
| 1 | 3.188 | 105-46-4 | C6H12O2 | sec-Butyl acetate |
| 2 | 3.431 | 110-19-0 | C6H12O2 | Isobutyl acetate |
| 3 | 3.825 | 637-78-5 | C6H12O2 | Isopropyl propionate |
| 4 | 4.235 | 123-86-4 | C6H12O2 | Butyl acetate |
| 5 | 4.458 | 624-24-8 | C6H12O2 | Valeric acid methyl ester |
| 6 | 5.495 | 108-38-3 | C8H10 | meta-Xylene |
| 7 | 5.554 | 95-47-6 | C8H10 | ortho-Xylene |
| 8 | 5.585 | 3387-41-5 | C10H16 | Sabinene |
| 9 | 6.295 | 13466-78-9 | C10H16 | Carene (delta-3-) |
| 10 | 6.313 | 106-42-3 | C8H10 | para-Xylene |
| 11 | 6.75 | 5989-27-5 | C10H16 | (+)-Limonene |
| 12 | 7.114 | 13877-91-3 | C10H16 | (Z)-β-Ocimene |
| 13 | 7.363 | 1122-58-3 | C7H10N2 | 4-Dimethylaminopyridine |
| 14 | 7.447 | 99-85-4 | C10H16 | Terpinene (gamma-) |
| 15 | 7.983 | 108-94-1 | C6H10O | Cyclohexanone |
| 16 | 8.003 | 98-82-8 | C9H12 | Isopropylbenzene |
| 17 | 8.393 | 586-62-9 | C10H16 | Terpinolene |
| 18 | 8.464 | 111-66-0 | C8H16 | 1-Octene |
| 19 | 8.924 | 622-96-8 | C9H12 | para-Ethyltoluene |
| 20 | 9.135 | 2437-95-8 | C10H16 | β-Pinene |
| 21 | 9.419 | 470-67-7 | C10H18O | 1,4-Cineole |
| 22 | 9.492 | 1998/6/6 | C10H14 | tert-Butylbenzene |
| 23 | 9.941 | 2437-95-8 | C10H16 | α-Pinene |
| 24 | 10.098 | 776-76-1 | C13H14Si | Methyldiphenylsilane |
| 25 | 10.105 | 3777-69-3 | C9H14O | 2-Pentylfuran |
| 26 | 10.186 | 100-52-7 | C7H6O | Benzaldehyde |
| 27 | 11.884 | 112-31-2 | C10H20O | Decanal |
| 28 | 12.888 | 124-18-5 | C10H22 | Decane |
| 29 | 13.05 | 14593-43-2 | C10H12O | Allyl benzyl ether |
| 30 | 13.712 | 29135-27-1 | C12H18O2 | Verbenyl acetate |
| 31 | 13.996 | 38301-80-3 | C10H14O | Chrysanthenone |
| 32 | 14.18 | 629-50-5 | C13H28 | Tridecane |
| 33 | 14.405 | 507-70-0 | C10H18O | Borneol |
| 34 | 14.421 | 89-49-6 | C12H20O2 | Isopulegyl acetate (equatorial) |
| 35 | 14.609 | 19822-67-4 | C10H16O | Karahanaenone |
| 36 | 14.83 | 1960/12/8 | C8H10O | 2-Phenylethyl alcohol |
| 37 | 15.003 | 16491-36-4 | C10H18O2 | cis-3-Hexenyl butyrate |
| 38 | 15.16 | 20777-49-5 | C12H20O2 | Dihydrocarvenyl acetate (axial) |
| 39 | 15.168 | 75684-65-0 | C12H20O2 | Dihydrocarvyl acetate |
| 40 | 15.423 | 98-92-0 | C6H6N2O | Nicotinamide |
| 41 | 15.425 | 18486-69-6 | C10H14O | Myrtenal |
| 42 | 15.616 | 1120-21-4 | C11H24 | Undecane |
| 43 | 16.094 | 20834-59-7 | C11H16O | p-Cymen-8-ol |
| 44 | 16.591 | 7111-29-7 | C12H18O2 | cis-l-Carvyl acetate |
| 45 | 16.603 | 1134-95-8 | C12H18O2 | trans-l-Carvyl acetate |
| 46 | 16.735 | 629-59-4 | C14H30 | Tetradecane |
| 47 | 17.082 | 105-86-2 | C11H18O2 | Geranyl formate |
| 48 | 17.093 | 138-87-4 | C10H18O | β-Terpineol |
| 49 | 17.41 | 50277-27-5 | C14H24O2 | Bornyl isobutyrate |
| 50 | 17.805 | 99-93-4 | C8H8O2 | 4′-Hydroxyacetophenone |
| 51 | 18.095 | 4179-38-8 | C12H20O | 2-Octylfuran |
| 52 | 18.337 | 112-40-3 | C12H26 | Dodecane |
| 53 | 18.877 | 475-20-7 | C15H24 | Longifolene |
| 54 | 19.449 | 629-62-9 | C15H32 | Pentadecane |
| 55 | 19.759 | 112-17-4 | C12H24O2 | Decyl acetate |
| 56 | 20.088 | 469-61-4 | C15H24 | α-Cedrene |
| 57 | 20.12 | 73744-93-1 | C15H24 | Sesquiphellandrene (beta-) |
| 58 | 20.135 | 6980-46-7 | C15H24 | Amorphene (gamma) |
| 59 | 20.212 | 10486-19-8 | C13H26O | Tridecanal |
| 60 | 21.033 | 6753-98-6 | C15H24 | α-Caryophyllene |
| 61 | 21.139 | 30021-74-0 | C15H24 | γ-Muurolene |
| 62 | 22.116 | 10219-75-7 | C15H24 | Eremophilene |
| 63 | 22.729 | 629-73-2 | C16H32 | Hexadecane |
| 64 | 23.053 | 37839-63-7 | C15H24 | Germacrene-d |
| 65 | 23.937 | 15423-57-1 | C15H24 | Germacrene-b |
| 66 | 24.459 | 2221-76-3 | C14H20O | Khusitone |
| 67 | 25.622 | 24851-98-7 | C13H22O3 | Cepionate |
| 68 | 26.107 | 629-78-7 | C17H36 | Heptadecane |
| 69 | 26.46 | 639-99-6 | C15H26O | Elemol |
| 70 | 31.925 | 19892-19-4 | C16H20O4 | Deoxysericealactone |
| 71 | 36.583 | 112-95-8 | C20H42 | Eicosane |
| 72 | 39.319 | 629-92-5 | C19H40 | Nonadecane |
| 73 | 41.061 | 629-97-0 | C22H46 | Docosane |
| 74 | 42.415 | 629-94-7 | C21H44 | Heneicosane |
| 75 | 44.084 | 630-01-3 | C26H54 | Hexacosane |
| 76 | 44.52 | 638-67-5 | C23H48 | Tricosane |
| 77 | 45.552 | 646-31-1 | C24H50 | Tetracosane |
| 78 | 46.765 | 629-99-2 | C25H52 | Pentacosane |
Eventually, 63 flavonoids and their isomers were identified from the extracts of Taiju and Duoju, including flavonoid, flavonol, dihydroflavonoid, dihydroflavonol, and isoflavone. The details are summarized in Table 2, including chemical formulas, identification, retention times, calculated and experimental m/z values, ppm error, and characteristic MS/MS fragment ions. Compounds 5, 6,11, 12, 18, 23, 27, 29, 30, 33, 37, 47, 48, 54, 55, 57, 58, 59, and 63 were unambiguously identified as schaftoside, rutin, isoquercitrin, kaempferide-7-O-glucoside, quercimeritrin, hesperidin, astragalin, apigenin 7-O-glucuronide, baicalin, quercitrin, vitexin, luteolin, quercetin, apigenin, naringenin, kaempferol, diosmetin, isorhamnetin and acacetin by comparison with the standards, respectively. The composition of the other 44 flavonoids was tentatively determined based on the fragmentation regularity and comparison with data from previous publications.
| No. | Formula | tR (min) | Identification | m/z [M − H]− | Error (ppm) | MS/MS fragments | Source |
|---|---|---|---|---|---|---|---|
| a Reference standards. | |||||||
| 1 | C21H20O11 | 5.61 | Cynaroside | 447.1151 | 1.3 | 447.0907 327.0437 285.0391 151.0023 | T,D |
| 2 | C28H32O17 | 5.63 | Isorhamnetin-3,7-O-diglucoside | 639.1573 2 | 1 | 639.1251 463.0907 300.0281 271.0249 151.00 | D |
| 3 | C21H20O13 | 5.69 | Myricetin-3-O-galactoside | 479.08388 | 1.6 | 479.0842 303.0573 285.0405 117.0186 125.0243 | T,D |
| 4 | C27H30O15 | 5.8 | Vicenin II | 593.15378 | 4.4 | 593.1517 503.1183 473.1080 353.0664 325.0712 | T,D |
| 5a | C26H28O14 | 5.96 | Schaftoside | 563.14182 | 2.1 | 563.1422 473.1083 443.0973 353.0655 175.0601 | T,D |
| 6a | C27H30O16 | 6.23 | Rutin | 609.14668 | 0.9 | 609.1484 447.0943 301.0353 300.0267 257.0451 151.0043 | T,D |
| 7 | C21H20O12 | 6.42 | Myricitrin | 463.08924 | 2.2 | 463.0892 343.0467 300.0285 301.0364 151.0042 | T |
| 8 | C21H20O12 | 6.43 | Quercetin-3-O-β-D-galactopyranoside | 463.09028 | 4.5 | 463.0886 301.0360 287.0517 257.2453 151.0029 | T,D |
| 9 | C21H22O11 | 6.44 | Eriodictyol-7-glucoside | 449.10924 | 0.7 | 447.0910 327.0491 285.0398 284.0318 151.0025 | T,D |
| 10 | C21H20O11 | 6.45 | Isoorientin | 447.09486 | 3.5 | 447.0907 327.0484 285.0391 151.0023 | T,D |
| 11a | C21H20O12 | 6.46 | Isoquercitrin | 463.09028 | 4.5 | 463.0920 300.0278 271.0248 151.0034 | D |
| 12a | C21H20O11 | 6.48 | Kaempferide-7-O-glucoside | 447.09486 | 3.5 | 447.0923 285.0379 284.0318 151.0027 | T,D |
| 13 | C21H20O11 | 6.5 | Luteolin-7-O-β-D-galactoside | 447.09486 | 3.5 | 447.0923 327.0490 285.0397 151.0027 | T,D |
| 14 | C21H18O13 | 6.57 | Quercetin-3-O-glucuronide | 477.0678 | 0.7 | 477.0695 301.0357 151.0032 | T,D |
| 15 | C27H30O14 | 6.61 | Rhoifolin | 577.15702 | 1.3 | 577.1553 269.0456 151.0064 | T,D |
| 16 | C27H30O14 | 6.62 | Kaempfero-3-O-xyloside | 577.15762 | 2.3 | 577.1585 269.0464 151.0008 159.0437 | T,D |
| 17 | C21H18O12 | 6.63 | Luteolin-7-O-glucuronide | 461.07414 | 3.5 | 461.0705 285.0399 151.0026 | T,D |
| 18a | C21H20O12 | 6.71 | Quercimeritrin | 463.09028 | 4.5 | 463.0866 287.0543 151.0029 | D |
| 19 | C21H20O13 | 6.72 | Gossypin | 479.08388 | 1.6 | 479.0847 369.0460 303.0499 285.0401 271.0634 193.0141 133.0286 | T,D |
| 20 | C15H12O6 | 6.74 | Eriodictyol | 287.05567 | -1.5 | 287.0506 241.1529 151.0040 135.0456 | T,D |
| 21 | C24H22O15 | 6.79 | Quercetin-3-O-(6′′-O-malonyl)-glucoside | 549.08976 | 2.1 | 549.1999 300.0274 301.0354 161,0240 151.0035 | T,D |
| 22 | C28H32O15 | 6.8 | Diosmin | 607.16895 | 3.5 | 607.1683 299.0564 284.0324 151.0030 | T,D |
| 23a | C28H34O15 | 6.94 | Hesperidin | 609.18426 | 2.9 | 609.1861 301.0731 242.0576 164.0121 | T,D |
| 24 | C22H22O12 | 6.97 | Isorhamnetin-7-O-β-D-glucoside | 477.10458 | 1.5 | 447.1058 431.0994 314.0437 315.0475 151.0041 | T |
| 25 | C21H20O10 | 6.99 | Apigenin-7-O-β-D-glucoside | 431.0992 | 1.9 | 431.0976 311.0548 268.0373 269.0442 151.0023 | T,D |
| 26 | C24H22O14 | 7 | Luteolin-7-O-6"-malonylgalactoside | 533.09557 | 3.5 | 489.1022 285.0399 175.0383 151.0026 | T,D |
| 27a | C21H20O11 | 7.03 | Astragalin | 447.09486 | 3.5 | 447.0942 285.0416 284.0334 256.0371 151.0032 | T,D |
| 28 | C15H12O6 | 7.05 | Carthamidin-4',5,7,8-tetrahydroxyflavanone | 287.05567 | -1.5 | 287.0506 241.1529 151.0040 135.0456 | T,D |
| 29a | C21H18O11 | 7.2 | Apigenin-7-O-glucuronide | 445.07891 | 2.9 | 445.0780 269.0465 175.0244 151.0031 | T,D |
| 30a | C21H18O11 | 7.3 | Baicalin | 445.07891 | 2.9 | 445.1714 269.0463 243.1236 113.0242 | D |
| 31 | C23H22O13 | 7.32 | Chrysin-7-O-β-D-glucuronide | 505.10034 | 3.1 | 505.1019 445.0793 329.0678 175.0240 151.0033 | T,D |
| 32 | C22H20O13 | 7.35 | Isorhamnetin-3-glucuronide | 491.08481 | 3.5 | 491.1118 315.0516 300.0274 287.0557 269.0454 151.0035 | D |
| 33a | C21H20O11 | 7.36 | Quercitrin | 447.09486 | 3.5 | 447.0943 271.0623 175.0249 151.0040 | T,D |
| 34 | C22H24O11 | 7.42 | Hesperetin-7-O-β-D-glucoside | 463.12496 | 0.8 | 463.0917 301.0734 286.0484 151.0037 | T,D |
| 35 | C23H22O11 | 7.53 | 6''-O-acetylgenistin | 473.1113 | 5 | 473.1090 311.0547 268.0373 151.0021 | T,D |
| 36 | C15H10O5 | 7.57 | Genistein | 269.04708 | 5.7 | 269.0448 225.0545 151.0025 117.0341 | T,D |
| 37a | C21H20O10 | 7.59 | Vitexin | 431.0992 | 1.9 | 431.0985 311.0544 268.0378 151.0030 | T,D |
| 38 | C16H12O7 | 7.68 | 3-O-methylquercetin | 315.05153 | 1.6 | 315.1270 300.0286 269.0463 225.0553 151.0037 | T,D |
| 39 | C22H22O12 | 7.69 | Isorhamnetin-3-O-galactoside | 477.10521 | 2.9 | 477.1070 301.0728 175.0243 113.0248 | T,D |
| 40 | C25H26O14 | 7.79 | Limocitrin-7-O-(6''-acetyl-β-D-glucopyranoside) | 549.12665 | 3 | 503.1189 299.0559 284.0319 151.0021 | T,D |
| 41 | C16H12O6 | 7.80 | Hydroxygenkwanin | 299.05687 | 2.5 | 284.0331 256.0372 151.0031 | T,D |
| 42 | C16H14O6 | 7.96 | Hesperetin | 301.07236 | 2 | 301.0729 286.0467 242.0568 151.0037 | T,D |
| 43 | C16H12O5 | 7.97 | 5,4'-dihydroxy-7-methoxy isoflavones | 283.06284 | 5.8 | 283.0611 268.0385 151.0034 | T,D |
| 44 | C36H28O15 | 8.29 | Ochnaflavone-7-O-β-D-glucopyranoside | 699.13652 | 1.4 | 699.1480 537.1045 375.0731 179.0350 | T,D |
| 45 | C23H22O11 | 8.32 | Apigenin-7-O-glucuronide-6'-ethyl ester | 473.1113 | 5 | 473.1080 268.0368 269.0435 151.0022 | T,D |
| 46 | C23H24O12 | 8.58 | Tricin-7-β-D-glucopyranoside | 491.11984 | 0.7 | 283.0625 268.0379 151.0034 | T |
| 47a | C15H10O6 | 8.59 | Luteolin | 285.04217 | 6 | 285.0402 241.0489 | T,D |
| 48a | C15H10O7 | 8.67 | Quercetin | 301.03562 | 0.8 | 301.0356 273.0395 178.9986 151.0040 121.0293 | T,D |
| 49 | C22H20O11 | 8.89 | Wogonin-5-O-glucoside | 459.09542 | 4.6 | 459.0937 283.0618 268.0379 175.0239 113.0243 | T,D |
| 50 | C22H20O11 | 9.01 | Apigenin-7-O-methylglucuronide | 459.09542 | 4.6 | 459.0963 283.0626 268.0390 175.0255 113.0246 | T,D |
| 51 | C16H12O5 | 9.24 | Calycosin | 283.06284 | 5.8 | 268.0378 240.0416 151.0029 | T,D |
| 52 | C22H28O11 | 9.29 | Prim-O-glucosylcimifugin | 467.1546 | -2.8 | 467.1883 313.1632 159.0304 161.0454 | T,D |
| 53 | C15H12O4 | 9.44 | Liquiritigenin | 255.06649 | 0.8 | 255.0654 213.0536 151.0031 211.0741 | D |
| 54a | C15H10O5 | 9.61 | Apigenin | 269.04708 | 5.7 | 269.0456 225.0545 151.0028 117.0343 | T,D |
| 55a | C15H12O5 | 9.67 | Naringenin | 271.06102 | -0.6 | 271.0585 227.0674 151.0033 119.0504 | T,D |
| 56 | C17H14O7 | 9.75 | 5-Hydroxy-7,4′-dimethoxyflavonoid quercetin | 329.06765 | 3 | 329.0659 314.0426 299.0194 271.0244 227.0343 151.0029 | T,D |
| 57a | C15H10O6 | 9.84 | Kaempferol | 285.04155 | 3.8 | 285.0402 239.0364 257.0459 229.0495 151.0029 133.0293 | T,D |
| 58a | C16H12O6 | 9.86 | Diosmetin | 299.05687 | 2.5 | 284.0372 256.0375 227.0342 151.0030 | T,D |
| 59a | C16H12O7 | 10.03 | Isorhamnetin | 315.05162 | 1.9 | 315.0516 300.0281 271.0236 151.0029 | T,D |
| 60 | C15H12O4 | 10.83 | Isoliquiritigenin | 255.06649 | 0.8 | 255.2329 211.0757 143.0494 | D |
| 61 | C15H10O5 | 11.24 | Baicalein | 269.04708 | 5.7 | 269.0456 225.0535 151.0035 117.0340 | T,D |
| 62 | C18H16O7 | 11.51 | Eupatilin | 343.08346 | 3.3 | 343.0805 328.0583 313.0350 270.0164 | T,D |
| 63a | C16H12O5 | 12.22 | Acacetin | 283.06284 | 5.8 | 283.0612 268.0385 239.0349 151.0030 | T,D |
Among the 63 flavonoids identified, there are 53 common components in Taiju and Duoju. However, myricitrin, isorhamnetin-7-O-β-D-glucoside and ricin-7-β-D-glucopyranoside were only found in Taiju. It has anti-inflammatory, analgesic, and choleretic pharmacological effects. Seven components were only found in Duoju, including isorhamnetin-3,7-O-diglucoside, isoquercitrin, quercimeritrin, baicalin, isorhamnetin-3-glucuronide, liquiritigenin and isoliquiritigenin. It can be used as a food additive and anti-inflammatory drug. The results indicate that there are differences in the pharmacological effects of Taiju and Duoju. Therefore, a statistical analysis was necessary to find the compounds that contribute most to the differences between the sensory characteristics and health effects.
3.3 Chemometric statistical analysis
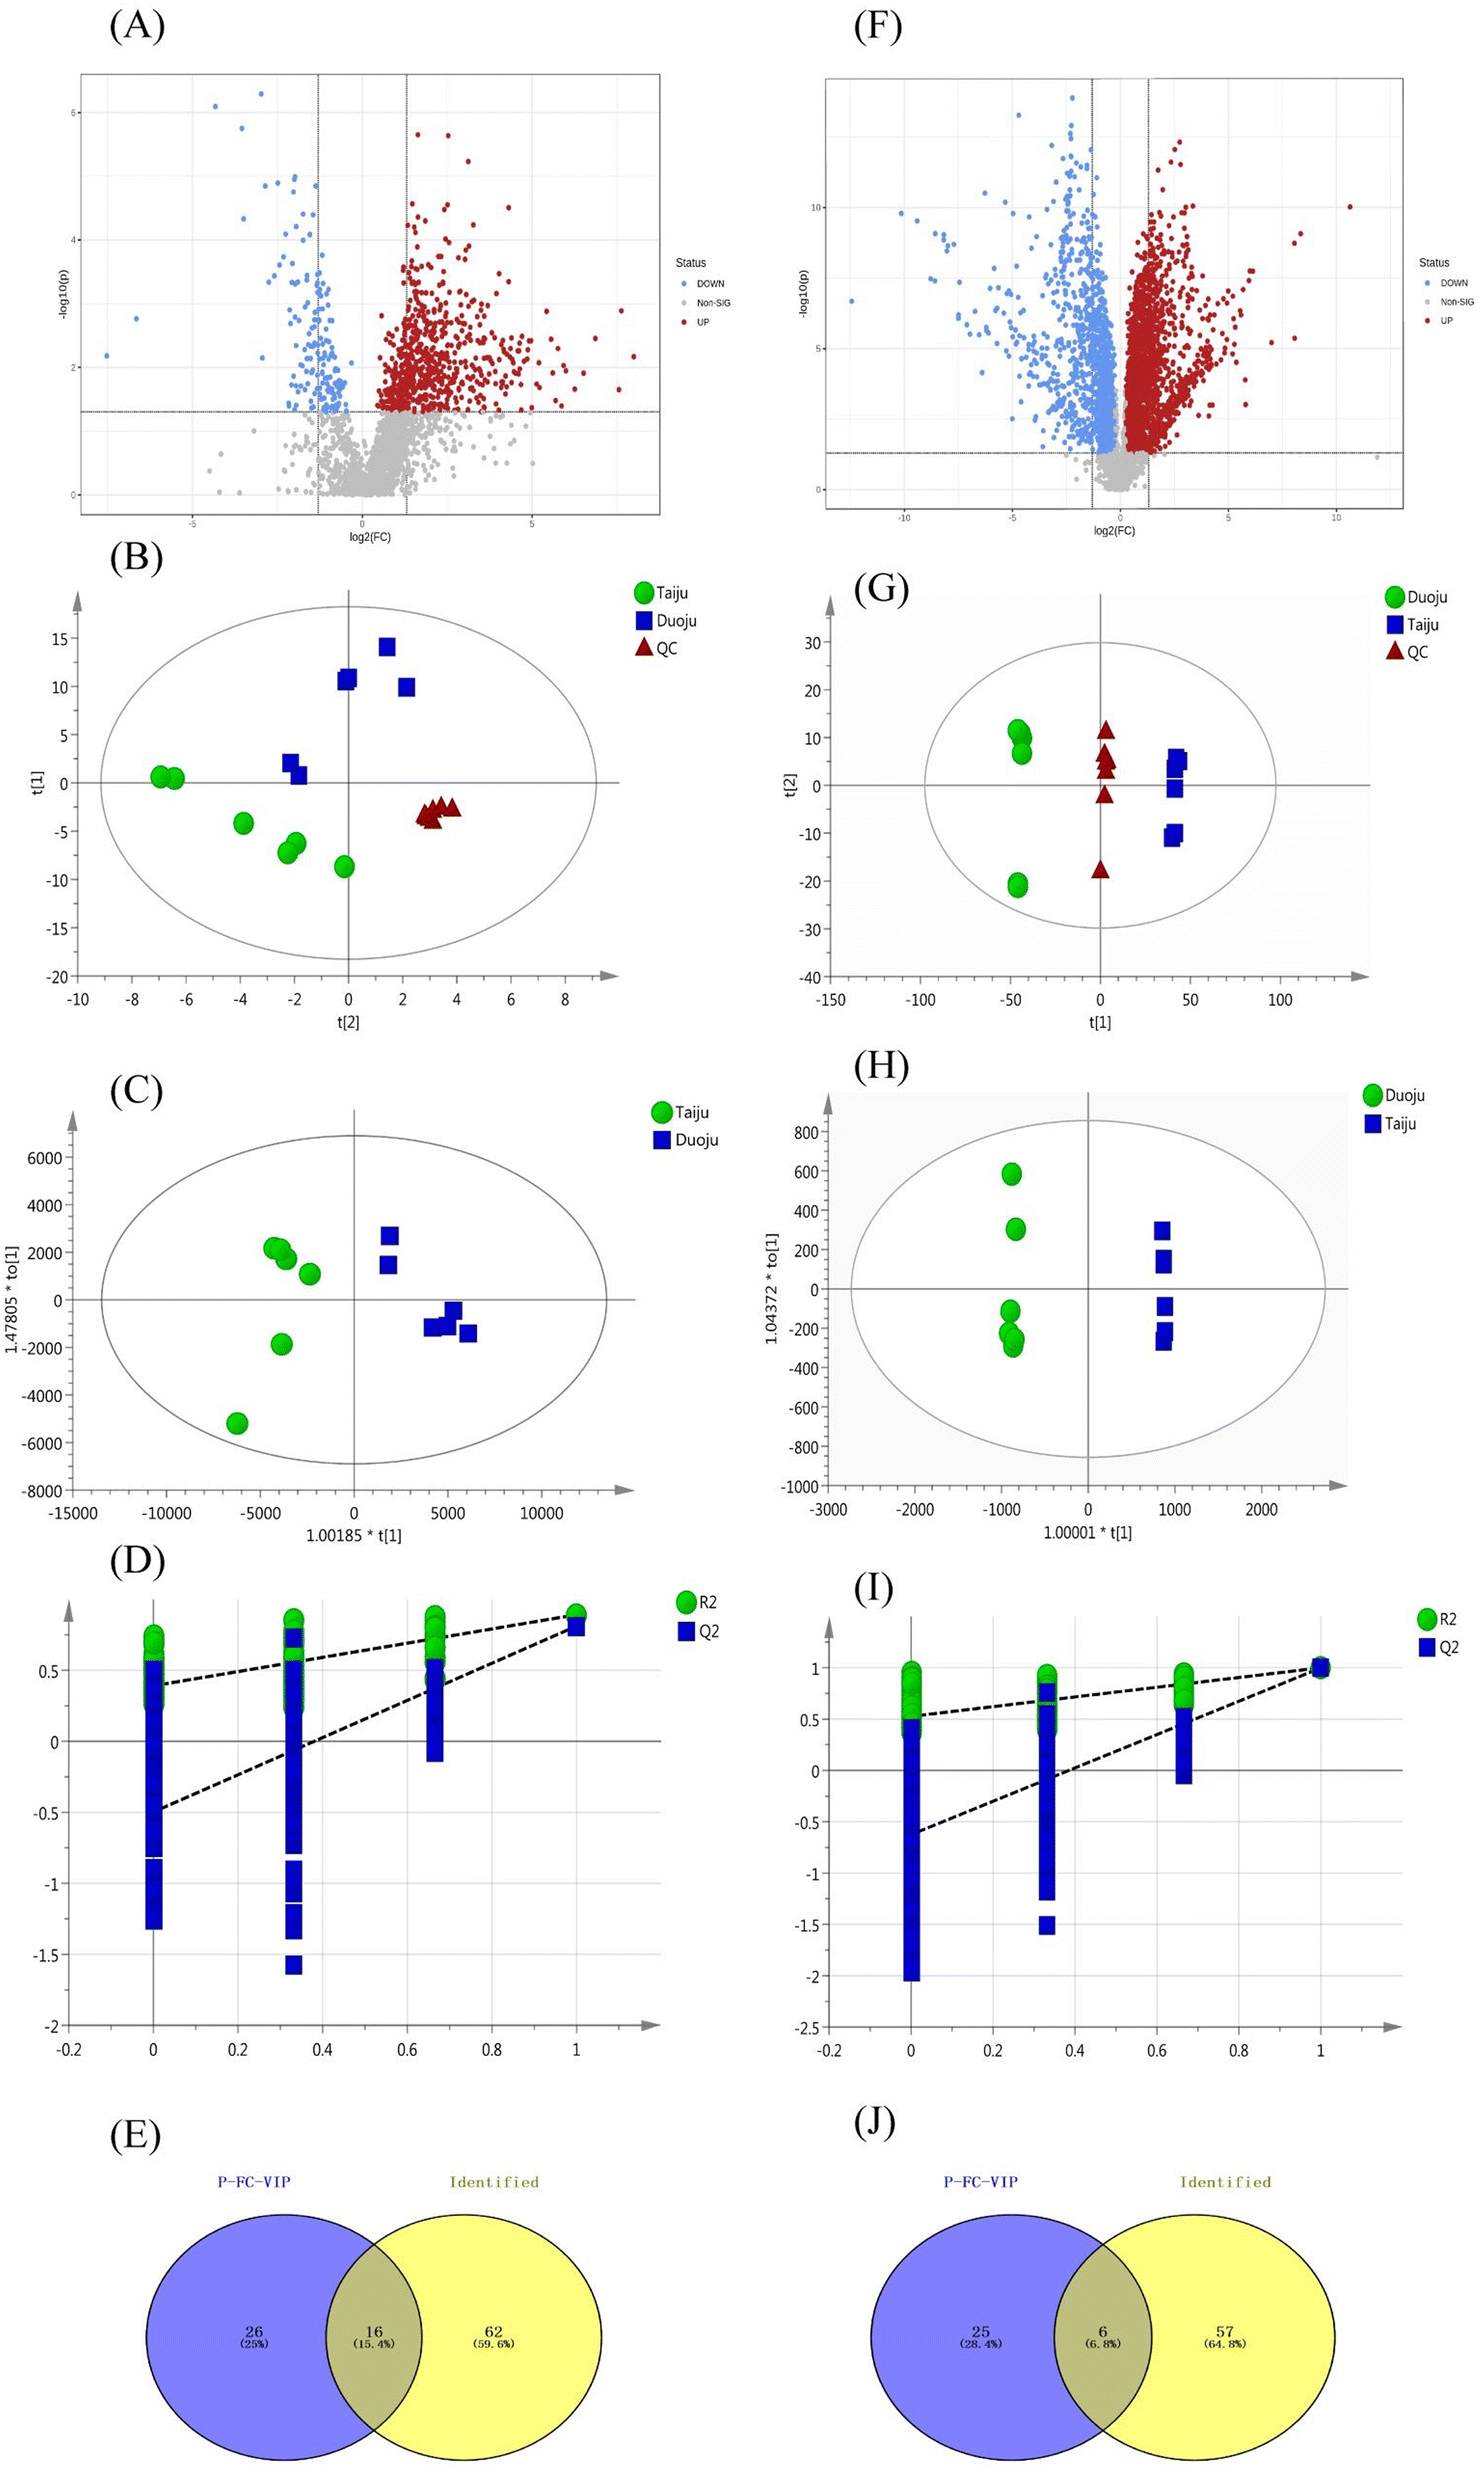 | ||
| Fig. 5 Multivariate statistical analysis of HJ in different harvest periods. (A) Volcano for GC-MS. (B) PCA score plot in GC-MS. (C) OPLS-DA score plot in GC-MS. (D) 200 permutations plot in GC-MS. (E) Venn diagram for screening marker metabolites in GC-MS. (F) Volcano in LC-MS. (G) PCA score plot in LC-MS. (H) OPLS-DA score plot in LC-MS. (I) 200 permutations plot in LC-MS, (J) Venn diagram for screening marker metabolites in LC-MS. | ||
A PCA model with R2X = 0.758 and Q2 = 0.692 was proven to be reliable, and further stoichiometric statistics based on supervised OPLS-DA were used to create a better differentiation between the two groups separately. The OPLS-DA model was developed, and the R2Y and Q2 of the model were 0.907, and 0.999, respectively. As shown in Fig. 5C, the results satisfy R2Y > 0.5 and Q2 > 0.3. In addition, Fig. 5D shows the 200 times permutation model, which shows that Q2 is less than 0. This indicates that the model was not over-fitted and was reliable and accurate. Afterward, the compounds with VIP > 1.0 were screened as potential markers. Finally, 46 metabolites satisfying the three conditions (FC of >1.2 or <0.8, p < 0.05, and VIP > 1) were screened. As shown in Fig. 5E, 16 volatile metabolites were considered to be marker metabolites based on comparison with the identified metabolites in Taiju and Duoju. The detailed values are recorded in Table 3. The 16 metabolites corresponded to components 12, 20, 31, 33, 40, 41, 44, 49, 53, 62, 65, 67, 70, 74, 76 and 78 of the identified volatile oils.
| Taiju–Duoju | ||||||
|---|---|---|---|---|---|---|
| No. | Identification | FC | P | VIP | Trend | AUC |
| 1 | (Z)-β-Ocimene | 0.12931 | 5.45 × 10⁻⁷ | 2.22705 | ↑ | 1.000 |
| 2 | β-Pinene | 0.2037 | 0.00019869 | 1.1042 | ↑ | 1.000 |
| 3 | Chrysanthenone | 0.18087 | 1.27 × 10⁻⁵ | 3.40872 | ↑ | — |
| 4 | Borneol | 0.25698 | 8.79 × 10⁻⁶ | 3.73499 | ↑ | 1.000 |
| 5 | Nicotinamide | 0.48913 | 0.00067825 | 1.41383 | ↑ | — |
| 6 | Myrtenal | 0.51015 | 0.0076246 | 1.14561 | ↑ | — |
| 7 | cis-l-Carvyl acetate | 0.25342 | 9.81 × 10⁻⁶ | 1.17883 | ↑ | 1.000 |
| 8 | Bornyl isobutyrate | 0.24891 | 1.57 × 10⁻⁵ | 2.64804 | ↑ | 1.000 |
| 9 | Longifolene | 0.40082 | 0.00049672 | 1.41966 | ↑ | — |
| 10 | Eremophilene | 0.3029 | 9.39 × 10⁻⁵ | 1.28276 | ↑ | — |
| 11 | Germacrene-b | 0.40598 | 0.00044259 | 1.4376 | ↑ | — |
| 12 | Cepionate | 0.61752 | 0.011381 | 2.36112 | ↑ | — |
| 13 | Deoxysericealactone | 0.36528 | 0.012746 | 1.36153 | ↑ | — |
| 14 | Heneicosane | 20.352 | 0.00044876 | 1.19437 | ↓ | — |
| 15 | Tricosane | 12.117 | 0.0040324 | 1.33354 | ↓ | — |
| 16 | Pentacosane | 27.87 | 0.007891 | 1.27865 | ↓ | — |
| No. | Identification | FC | P | VIP | AUC | Binding energy (kcal mol−1) of CDK1 | Binding energy (kcal mol−1) of PLK1 |
|---|---|---|---|---|---|---|---|
| 1 | Luteolin | 0.34674 | 3.63 × 10⁻¹⁰ | 10.2725 | 1.000 | −6.27 | −7.11 |
| 2 | Apigenin | 0.65486 | 2.27 × 10⁻⁵ | 4.0180 | 1.000 | −6.77 | −5.37 |
| 3 | Diosmetin | 0.48228 | 8.07 × 10⁻⁹ | 3.7749 | 1.000 | −6.46 | −7.44 |
| 4 | Isorhamnetin | 0.038783 | 5.51 × 10⁻¹⁴ | 3.3627 | 1.000 | −6.44 | −6.07 |
| 5 | Eupatilin | 1.3659 | 3.28 × 10⁻⁵ | 3.3002 | 1.000 | −6.01 | −6.34 |
| 6 | Hydroxygenkwanin | 0.18634 | 7.91 × 10⁻¹¹ | 3.1115 | 1.000 | −6.48 | −6.00 |
As shown in Fig. 6A, clear and visual differences and associations between the 16 volatile oil marker metabolites were shown by the heat map. Among the 16 markers, thirteen ingredients (ocimene, beta-pinene, chrysanthenone, borneol, nicotinamide, myrtenal, L-carvyl acetate, bornyl isobutyrate, longifolene, eremophilene, germacrene-b, cepionate, deoxysericealactone) showed high relative contents in Taiju. The other three ingredients including heneicosane, tricosane and pentacosane, have higher contents in Duoju. Interestingly, we found that the three ingredients in Duoju are odorless. Furthermore, we also found that the 13 fragrance components with higher content in Taiju were mainly composed of alcohols, terpenes and esters. The 13 volatile markers were categorized into 5 types: grassy scent (ocimene), woody scent (longifolene), jasmine of the valley scent (cepionate), spearmint scent (L-carvyl acetate) and aromatic flavor (the compounds' aroma characteristics were taken from http://www.thegoodscentscompany.com/search2.html).41 Moreover, the above ingredients are fragrant spices, which are commonly used in spice mixtures, cosmetics and food.42 The content levels of the above ingredients were significantly higher in Taiju than in Duoju. A significant difference between the specific floral scent characteristics in Taiju and Duoju might be its sweet and floral aroma. It helps to verify the result that the aroma of Taiju is more rich and more mellow in sensory evaluation. Therefore, the harvesting period affects the aroma of HJ; Taiju has a stronger and mellow aroma. The results could also explain the popularity and higher price of Taiju.
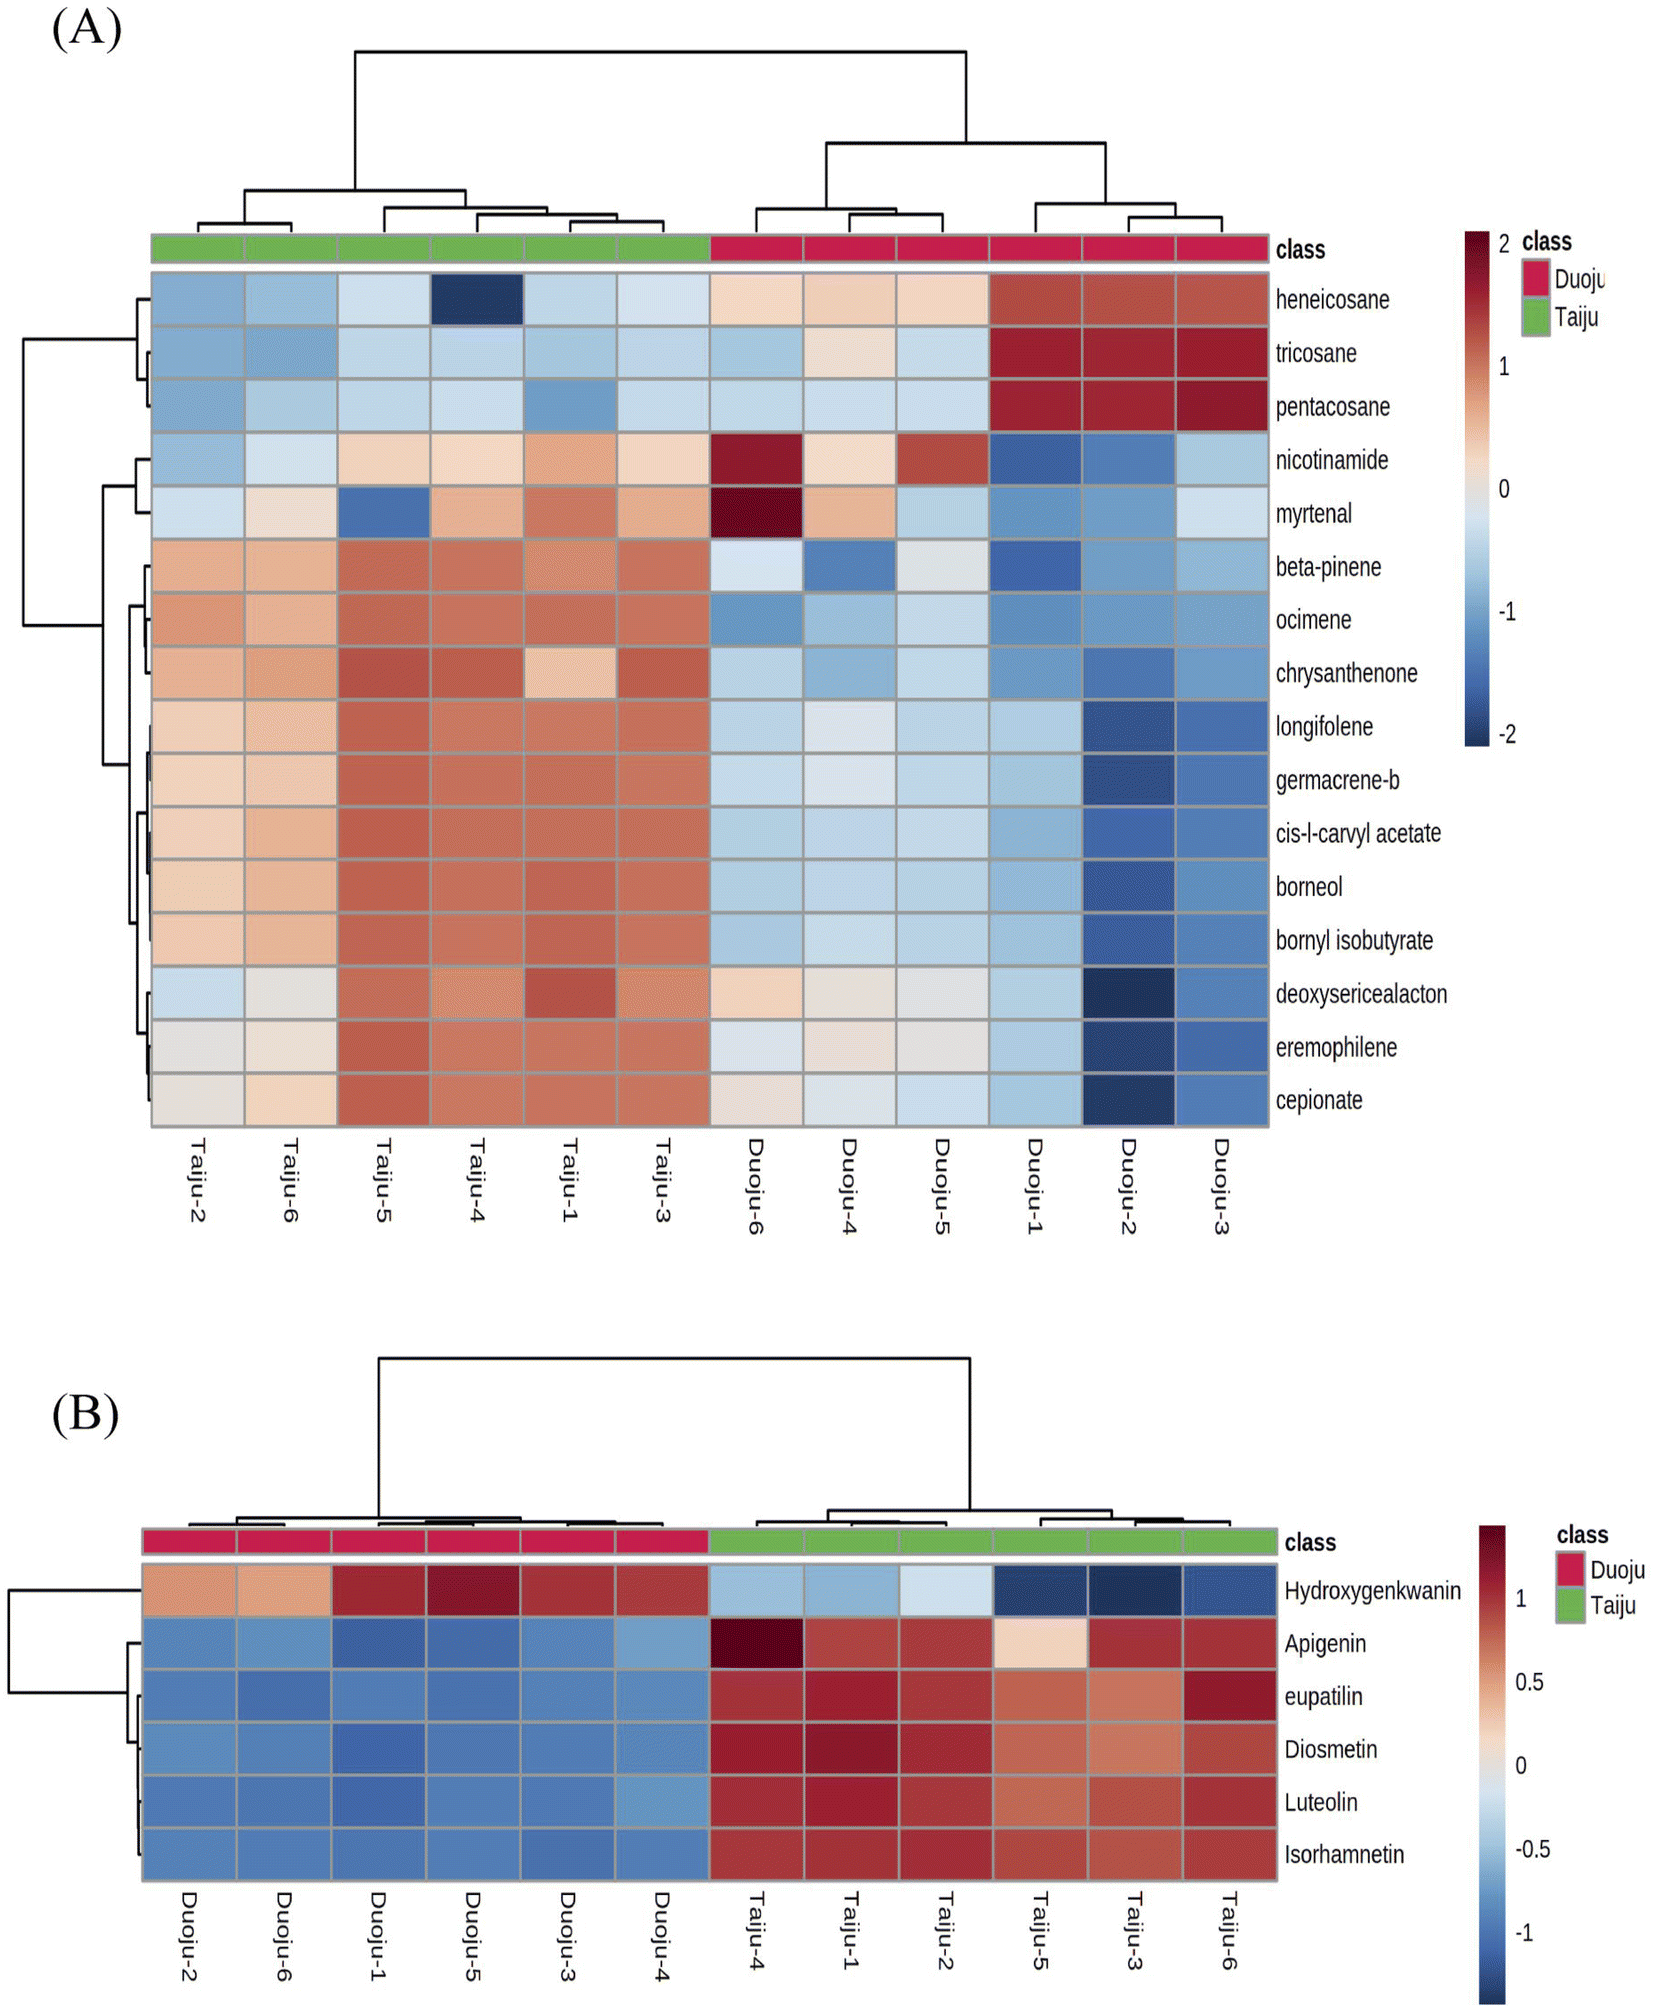 | ||
| Fig. 6 The hierarchical cluster analysis of marker metabolites. (A) Heat map based on the relative abundance of 16 volatile markers in GC-MS. (B) Heat map of 6 flavonoid markers in UPLC-Q/TOF-MS. | ||
In addition, six flavonoids (luteolin, apigenin, diosmetin, isorhamnetin, eupatilin and hydroxygenkwanin) were screened as specific markers to distinguish Taiju and Duoju. Their affiliation and content are shown in Fig. 6B. We found that these components existed in both Taiju and Duoju, indicating that HJ plays a functional food role throughout the growth period. However, the two have significantly different contents. Only one compound, hydroxygenkwanin, showed higher expression in Duoju, while the other five compounds were highly expressed in Taiju, with the most prominence for luteolin. However, the significantly different contents indicated that the flavonoids of HJ reached their peak during the Taiju growth stage and were then metabolized as the growth period progressed.
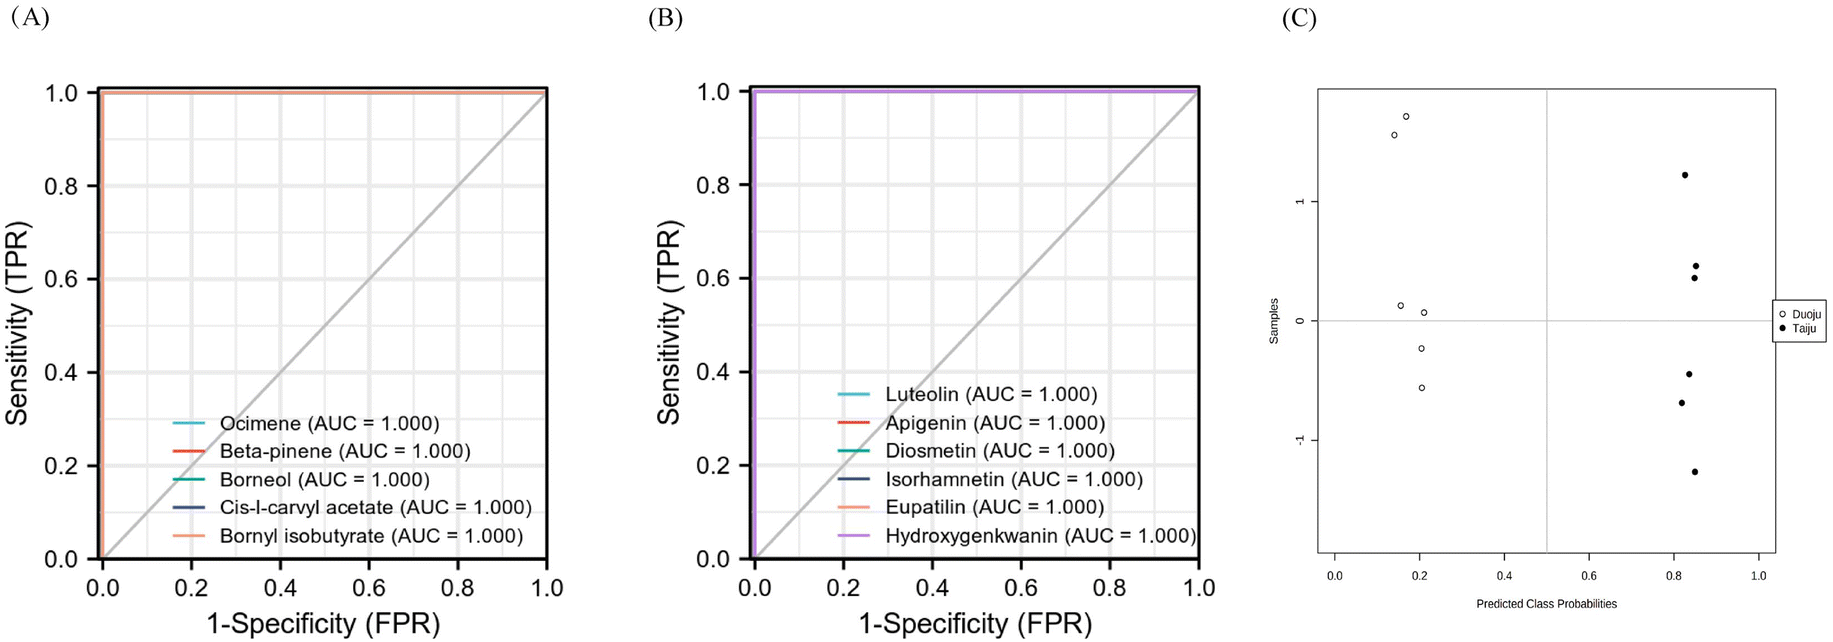 | ||
| Fig. 7 Receiver operating characteristic curve (ROC) plot and evaluation of the predictive power of the diagnostic panel. (A) ROC in CG-MS. (B) ROC in UHPLC-Q-TOF-MS. (C): Diagnostic performance of classifier modeled by RF algorithm. | ||
To assess the predictive power of the diagnostic panel, the analyzed samples (n = 28) were selected to compose a validation set. Among them, 16 samples of unknown classification, including eight Taiju and eight Duoju samples, were labeled and disordered for analysis. After performing the Tester module and RF algorithm analysis using MetaboAnalyst5.0, there was a separation trend between the Taiju and Duoju groups (Fig. 7C). In addition, the 16 unknown samples were classified as Taiju and Duoju, and the groupings were consistent with the label (Table S2†). Therefore, the results indicate that this diagnostic model has good predictive ability and the 11 components have a good ability to distinguish between Taiju and Duoju.
3.4 Bioinformatics analysis
Various studies have shown that HJ has curative effects on liver diseases, and flavonoids are the active components of this effect.43 Therefore, the flavonoid differential metabolites with liver cancer targets were screened for molecular docking validation to verify whether the different harvesting stages of HJ have different anti-cancer activities.The GSE84402 dataset was downloaded from the GEO database, |logFC| > 1 and p < 0.05 were set as the screening criteria, and the genes expressed in healthy human liver tissue (14) and liver cancer tissue (14) were selected as research objects. There were 690 up-regulated and 1085 down-regulated differential genes (DEGs) (see Appendix IV for details†), and a volcano map of differential genes was created. In Fig. S4,† logFC > 0 (red) indicates an up-regulated gene and logFC < 0 (green) represents a down-regulated gene in the experimental group. In addition, the 355 gene targets of differential flavonoid compositions were predicted by Pharmmapper and SwissTargetPrediction. A total of 1775 differential genes (DEGs) were obtained from the high-throughput microarray dataset, intersected with 355 targets of the drug to obtain 71 associated gene targets, and plotted as a Venn diagram (Fig. 8A). Then, the network and type files based on the corresponding properties were created and the component-target-disease network pharmacology diagram was constructed in Cytoscape (Fig. 8B). Diamonds represent markers, red hexagons represent diseases and blue circles represent associated genes. Next, PPI networks were formed by importing 71 intersecting genes into the String online website and containing 194 nodes; the results are shown in Fig. 8C. Topological analysis was then performed using the Cytohubba plug-in to obtain the key genes with TOP10 degree values, including CDK1, AURKB, CCNA2, PLK1, CCNB3, KIF11, NEK2, CDC25A, AR, and PIK3R1 (Fig. 8D). Nine pathways were obtained by KEGG enrichment analysis and plotted in bubble plots as shown in Fig. 9A. The p-values are indicated by color, and the number of genes is indicated by bubble size. The detailed information listed in Table S3† shows that the hsa04914 target gene pathway is the most associated, corresponding to 6 differential genes. Fig. 9B shows the chord plot of GO enrichment analysis, which was obtained using ggplot2 in RStudio with the five significantly enriched GO entries on the right and the corresponding six differential genes on the left (including four up-regulated genes and two down-regulated genes). As shown in Fig. 9C, five DEGs were obtained after taking the intersection of the differential genes of KEGG and GO, which are expected to be the potential therapeutic targets for patients with liver cancer.
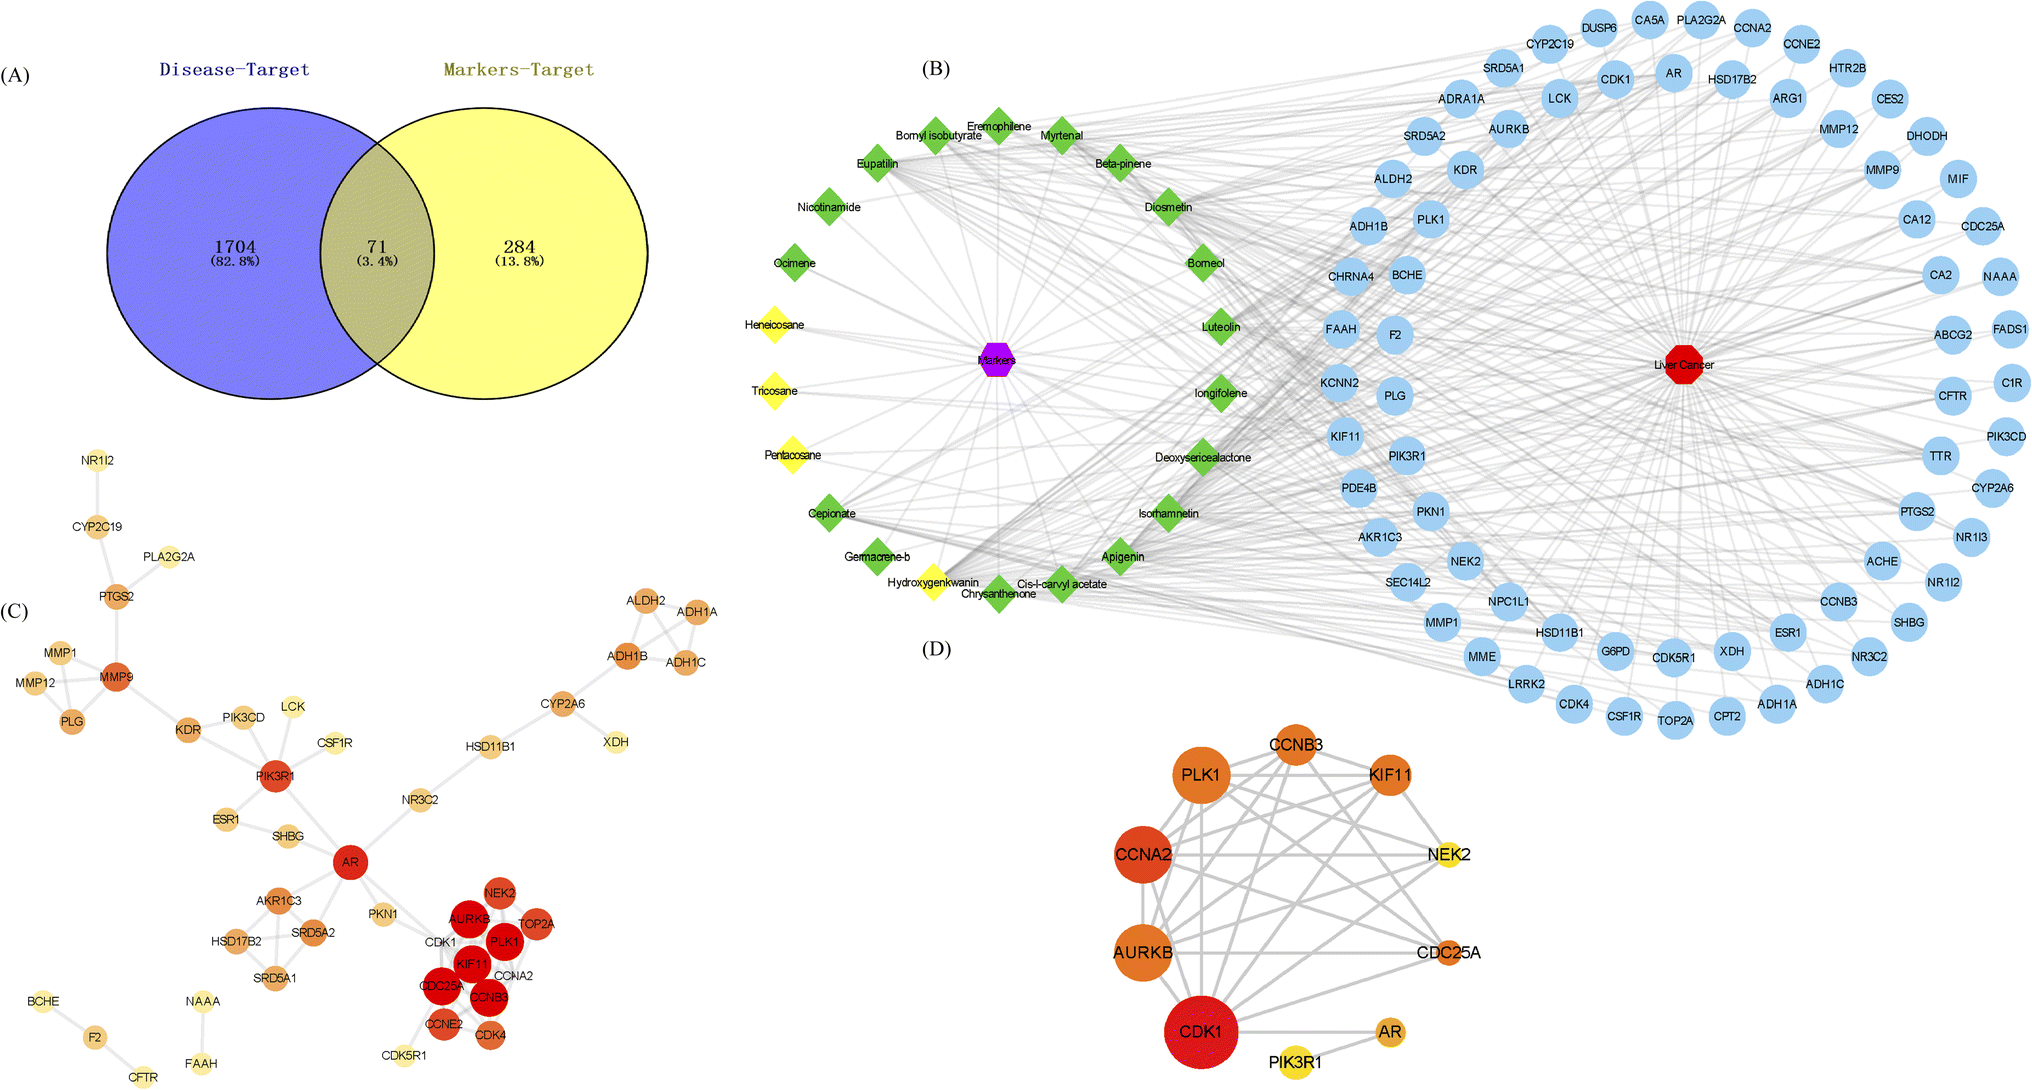 | ||
| Fig. 8 Bioinformatics analysis prediction for HJ treatment of liver diseases. (A) Venn diagram of HJ and hepatoma intersection targets. (B) Compound-target-disease network. (C) PPI network of potential targets. (D) Map of the hub genes screened from PPI using CytoHubba. | ||
 | ||
| Fig. 9 Distribution of functional enrichment analysis. (A) Bubble chart of KEGG pathways. (B) Detailed relationship between differentially expressed genes and major pathways annotated by GO shown using a Circos graph. (C) Intersection of the KEGG and GO biological processes. | ||
3.5 Molecular docking
Molecular docking can simultaneously calculate binding energies and infer catalytic sites between receptors and ligands. PLK1 and CDK1 were selected as receptors because they were the core protein targets screened out using bioinformatics techniques. In addition, six flavonoid markers were used as ligands. Generally, the stabilities of conformations are positively correlated with their binding energies. The larger the absolute value of the binding energy, the more stable the conformation. The binding energies of the six flavonoid markers are listed in Table 4. A binding energy of <−5 kcal mol−1 indicates strong interaction ability.44 The results showed that all six biomarkers had binding energies ranging from −5.37 to −7.44 kcal mol−1, suggesting that the above-mentioned biomarkers have good affinity with core gene proteins. In general, these compounds were predominantly stable in the catalytic site due to electrostatic interactions, van der Waals forces, and hydrogen bonds.45 Some of the interaction forces between ligands and receptors are shown in Fig. 10. Among these compounds, diosmetin, with the lowest binding energy of −7.44 kcal mol−1, was completely enveloped by the active sites of PLK1. Some amino acid residues, including ASN-496, ARG-560 and GLU-401, contributed to the recognition via a combination of electrostatic interactions, van der Waals forces, and hydrogen bond interactions. Furthermore, apigenin and CDK1 formed hydrogen bonds at VAL-48, LYS-30, ARG-44 and LYS-9, causing them to form a stable complex (−6.77 kcal mol−1). This indicated that the six flavonoid markers will have higher biological activity. | ||
| Fig. 10 Molecular docking results of two anti-hepatoma core targets with flavonoid markers. (A) Lowest energy state of six flavonoid markers docked with PLK1. (B) Lowest energy state of six flavonoid markers docked with CDK1. | ||
In the present study, the molecular docking analysis was introduced to investigate the binding capacity of special markers with the core protein target of liver cancer. It suggested that the six flavonoid markers, including luteolin, apigenin, diosmetin, eupatilin, isorhamnetin and hydroxygenkwanin, had obvious advantages of protection against and treatment of liver diseases. Luteolin, apigenin and diosmetin are all natural flavonoids that have been used as dietary supplements. Luteolin alleviated hepatitis by regulating serum metabolites and intestinal microorganisms.46 Apigenin possessed anticancer, antioxidant, and anti-inflammatory effects, including inhibiting cell growth and proliferation in Hep3B cells.47 It was reported that diosmetin could inhibit the progression of cancer. Diosmetin also exhibited antitumor effects on HCC cells by inhibiting cell proliferation via cell cycle arrest and interfering with lipid metabolism.48 Additionally, eupatin inhibits hepatocellular carcinoma metastasis by intervening in MMP-2 mediated migration.49 Isorhamnetin may protect the liver by regulating NF-kB, Nrf2, and NLRP3 and reducing oxidative stress, inflammation, and scorch death.50,51 Additionally, hydroxygenkwanin has also been demonstrated to be active against liver cancer and validates its potential use as a therapeutic agent.52
Notably, only the content of hydroxygenkwanin was found to be significantly higher in Duoju. The other five flavonoids, including luteolin, apigenin, diosmetin, eupatilin and isorhamnetin, had higher contents in Taiju. Therefore, the inhibition of liver cancer activity of Taiju was higher than that of Duoju. The difference in pharmacological effects derived from different concentrations in markers may lead to a different emphasis in clinical medication. The anti-inflammatory and anti-hepatoma effects of flavonoid-rich in Taiju were more significant. Based on the above, in a TCM formula for heat-clearing and diet of HJ, Taiju may be a more effective and healthy material. It is suggested that Taiju may have a better health care effect and be a more effective health care medicine in the daily consumption of Chrysanthemum tea and TCM formulas for clearing heat and detoxifying, respectively. In the future, the pharmacological activity of markers needs to be validated to rationalize the clinical differences between Taiju and Duoju.
4 Conclusion
Through this research and analysis, we found that the relative content of volatile compounds with aromatic odor in Taiju increased significantly when the harvesting period was shortened, which may be the reason for the difference in flavor. The results of bioinformatics analysis combined with molecular docking showed that the flavonoid differential markers have good anti-liver cancer activity and are the potentially active ingredients. The flavonoid content in Taiju is significantly higher than that of Duoju, which causes a difference in medicinal effects. In conclusion, harvest time plays a remarkably important role in forming the metabolic profiles of HJ. The study should further facilitate the development of Taiju and Duoju food industries and its rational use in clinical applications, providing a powerful tool for the study of quality control.Author contributions
Mengxin Yang: methodology; data curation; software; writing – original draft; writing – review & editing. Xi Tian: data curation; methodology. Miaoting Zhang: software, visualization. Jinhuan Wei: software; supervision. Yukun Niu: writing – review & editing. Jiali Hou: investigation. Yiran Jin: resources; supervision; project administration. Yingfeng Du: funding acquisition; supervision; writing – review and editing.Conflicts of interest
The authors declare no conflict of interest.Acknowledgements
This work was supported by the Natural Science Foundation of Hebei Province of China (H2019206562 and H2022206384). We thank all authors for their support to the Department of Pharmaceutical Analysis, College of Pharmacy, Hebei Medical University.References
- J. Zheng, B. Lu and B. Xu, An update on the health benefits promoted by edible flowers and involved mechanisms, Food Chem., 2020, 340, 127940 CrossRef PubMed.
- A. G. Su, Research on the Edible Value of Chrysanthemum, Jiangsu Condiment and Subsidiary Food, 2013, 132, 4–5 Search PubMed.
- X. Shu and Y. X. Gao, Research Progress on Extraction of Volatile Compounds and Analysis of Aroma Characteristics in Tea, Sci. Technol. Food Ind., 2022, 43, 469–480 Search PubMed.
- A. Shakeri, L. Samiei and H. Hadizadeh, Chrysanthemum, an ornamental genus with considerable medicinal value: a comprehensive review, S. Afr. J. Bot., 2022, 144, 23–43 CrossRef.
- ChPC, Pharmacopoeia of the People's Republic of China 2020, China Medical Science Press, 2020 Search PubMed.
- A. Yuan, Z. Li, X. Li, S. Yi, S. Wang, K. Shi and J. Bian, Chrysanthemum indicum linné extracts attenuate the mitogenic effect of epinephrine on human HCC cells, J. Nanjing Med. Univ., 2009, 29, 284–288 CrossRef.
- S. C. Jeong, S. M. Kim, Y. T. Jeong and C. H. Song, Hepatoprotective effect of water extract from Chrysanthemum indicum L. flower, Chin. Med., 2013, 8, 7 CrossRef PubMed.
- Y. Zhou, C. Wang, J. Kou, M. Wang, X. Rong, X. Pu, X. Xie, G. Han and X. Pang, Chrysanthemi Flos extract alleviated acetaminophen-induced rat liver injury via inhibiting oxidative stress and apoptosis based on network pharmacology analysis, Pharm. Biol., 2021, 59, 1378–1387 CAS.
- F. Zhu, Product of geographical indication—Hangzhou white chrysanthemum, China Standardization, 2008, vol. 7, pp. 70–71 Search PubMed.
- G. Jia, Z. Li, D. Ying, B. Wang, Comparative Study on Sensory Quality and Bioactive Components of Traditional Chrysanthemum(Duoju) and Taiju, The Food Industry, 2014, 236–239 Search PubMed.
- R. C. McKellar, B. D. McGarvey, R. Tsao, X. Lu and K. P. Knight, Application of the electronic nose to the classification of resistance to Western flower thrips in chrysanthemums, J. Chem. Ecol., 2005, 31, 2439–2450 CrossRef CAS PubMed.
- Y. Wu, J. Wang, H. Yu, X. Yu and Z. Yu, Analysis of Volatile Components of Different Dried Chrysanthemum Nankingense Based on Headspace Solid Phase Microextraction-Gas Chromatography-Mass Spectrometry and OAV, Food Sci., 2022,(2096–4188) Search PubMed.
- Y. B. Wu, Z. M. Yan, J. J. Zhao and Y. H. Zhu, Headspace solid-phase microextraction and gas chromatograph–mass spectrometry of volatile components of Chrysanthemum morifolium Ramat., Trop. J. Pharm. Res., 2016, 15, 2241–2244 CrossRef CAS.
- G. Zhou, S. Zhang and Z. Qian, GC-MS Analysis of Volatile Components in Four Species of Chrysanthemum morifolium, Mol. Plant Breed., 2018, 3718–3726 Search PubMed.
- Y. P. Lin, D. Y. Si and C. X. Liu, Advances of liquid chromatography/mass spectrometry combined with chemometric approaches applied to metabonomics, Chin. J. Anal. Chem., 2007, 35(10), 1535–1540 CAS.
- S. G. Duan, K. Hong, M. Tang, J. Tang and Y. Yi, Untargeted metabolite profiling of petal blight in field-grown Rhododendron agastum using GC-TOF-MS and UHPLC-QTOF-MS/MS, Phytochemistry, 2021, 184, 112655 CrossRef CAS.
- S. Mi, X. N. Zhang, Y. H. Wang, F. L. Yan, Y. X. Sang, H. Y. Gong, X. H. Wang, Geographical discrimination and authentication of Chinese garlic based on multi-element, volatile and metabolomics profiling combined with chemometrics, Food Control, 2021, 130, 0956–7135 Search PubMed.
- A. Villate, M. San Nicolas, M. Gallastegi, P. A. Aulas, M. Olivares, A. Usobiaga, N. Etxebarria and O. Aizpurua-Olaizola, Review: Metabolomics as a prediction tool for plants performance under environmental stress, Plant Sci., 2021, 303, 110789 CrossRef CAS PubMed.
- L. N. Zhang, L. Wang, Z. Q. Shi, P. Li and H. J. Li, A metabolomic strategy based on integrating headspace gas chromatography-mass spectrometry and liquid chromatography-mass spectrometry to differentiate the five cultivars of Chrysanthemum flower, RSC Adv., 2018, 8, 9074–9082 RSC.
- D. W. Luo, M. Z. He, J. M. Li, H. Du, Q. P. Mao, N. Pei, G. Y. Zhong and H. Ouyang, Integrating the rapid constituent profiling strategy and multivariate statistical analysis for herb ingredients research, with Chinese official rhubarb and Tibetan rhubarb as an example, Arabian J. Chem., 2021, 14, 103269 CrossRef CAS.
- G. Rocchetti, G. Chiodelli, G. Giuberti, S. Ghisoni, G. Baccolo, F. Blasi, D. Montesano, M. Trevisan and L. Lucini, UHPLC-ESI-QTOF-MS profile of polyphenols in Goji berries (Lycium barbarum L.) and its dynamics during in vitro gastrointestinal digestion and fermentation, J. Funct. Foods, 2018, 40, 564–572 CrossRef CAS.
- M. B. Mohamed, G. Rocchetti, D. Montesano, S. B. Ali, F. Guasmi, N. Grati-Kamoun and L. Lucini, Discrimination of Tunisian and Italian extra-virgin olive oils according to their phenolic and sterolic fingerprints, Food Res. Int., 2018, 106, 920–927 CrossRef PubMed.
- D. Granato, P. Putnik, D. B. Kovǎcević, J. S. Santos, V. Calado, R. S. Rocha and A. Pomerantsev, Trends in chemometrics: Food authentication, microbiology, and effects of processing, Compr. Rev. Food Sci. Food Saf., 2018, 17(3), 663–677 CrossRef PubMed.
- H. Parastar and R. Tauler, Big (Bio)Chemical Data Mining Using Chemometric Methods: A Need for Chemists, Angew. Chem., Int. Ed. Engl., 2018, 61, 11596 Search PubMed.
- J. Lopes, A. Lima, R. Cangussu, M. Silva and L. S. Santos, Application of spectroscopic techniques and chemometric methods to differentiate between true cinnamon and false cinnamon, Food Chem., 2021, 368, 130746 CrossRef PubMed.
- H. Tu, M. Wu, W. Huang and L. Wang, Screening of potential biomarkers and their predictive value in early stage non-small cell lung cancer: a bioinformatics analysis, Transl. Lung Cancer Res., 2019, 8, 797–807 CrossRef CAS PubMed.
- S. D. Walker and S. McEldowney, Molecular docking: a potential tool to aid ecotoxicity testing in environmental risk assessment of pharmaceuticals, Chemosphere, 2013, 93, 2568–2577 CrossRef CAS PubMed.
- H. Wang, D. Gu, W. Miao, G. Hong, H. Wu, G. Tian, L. Qian, Y. Yi and T. Jing, A strategy based on gas chromatography-mass spectrometry and virtual molecular docking for analysis and prediction of bioactive composition in natural product essential oil, J. Chromatogr. A, 2017, 1501, 128 CrossRef CAS PubMed.
- X. Zhu, Y. Chen and R. Subramanian, Comparison of information-dependent acquisition, SWATH, and MS(All) techniques in metabolite identification study employing ultrahigh-performance liquid chromatography-quadrupole time-of-flight mass spectrometry, Anal. Chem., 2014, 86, 1202–1209 CrossRef CAS PubMed.
- R. Álvarez-Ruiz and Y. Picó, Sequential window acquisition of all theoretical fragments versus information dependent acquisition for suspected-screening of pharmaceuticals in sediments and mussels by ultra-high pressure liquid chromatography-quadrupole time-of-flight-mass spectrometry, J. Chromatogr. A, 2019, 1595, 81–90 CrossRef PubMed.
- L. C. Wang, B. Z. Su, Z. D. Zeng, C. Li, X. J. Zhao, W. J. Lv, Q. H. Xuan, Y. Ouyang, L. N. Zhou and P. Y. Yin, Ion-Pair Selection Method for Pseudotargeted Metabolomics Based on SWATH MS Acquisition and Its Application in Differential Metabolite Discovery of Type 2 Diabetes, Anal. Chem., 2018, 90(19), 11401–11408 CrossRef CAS PubMed.
- L. Man, X. Diao, X. Cheng, Y. Sun and L. Zhang, Nontargeted SWATH acquisition mode for metabolites identification of osthole in rats using ultra-high-performance liquid chromatography coupled to quadrupole time-of-flight mass spectrometry, RSC Adv., 2018, 8, 14925–14935 RSC.
- Z. Lai, H. Tsugawa, G. Wohlgemuth, S. Mehta, M. Mueller, Y. Zheng, A. Ogiwara, J. Meissen, M. Showalter, K. Takeuchi, T. Kind, P. Beal, M. Arita and O. Fiehn, Identifying metabolites by integrating metabolome databases with mass spectrometry cheminformatics, Nat. Methods, 2018, 15, 53–56 CrossRef CAS PubMed.
- J. Ji, P. Zhu, F. Cui, F. Pi, Y. Zhang and X. Sun, The disorder metabolic profiling in kidney and spleen of mice induced by mycotoxins deoxynivalenol through gas chromatography mass spectrometry, Chemosphere, 2017, 180, 267–274 CrossRef CAS PubMed.
- H. Yuan, S. Jiang, Y. Liu, M. Daniyal, Y. Jian, C. Peng, J. Shen, S. Liu and W. Wang, The flower head of Chrysanthemum morifolium Ramat. (Juhua): A paradigm of flowers serving as Chinese dietary herbal medicine, J. Ethnopharmacol., 2020, 261, 113043 CrossRef CAS PubMed.
- S. Chen, J. Liu, G. Dong, X. Zhang, Y. Liu, W. Sun and A. Liu, Flavonoids and caffeoylquinic acids in Chrysanthemum morifolium Ramat flowers: A potentially rich source of bioactive compounds, Food Chem., 2021, 344, 128733 CrossRef CAS PubMed.
- X. Y Xu, C. X. Li, K. B. Zheng and A. P. Li, Chemical Constituents of Water Extract from Chrysanthemum morifolium Flowers by UHPLC-ESI-Orbitrap MS, J. Trop. Subtrop. Bot., 2021, 29, 96–104 Search PubMed.
- X. Liu, X. Fan, X. Wang, R. Liu, C. Meng and C. Wang, Structural characterization and screening of chemical markers of flavonoids in Lysimachiae Herba and Desmodii Styracifolii Herba by ultra high-performance liquid chromatography quadrupole time-of-flight tandem mass spectrometry based metabolomics approach, J. Pharm. Biomed. Anal., 2019, 171, 52–64 CrossRef CAS PubMed.
- G. M. Morris, D. S. Goodsell, R. S. Halliday, R. Huey, W. E. Hart, R. K. Belew and A. J. Olson, Automated docking using a Lamarckian genetic algorithm and an empirical binding free energy function, J. Comput. Chem., 1998, 19, 1639–1662 CrossRef CAS.
- L. Wang, B. Su, Z. Zeng, C. Li, X. Zhao, W. Lv, Q. Xuan, Y. Ouyang, L. Zhou, P. Yin, X. Peng, X. Lu, X. Lin and G. Xu, Ion-Pair Selection Method for Pseudotargeted Metabolomics Based on SWATH MS Acquisition and Its Application in Differential Metabolite Discovery of Type 2 Diabetes, Anal. Chem., 2018, 90, 11401–11408 CrossRef CAS PubMed.
- R. Li, Z. Li, P. Leng, Z. Hu, J. Wu and D. Dou, Transcriptome sequencing reveals terpene biosynthesis pathway genes accounting for volatile terpene of tree peony, Planta, 2021, 254, 67 CrossRef CAS PubMed.
- J. B. Sharmeen, F. M. Mahomoodally, G. Zengin and F. Maggi, Essential Oils as Natural Sources of Fragrance Compounds for Cosmetics and Cosmeceuticals, Molecules, 2021, 26, 666 CrossRef CAS PubMed.
- L. L. Fan, S. S. Zhang, M. X. Yao and Y. Q. Han, Changes in chemical compositions of Chrysanthemi Flos after frying and protective effects on CCl_4-induced acute liver injury in mice, J. Biochem. Mol. Toxicol., 2020, 45, 3144–3154 Search PubMed.
- N. Brooijmans and I. D. Kuntz, Molecular recognition and docking algorithms, Annu Rev Biophys Biomol Struct, 2003, 32, 335–373 CrossRef CAS PubMed.
- F. Stanzione, I. Giangreco and J. C. Cole, Use of molecular docking computational tools in drug discovery, Prog. Med. Chem., 2021, 60, 273–343 Search PubMed.
- W. Guo, L. Luo, Y. Meng, W. Chen, L. Yu, C. Zhang, Z. Qiu and P. Cao, Luteolin alleviates methionine-choline-deficient diet-induced non-alcoholic steatohepatitis by modulating host serum metabolome and gut microbiome, Front. Nutr., 2022, 9, 936237 CrossRef PubMed.
- P. B. Bhosale, A. Abusaliya, H. H. Kim, S. E. Ha, M. Y. Park, S. H. Jeong, P. Vetrivel, J. D. Heo, J. A. Kim, C. K. Won, H. W. Kim and G. S. Kim, Apigetrin Promotes TNFα-Induced Apoptosis, Necroptosis, G2/M Phase Cell Cycle Arrest, and ROS Generation through Inhibition of NF-κB Pathway in Hep3B Liver Cancer Cells, Cells, 2022, 11, 2734 CrossRef CAS PubMed.
- L. Pan, F. Feng, J. Wu, L. Li, H. Xu, L. Yang, K. Xu and C. Wang, Diosmetin inhibits cell growth and proliferation by regulating the cell cycle and lipid metabolism pathway in hepatocellular carcinoma, Food Funct., 2021, 12, 12036–12046 RSC.
- J. P. Park, D. H. Park, Y. Jeon and N. Yamabe, Eupatilin inhibits angiogenesis-mediated human hepatocellular metastasis by reducing MMP-2 and VEGF signaling, Bioorg. Med. Chem. Lett., 2018, 28(19), 3150–3154 CrossRef CAS PubMed.
- A. M. Rousta, S. M. S. Mirahmadi, A. Shahmohammadi, Z. Mehrabi, S. Fallah, T. Baluchnejadmojarad and M. Roghani, Therapeutic Potential of Isorhamnetin following Acetaminophen-Induced Hepatotoxicity through Targeting NLRP3/NF-κB/Nrf2, Drug Res., 2022, 72(5), 245–254 CrossRef CAS PubMed.
- H. Gungor, M. Ekici and M. B. Ates, Lipid-lowering, anti-inflammatory, and hepatoprotective effects of isorhamnetin on acetaminophen-induced hepatotoxicity in mice, Drug Chem. Toxicol., 2022, 1–9, DOI:10.1080/01480545.2022.2069256.
- L. F. Chou, C. Y. Chen, W. H. Yang, C. C. Chen, J. L. Chang, Y. L. Leu, M. J. Liou and T. H. Wang, Suppression of Hepatocellular Carcinoma Progression through FOXM1 and EMT Inhibition via Hydroxygenkwanin-Induced miR-320a Expression, Biomolecules, 2019, 10, 20 CrossRef PubMed.
Footnote |
| † Electronic supplementary information (ESI) available. See DOI: https://doi.org/10.1039/d2ra05698d |
| This journal is © The Royal Society of Chemistry 2022 |