 Open Access Article
LSCF–WO3 semiconductor composite electrolytes for low-temperature solid oxide fuel cells†
Xiaoqian Jina,
Cui Gaoa,
Zhi Liua,
Wenjing Dong ab,
Chen Xia*a,
Baoyuan Wang
 ab,
Hao Wang
 ab and
Xunying Wang
 *ab
*ab
aSchool of Microelectronics, Hubei University, Wuhan 430062, China. E-mail: wangxunying@hubu.edu.cn; chenxia@hubu.edu.cn
bHubei Yangtze Memory Laboratories, Wuhan 430205, China
First published on 26th October 2022
Abstract
The La0.6Sr0.4Co0.2Fe0.8O3−δ (LSCF)–WO3 semiconductor composite was applied as an electrolyte for low-temperature solid oxide fuel cells (LTSOFCs). The study results revealed that the fuel cell could output a maximum power density (Pmax) of 812 mW cm−2 when the weight ratio of LSCF to WO3 was 8![[thin space (1/6-em)]](https://www.rsc.org/images/entities/char_2009.gif) :
:![[thin space (1/6-em)]](https://www.rsc.org/images/entities/char_2009.gif) 2 (8LSCF–2WO3), and its open-circuit voltage (OCV) was higher than 1.0 V. This indicated that there was no short circuit problem in this fuel cell device and 80 wt% LSCF existed in the electrolyte layer. This was mainly due to the suppressed electronic conductivity and increased ionic conductivity of the composite as compared with LSCF due to the introduction of the WO3 wide band semiconductor. The oxygen ionic conductivity of the 8LSCF–2WO3 electrolyte was 0.337 S cm−1, which is much higher than that of the pure LSCF material. According to the XPS analysis results, a higher oxygen vacancy content at the heterointerface between LSCF and WO3 contributed to the increased ionic conductivity.
2 (8LSCF–2WO3), and its open-circuit voltage (OCV) was higher than 1.0 V. This indicated that there was no short circuit problem in this fuel cell device and 80 wt% LSCF existed in the electrolyte layer. This was mainly due to the suppressed electronic conductivity and increased ionic conductivity of the composite as compared with LSCF due to the introduction of the WO3 wide band semiconductor. The oxygen ionic conductivity of the 8LSCF–2WO3 electrolyte was 0.337 S cm−1, which is much higher than that of the pure LSCF material. According to the XPS analysis results, a higher oxygen vacancy content at the heterointerface between LSCF and WO3 contributed to the increased ionic conductivity.
1 Introduction
Solid oxide fuel cell (SOFC) is a power generating device that can directly convert the chemical energy of the fuel into electricity with high efficiency due to the advantages of low noise, environment friendly nature, and no requirement of precious metal catalysts.1–6 Conventional high-temperature SOFCs operate at about 1000 °C, which leads to several concerns, such as difficulty in material selection and sealing the fuel cell stack, slow start, and poor durability.7–9 These problems could be effectively solved when their working temperature reduced to <600 °C. The electrolyte is a critical issue affecting low-temperature SOFC (LTSOFC) performance, and developing novel electrolyte materials with high ionic conductivity at low temperatures is an effective way for decreasing the operating temperature of SOFCs.10–12Recently, numerous studies have widely demonstrated that constructing heterostructures with semiconductors and ionic conductors can evidently increase the ionic conductivity of electrolytes at low temperatures.13–18 In addition, the SOFC based on the semiconductor-ionic conductor composites (SICs) revealed excellent performance at temperatures lower than 600 °C.19–21 Most of these SIC-based SOFCs could output a maximum power density higher than 700 mW cm−2 at a temperature of about 550 °C when the content of semiconductors in SICs was appropriate.22–24 Interestingly, although a large amount of semiconductors (20–40%) exist in the electrolyte layer, there is no short circuit problem for the device, and the corresponding open circuit voltages (OCVs) of the fuel cell were higher than 1.0 V. Some studies even reported LTSOFC with semiconductor as an electrolyte and also showed OCVs higher than 1.0 V.9,25,26 Various mechanisms have been proposed to explain this phenomenon.27–30 Zhu et al.29 ascribed this to the formation of Schottky junction at the interface of the anode and electrolyte layers. Based on this work, energy band alignment at the interface between electrodes and electrolyte or at the bulk heterojunction of electrolyte layers was proposed to explain the impediment of electron transport in the SIC-based SOFCs.27,30 Besides, Chen et al.28 demonstrated that superoxide-ion conducting phase shells could avoid short circuit problems induced by the LST wide-band semiconductors.
Recently, different from the above-mentioned studies, which ascribed the high OCV of SIC-based SOFCs to the intercept of electron conduction, Dong et al.31 considered that a high ratio of ionic conductivity to electronic conductivity of the electrolyte layer is the key reason for the high OCV of SIC-based SOFCs, and both their numerical model and experimental data demonstrated this mechanism. This inference provides a new way for developing novel electrolyte materials. It is well known that LSCF is a kind of mixed-ionic-electronic conductor that possesses both high electronic and ionic conductivities at low temperatures.32 According to Dong et al.’s work,31 if mixed LSCF with insulator or even wide band semiconductor with proper ratio to inhibit the electronic conduction in LSCF material, it is promising to apply LSCF as electrolyte for SOFC. Therefore, in this work, the WO3 wide-band semiconductor was chosen as a secondary phase and mixed with LSCF to fabricate a LSCF–WO3 semiconductor electrolyte for SOFCs. On the one hand, the introduction of WO3, which is a kind of wide-band semiconductor, can decrease the electronic conductivity of the electrolyte layer; further, the heterointerfaces between LSCF and WO3 are expected to provide fast oxygen ion transport paths, which can increase the ionic conductivity of the electrolyte. The properties of the composite and the mechanisms of the SOFC based on this electrolyte were investigated.
2 Experimental
2.1 Material preparation and characterization
LSCF was purchased from Ningbo SOFCMAN Energy Technology Co., Ltd, China, and WO3 was purchased from Aladdin Chemical Reagent Co., Ltd. The LSCF–WO3 composites with different weight ratios (9.5![[thin space (1/6-em)]](https://www.rsc.org/images/entities/char_2009.gif) :
:![[thin space (1/6-em)]](https://www.rsc.org/images/entities/char_2009.gif) 5, 9
5, 9![[thin space (1/6-em)]](https://www.rsc.org/images/entities/char_2009.gif) :
:![[thin space (1/6-em)]](https://www.rsc.org/images/entities/char_2009.gif) 1, 8
1, 8![[thin space (1/6-em)]](https://www.rsc.org/images/entities/char_2009.gif) :
:![[thin space (1/6-em)]](https://www.rsc.org/images/entities/char_2009.gif) 2, 6
2, 6![[thin space (1/6-em)]](https://www.rsc.org/images/entities/char_2009.gif) :
:![[thin space (1/6-em)]](https://www.rsc.org/images/entities/char_2009.gif) 4, and 4
4, and 4![[thin space (1/6-em)]](https://www.rsc.org/images/entities/char_2009.gif) :
:![[thin space (1/6-em)]](https://www.rsc.org/images/entities/char_2009.gif) 6) were fabricated by directly mixing the two materials and then manually grinding the mixture in an agate mortar for 30 min. The LSCF–WO3 composites with different weight ratios can be easily reproduced by this method.
6) were fabricated by directly mixing the two materials and then manually grinding the mixture in an agate mortar for 30 min. The LSCF–WO3 composites with different weight ratios can be easily reproduced by this method.
The X-ray diffraction patterns were conducted using a Bruker D8 with Cu Kα radiation (λ = 1.54 Å). The morphological features of the materials were observed using a field emission scanning electron microscope (FESEM, JEOL JSM7100F) equipped with an Oxford energy-dispersive spectrometer (EDS). The elemental distributions in the cross-section of the fuel cell was characterized using a ZEISS FIB-SEM crossbeam 540 (Germany). For conductivity measurements, 0.42 g LSCF–WO3 composite was uniaxially pressed into pellets (Φ 13 mm) with a thickness of about 0.982 mm under a load of 500 MPa. Both sides of the pellet were coated with silver pulp. The electrical, O2− and H+ conductivities in the temperature range from 550 °C to 450 °C were measured by a linear scan voltage method using a Keithley 2460 instrument under nitrogen, air and hydrogen atmospheres, respectively.
2.2 Fuel cell fabrication and electrochemical performance tests
The NCAL-coated Ni (Ni-NCAL) foam electrode was prepared by brushing a catalyst slurry composed of 70 wt% NCAL and 30 wt% terpineol onto a Ni foam; then the obtained wet Ni-NCAL was heated at 100 °C for about 10 minutes to remove terpineol. The fuel cell device was fabricated by a dry press method with 0.3 g LSCF–WO3 composite sandwiched between two Ni-NCAL electrodes under about 500 MPa for 2 min. The effective area of the cell was 0.64 cm2, and the thickness was 1.8 mm. The assembled cell was put on the test fixture and then into the test furnace at 550 °C to preheat for about half an hour. During the test, hydrogen and air are continuously supplied as the fuel and oxidant, respectively. The flow rate of hydrogen and air is 100–150 mL min−1 and 800–1000 mL min−1, respectively. The polarization curves were tested by electronic load (IT8511, ITECH). Electrochemical impedance spectroscopy (EIS) of fuel cells in a hydrogen/air atmosphere was performed using an electrochemical workstation (Gamry Reference 3000). Measurements were made in the open-circuit mode with a 10 mV AC signal in the frequency range from 0.1 Hz to 106 Hz.3 Results and discussions
The XRD patterns of original LSCF and WO3 are shown in Fig. 1. The LSCF sample was ascribed to the pure perovskite phase according to JCPDS no. 89-5720;33 and the WO3 sample was a monoclinic structure according to JCPDS no. 72-1465. To study the stability of WO3 in a H2 atmosphere, the XRD pattern of the WO3 material treated in H2 at 550 °C for 2 h is also given in Fig. 1. It can be seen that there were no obvious new peaks compared with the original WO3 pattern, indicating the good stability of the WO3 material in the H2 atmosphere. The LSCF–WO3 (80 wt% LSCF) composite was also treated in a H2 atmosphere at 550 °C for 2 h to investigate the compatibility of these two materials. The corresponding XRD pattern in Fig. 1 revealed that there was no new phase in the treated sample, indicating the good compatibility. Moreover, the XRD pattern of the electrolyte layer near the anode side in the tested fuel cell was also characterized (Fig. S1†). After the electrochemical performance tests, it was hard to remove the NCAL electrode completely. Therefore, the XRD pattern of NCAL in the anode also appeared in the pattern. The appearance of Ni and NiO patterns are due to the reduction of NCAL at the anode.34 It can be seen that there was no obvious change in the diffraction peaks of both LSCF and WO3 compared with Fig. 1, although the diffraction peaks of WO3 become weaker due to its smaller amount in the composite and effect of anode materials. This indicates the good stability of the composite material in the SOFC operating conditions.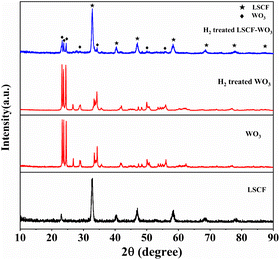 | ||
| Fig. 1 XRD patterns of the original LSCF and WO3, H2-treated WO3 and WO3–LSCF (80 wt% LSCF) composites (550 °C for 2 h). | ||
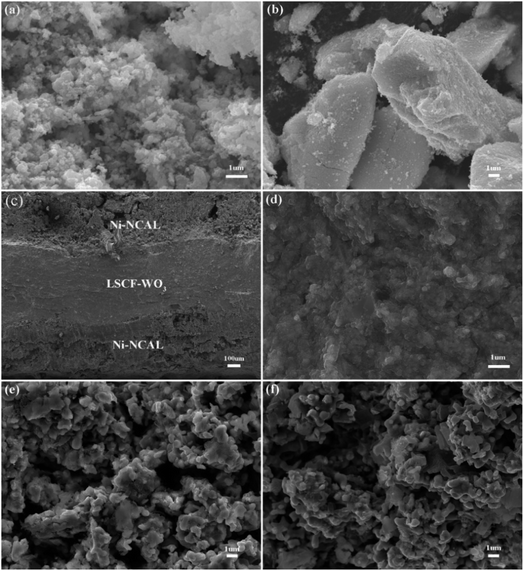
The morphological images of original LSCF and WO3 are shown in Fig. 2(a) and (b), respectively. As shown in the figures, the LSCF material is composed of nanoscale particles, and the WO3 sample is composed of microscale particles. The LSCF–WO3 composite electrolytes were fabricated by a direct grinding method. To evaluate the homogeneity of the composite, the elemental distributions in the cross-section of the fuel cell with 8LSCF–2WO3 electrolyte were characterized using a FIB-SEM (Fig. S2†). The EDS mapping images indicated the homogeneous distribution of LSCF and WO3. Fig. 2(c) shows the cross-sectional view of the operated fuel cell with the LSCF–WO3 (80 wt% LSCF) electrolyte. In the figure, we can see that the electrolyte and electrode layers are in good contact with the electrode layers, and no cracks are detected in the interface area. It indicates that the cell has excellent mechanical strength.
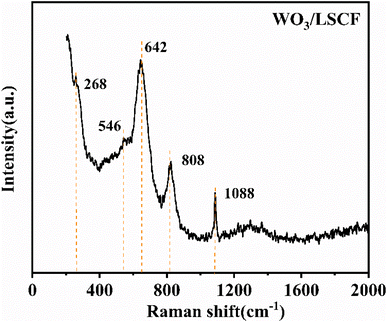
As shown in Fig. 2(e) and (f), both of the electrode layers are porous structures. It is beneficial for gas transportation. Fig. 2(d) shows the enlarged morphology of the electrolyte layer in tested fuel cells (Fig. 2(c)). It can be seen that the electrolyte layer possessed dense structures, although the electrolyte did not experience high-temperature sintering. According to our previous work,34,35 the formation of the gas-tight morphology of the electrolyte layer was due to the in situ densification process. The NCAL anode can be reduced by H2, thus generating Ni, Co and free Li+. The generated lithium ions diffuse to the cathode direction and combine with H2O and CO2 in air to produce Li2CO3, which is the molten state under the fuel cell working temperature (550 °C) and can fill the pores in the electrolyte layer. Moreover, the generated Li2CO3 is beneficial for increasing the ionic conductivity and decreasing the electronic conductivity of the electrolyte layer. The existence of Li2CO3 was further verified by Raman spectra, as shown in Fig. 3. The peaks at 268 cm−1 and 808 cm−1 were attributed to the tensile vibration of W–O–W bond and the bending vibration of W![[double bond, length as m-dash]](https://www.rsc.org/images/entities/char_e001.gif) O bond, respectively.36–38 The peaks centered at 546 cm−1 and at 632 cm−1 were ascribed to LSCF.33,39 The sharp peak at the 1088 cm−1 position indicated the formation of Li2CO3 in the electrolyte layer.
O bond, respectively.36–38 The peaks centered at 546 cm−1 and at 632 cm−1 were ascribed to LSCF.33,39 The sharp peak at the 1088 cm−1 position indicated the formation of Li2CO3 in the electrolyte layer.
The performances of the fuel cells with different electrolytes were evaluated. As shown in Fig. 4, the OCV of the SOFC with the 95LSCF–5WO3 composite is <0.9 V. With the increase in WO3 content, both the OCV and output power density increased. When the weight ratio of the WO3 is 20%, the output maximum power density (Pmax) achieved the highest value (813 mW cm−2). Further increase in the WO3 content led to a decrease in Pmax. As a typical cathode catalyst for LTSOFCs, LSCF possesses excellent electronic conductivity,32,40 whereas WO3 is a kind of wide-band semiconductor, which possesses poor electronic conductivity (Fig. S3b†). Therefore, it is rational to infer when the LSCF content is 95%, too much LSCF leads to a high electronic conductivity and thus results in a low OCV. The introduction of WO3 decreased the electronic conductivity of the electrolyte layer and results in a higher OCV. However, too much WO3 lead to a decrease in the composite electrolyte conductivity due to the poor ionic conductivity of WO3 (Fig. S3a†) compared with LSCF (Fig. S4a†). Therefore, the output power density of SOFC decreased when the content of WO3 was higher than 20%.
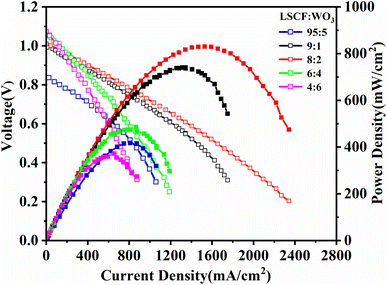 | ||
| Fig. 4 Electrochemical performance of fuel cells based on the LSCF–WO3 composite electrolyte with different compositions at 550 °C. | ||
The electronic conductivity and ionic conductivity of the materials were further studied according to the slope of the LSV curves. The electronic conductivities of the materials were tested in a N2 atmosphere. The O2− and H+ conductivities of the materials were characterized in air and H2 atmospheres, respectively. The electronic conductivity of the 8LSCF–2WO3 composite at 550 °C is about 0.00741 S cm−1, much lower than that of the pure LSCF material (0.131 S cm−1, Fig. S4(b)†).
However, this value is still too high to satisfy the requirement of traditional SOFCs for electrolyte materials. According to the ref. 31, insulation of electrolyte materials is not an essential condition for high OCV of fuel cells, and the high ratio of ionic conductivity to electronic conductivity of the electrolyte layer is the key reason for the high OCV of SIC-based SOFCs. Therefore, the ratio of ionic conductivity (σi) to electronic conductivity (σe) of the 8LSCF–2WO3 composite at 550 °C was calculated, where σi is the sum of O2− conductivity ( , 0.337 S cm−1) and proton conductivity (
 , 0.004 S cm−1) at 550 °C.
  and
and  were calculated according to the following equations:
 | (1) |
 | (2) |
![[thin space (1/6-em)]](https://www.rsc.org/images/entities/char_2009.gif) :
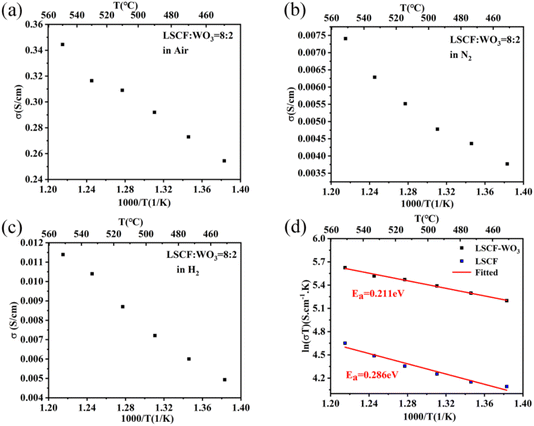
:![[thin space (1/6-em)]](https://www.rsc.org/images/entities/char_2009.gif) σe is 0.341 S cm−1 and 48.7, respectively. Under this condition, the OCV of the fuel cell device should be over 1.1 V according to the numerical model reported by Dong et al.31 which is consistent with the OCV (1.011 V) of the 8LSCF–2WO3 composite electrolyte-based SOFC. For comparison, the ratio of ionic conductivity (0.015 S cm−1) to electronic conductivity (0.027 S cm−1) of 95LSCF–5WO3 at 550 °C was also calculated, and the obtained value was only about 0.56, much lower than that of the 8LSCF–2WO3 composite. This is consistent with the lower OCV of fuel cells with the 95LSCF–5WO3 composite (Fig. 4). According to Fig. 5(a) and (c), the 8LSCF–2WO3 composite is a kind of O2− conductor. Interestingly, the O2− conductivity of 8LSCF–2WO3 is higher than that of pure LSCF (Fig. 5(d)), whereas the O2− conductivity of WO3 (Fig. S3(a)†) is greatly lower than that of LSCF (Fig. S4(a)†). It can be seen from Fig. 5(d) that the activation energy of O2− conduction for the 8LSCF–2WO3 composite is only 0.211 eV, 0.075 eV lower than LSCF. To investigate the reason for the high ionic conductivity of the composite, the oxygen vacancies of LSCF, WO3 and 8LSCF–2WO3 composites with different treatment conditions were characterized by XPS, as shown in Fig. 6. The deconvolution results revealed three peaks, which are assigned to lattice oxygen (528–530 eV), oxygen vacancy (530–532 eV) and the –OH (532–534 eV) group adsorbed at the surface. It can be seen that compared with LSCF, WO3 possessed a much lower oxygen vacancy content, which leads to a lower ionic conductivity of WO3. The oxygen vacancy contents of the three samples decreased after treatment in air at 550 °C for 2 h, but increased after treatment in a H2 atmosphere at 550 °C for 2 h. This is due to the different oxygen partial pressure between air and H2 atmospheres. It has been widely reported that a lower oxygen pressure is beneficial for increasing the oxygen content of LSCF and WO3.41,42 The oxygen vacancy content of 8LSCF–2WO3 is obviously higher than that of LSCF, which is mainly due to the introduction of heterointerfaces possessing a large amount of oxygen vacancies.43,44 It is contributed to the decreased activation energy of O2− conduction and increased ionic conductivity of the composite compared with pure LSCF.43
σe is 0.341 S cm−1 and 48.7, respectively. Under this condition, the OCV of the fuel cell device should be over 1.1 V according to the numerical model reported by Dong et al.31 which is consistent with the OCV (1.011 V) of the 8LSCF–2WO3 composite electrolyte-based SOFC. For comparison, the ratio of ionic conductivity (0.015 S cm−1) to electronic conductivity (0.027 S cm−1) of 95LSCF–5WO3 at 550 °C was also calculated, and the obtained value was only about 0.56, much lower than that of the 8LSCF–2WO3 composite. This is consistent with the lower OCV of fuel cells with the 95LSCF–5WO3 composite (Fig. 4). According to Fig. 5(a) and (c), the 8LSCF–2WO3 composite is a kind of O2− conductor. Interestingly, the O2− conductivity of 8LSCF–2WO3 is higher than that of pure LSCF (Fig. 5(d)), whereas the O2− conductivity of WO3 (Fig. S3(a)†) is greatly lower than that of LSCF (Fig. S4(a)†). It can be seen from Fig. 5(d) that the activation energy of O2− conduction for the 8LSCF–2WO3 composite is only 0.211 eV, 0.075 eV lower than LSCF. To investigate the reason for the high ionic conductivity of the composite, the oxygen vacancies of LSCF, WO3 and 8LSCF–2WO3 composites with different treatment conditions were characterized by XPS, as shown in Fig. 6. The deconvolution results revealed three peaks, which are assigned to lattice oxygen (528–530 eV), oxygen vacancy (530–532 eV) and the –OH (532–534 eV) group adsorbed at the surface. It can be seen that compared with LSCF, WO3 possessed a much lower oxygen vacancy content, which leads to a lower ionic conductivity of WO3. The oxygen vacancy contents of the three samples decreased after treatment in air at 550 °C for 2 h, but increased after treatment in a H2 atmosphere at 550 °C for 2 h. This is due to the different oxygen partial pressure between air and H2 atmospheres. It has been widely reported that a lower oxygen pressure is beneficial for increasing the oxygen content of LSCF and WO3.41,42 The oxygen vacancy content of 8LSCF–2WO3 is obviously higher than that of LSCF, which is mainly due to the introduction of heterointerfaces possessing a large amount of oxygen vacancies.43,44 It is contributed to the decreased activation energy of O2− conduction and increased ionic conductivity of the composite compared with pure LSCF.43
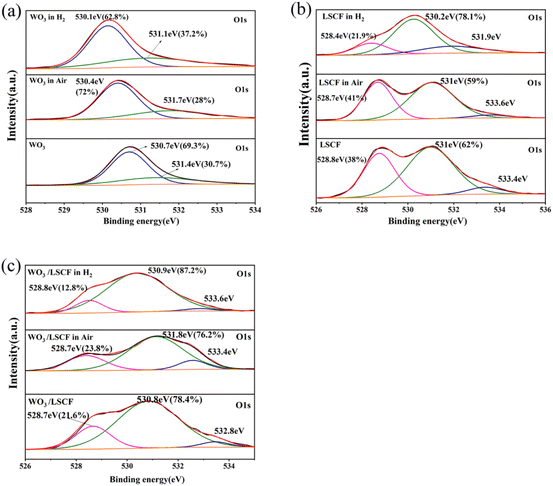 | ||
| Fig. 6 XPS spectra of O 1s of (a) WO3, (b) LSCF and (c) 8LSCF–2WO3 composites under different conditions. | ||
The low temperature performance of the fuel cell based on the 8LSCF–2WO3 composite electrolyte was tested at a temperature between 550 °C and 490 °C, as shown in Fig. 7(a). It can be seen that the output maximum power density of the fuel cell can still reach 195 mW cm−2 when the temperature was lowered to 490 °C, indicating good low temperature performance of the fuel cell. The corresponding EIS characterization at different temperatures of the fuel cell with the 8LSCF–2WO3 electrolyte is shown in Fig. 7(b). The equivalent circuit R0(R1Q1)(R2Q2) was adopted to fit the experimental data, and the fitting data are listed in Table 1. In the equivalent circuit, R0 represents the ohmic resistance, which includes both electronic resistance and bulk ionic resistance of the fuel cell; R1 corresponds to the arc at high frequencies of the EIS, which reflects the grain boundary resistance of ionic conduction; R2 represents the charge transfer resistance during the electrode reaction and corresponds to the medium frequency arc.45,46 The fitting results show that R0, R1 and R2 increased with the decrease in temperature. This is due to the lower probability of a reactant species in the activated state at a lower temperature.47 Furthermore, both R1 and R2 increased sharply when the temperature decreased from 510 °C to 490 °C, which is consistent with the serious drop in the fuel cell performance in this temperature range. This indicates that the serious drop of both electrolyte conductivity and catalyst performance is the main reason for the poor fuel cell performance at a temperature lower than 510 °C. Therefore, the proper operation temperature of this fuel cell should be over 510 °C.
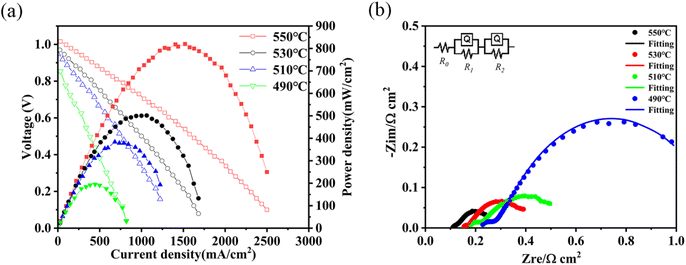 | ||
| Fig. 7 (a) Typical I–V and I–P curves and (b) corresponding EIS of the 2WO3–8LSCF composite electrolyte-based fuel cell at different temperatures. | ||
| T (°C) | R0 | R1 | Q1 | n1 | R2 | Q2 | n2 |
|---|---|---|---|---|---|---|---|
| 550 | 0.1088 | 0.0230 | 0.6554 | 0.5294 | 0.1381 | 3.526 | 0.6868 |
| 530 | 0.1501 | 0.0231 | 0.1214 | 0.5776 | 0.2576 | 1.438 | 0.6066 |
| 510 | 0.1732 | 0.0499 | 0.0379 | 0.5958 | 0.3542 | 1.204 | 0.5333 |
| 490 | 0.1824 | 0.1505 | 0.6729 | 0.2383 | 0.8538 | 0.6355 | 0.7097 |
4 Conclusions
In this work, a LSCF–WO3 semiconductor composite has been successfully applied as the electrolyte of LTSOFCs. When the weight ratio of WO3 is 20%, the fuel cell achieved the best performance, and there was no short circuit problem for the fuel cell. This is due to that the introduction of wide-band semiconductor WO3 that decreased the electronic conductivity and increased the ionic conductivity compared with pure LSCF. The higher ionic conductivity of the composite compared with LSCF is mainly due to the increase in the oxygen vacancy content. This work further certifies that increasing the ratio of ionic conductivity to electronic conductivity of the electrolyte layer by introducing materials with a lower electronic conductivity is an effective way to solve the electric leakage problem of the SOFC.Conflicts of interest
There are no conflicts to declare.Acknowledgements
This study was supported by the NSFC (Grant No. 21706054 and No. 12004103).Notes and references
- S. C. Singhal, Solid State Ionics, 2002, 152–153, 405–410 CrossRef CAS.
- M. Ormerod, Chem. Soc. Rev., 2003, 32, 17–28 RSC.
- B. Zhu, Y. Mi, C. Xia, B. Wang, J.-S. Kim, P. Lund and T. Li, Energy Mater., 2021, 1, 100002 CrossRef.
- M. Irshad, M. Khalid, M. Rafique, N. Ahmad, K. Siraj, R. Raza, M. Sadiq, M. Ahsan, A. Ghaffar and A. Ashfaq, RSC Adv., 2021, 11, 14475–14483 RSC.
- C. C. Wang, M. Gholizadeh, B. Hou and X. Fan, RSC Adv., 2021, 11, 7–14 RSC.
- A. R. Noviyanti, Juliandri, S. Winarsih, D. G. Syarif, Y. T. Malik, R. Septawendar and Risdiana, RSC Adv., 2021, 11, 38589–38595 RSC.
- B. Wang, Y. Wang, L. Fan, Y. Cai, C. Xia, Y. Liu, R. Raza, P. A. van Aken, H. Wang and B. zhu, J. Mater. Chem. A, 2016, 4, 15426–15436 RSC.
- B. Zhu, L. Fan, H. Deng, Y. He, M. Afzal, W. Dong, A. Yaqub and N. K. Janjua, J. Power Sources, 2016, 316, 37–43 CrossRef CAS.
- G. Chen, W. Sun, Y. Luo, Y. He, X. Zhang, B. Zhu, W. Li, X. Liu, Y. Ding, Y. Li, S. Geng and K. Yu, ACS Appl. Mater. Interfaces, 2019, 11, 10642–10650 CrossRef CAS PubMed.
- B. C. H. Steele and A. Heinzel, Nature, 2001, 414, 345–352 CrossRef CAS PubMed.
- B. Steele, J. Mater. Sci., 2001, 36, 1053–1068 CrossRef CAS.
- P. Stonehart, J. Appl. Electrochem., 1992, 22, 995–1001 CrossRef CAS.
- Y. Cai, C. Xia, B. Wang, W. Zhang, Y. Wang and B. Zhu, ACS Sustainable Chem. Eng., 2017, 5, 10387–10395 CrossRef CAS.
- G. Zhang, W. Li, W. Huang, Z. Cao, K. Shao, F. Li, C. Tang, C. Li, C. He, Q. Zhang and L. Fan, J. Power Sources, 2018, 386, 56–65 CrossRef CAS.
- S. Rauf, M. A. K. Y. Shah, N. Ali, N. Mushtaq, Z. Tayyab, M. Yousaf, C. P. Yang and B. Wang, Int. J. Hydrogen Energy, 2021, 46, 9861–9873 CrossRef CAS.
- M. A. K. Y. Shah, Y. Lu, N. Mushtaq, M. Singh, S. Rauf, M. Yousaf and B. Zhu, Energy Mater., 2022, 2, 200031 CrossRef.
- S. Xu, Q. Huang, J. Xue, Y. Yang, L. Mao, S. Huang and J. Qian, Inorg. Chem., 2022, 61, 8909–8919 CrossRef PubMed.
- C. Han, L. Zhong, Q. Sun, D. Chen, T.-T. Li, Y. Hu, J. Qian and S. Huang, J. Power Sources, 2021, 499, 229947 CrossRef CAS.
- B. Wang, Y. Cai, C. Xia, J.-S. Kim, Y. Liu, W. Dong, H. Wang, M. Afzal, J. Li, R. Raza and B. Zhu, Electrochim. Acta, 2017, 248, 496–504 CrossRef CAS.
- X. Nie, D. Zheng, Y. Chen, B. Wang, C. Xia, W. Dong, X. Wang, H. Wang and B. Zhu, Int. J. Hydrogen Energy, 2019, 44, 31372–31385 CrossRef CAS.
- H. Cai, L. Zhang, J. Xu, J. Huang, X. Wei, L. Wang, Z. Song and W. Long, Electrochim. Acta, 2019, 320, 134642 CrossRef CAS.
- H. Cai, J. Xu, M. Wu, W. Long, L. Zhang, Z. Song and L. Zhang, J. Eur. Ceram. Soc., 2020, 40, 4361–4365 CrossRef CAS.
- J. Nie, D. Zheng, K. S. Ganesh, M. Akbar, X. Chen, W. Dong, X. Wang, H. Wang and B. Wang, Ceram. Int., 2021, 47, 3462–3472 CrossRef CAS.
- Z. He, J. Nie, K. Liu, K. Sivajee Ganesh, M. Akbar, C. Xia, X. Wang, W. Dong, J. Huang and B. Wang, Int. J. Hydrogen Energy, 2021, 46, 9799–9808 CrossRef CAS.
- Y. Xing, Y. Wu, L. Li, Q. Shi, J. Shi, S. Yun, M. Akbar, B. Wang, J.-S. Kim and B. Zhu, ACS Energy Lett., 2019, 4, 2601–2607 CrossRef CAS.
- W. Dong, Y. Tong, B. Zhu, H. Xiao, L. Wei, C. Huang, B. Wang, X. Wang, J.-S. Kim and H. Wang, J. Mater. Chem. A, 2019, 7, 16728–16734 RSC.
- C. Xia, Y. Mi, B. Wang, B. Lin, G. Chen and B. Zhu, Nat. Commun., 2019, 10, 1707 CrossRef PubMed.
- G. Chen, B. Zhu, H. Deng, Y. Luo, W. Sun, H. Liu, W. Zhang, X. Wang, Y. Qian, X. Hu, S. Geng and J.-S. Kim, ACS Appl. Mater. Interfaces, 2018, 10, 33179–33186 CrossRef CAS PubMed.
- B. Zhu, P. D. Lund, R. Raza, Y. Ma, L. Fan, M. Afzal, J. Patakangas, Y. He, Y. Zhao, W. Tan, Q.-A. Huang, J. Zhang and H. Wang, Adv. Energy Mater., 2015, 5, 1401895 CrossRef.
- B. Zhu, B. Wang, Y. Wang, R. Raza, W. Tan, J.-S. Kim, P. A. van Aken and P. Lund, Nano Energy, 2017, 37, 195–202 CrossRef CAS.
- W. Dong, Z. Xiao, M. Hu, R. Ruan, S. Li, X. Wang, C. Xia, B. Wang and H. Wang, J. Power Sources, 2021, 499, 229963 CrossRef CAS.
- S. P. Jiang, Int. J. Hydrogen Energy, 2019, 44, 7448–7493 CrossRef CAS.
- Y. Chen, X. Nie, B. Wang, C. Xia, W. Dong, X. Wang, H. Wang and B. Zhu, Catal. Today, 2020, 355, 295–303 CrossRef CAS.
- X. Liu, W. Dong, Y. Tong, L. Wei, M. Yuan, X. Wang, B. Wang and B. Zhu, Electrochim. Acta, 2019, 295, 325–332 CrossRef CAS.
- L. Wei, W. Dong, M. Yuan, C. Xia, Z. Xiao, M. Hu, B. Wang, X. Wang and B. Zhu, Int. J. Hydrogen Energy, 2020, 45, 10030–10038 CrossRef CAS.
- L. Mohan, A. V. Avani, K. Ponnusamy, M. Raj, P. Rajagopal, J. Joshua, N. Nallaperumal, M. Shkir and S. Subramanian, J. Alloys Compd., 2021, 882, 160670 CrossRef CAS.
- Q. Wang, X. Cheng, Y. Wang, Y. Yang, Q. Su, J. Li, B. An, Y. Luo, Z. Wu and E. Xie, Sens. Actuators, B, 2022, 355, 131262 CrossRef CAS.
- K. Juntaracena, T. Yuangkaew, M. Horprathum, N. Triroj and P. Jaroenapibal, Vib. Spectrosc., 2021, 115, 103276 CrossRef CAS.
- M. A. S. A., M. Anwar, N. Raduwan, A. Muchtar and M. Somalu, J. Sol-Gel Sci. Technol., 2018, 86, 493–504 CrossRef.
- P. Qiu, X. Yang, L. Zou, T. Zhu, Z. Yuan, L. Jia, J. Li and F. Chen, ACS Appl. Mater. Interfaces, 2020, 12, 29133–29142 CAS.
- J. Zhang, D. Leng, L. Zhang, G. Li, F. Ma, J. Gao, H. Lu and B. Zhu, J. Alloys Compd., 2021, 853, 157339 CrossRef CAS.
- J. Railsback, G. Hughes, L. Mogni, A. Montenegro-Hernandez and S. Barnett, J. Electrochem. Soc., 2016, 163, F1433–F1439 CrossRef CAS.
- J. Garcia-Barriocanal, A. Rivera-Calzada, M. Varela, Z. Sefrioui, E. Iborra, C. Leon, S. J. Pennycook and J. Santamaria, Science, 2008, 321, 676–680 CrossRef CAS PubMed.
- L. Yao, W. Liu, G. Ou, H. Nishijima and W. Pan, Electrochim. Acta, 2015, 158, 196–201 CrossRef CAS.
- J. Gao, S. Xu, M. Akbar, C. Xia, W. Dong, C. Liu, Y. Meng, M. Yuan, B. Wang and X. Wang, Int. J. Hydrogen Energy, 2021, 46, 9775–9781 CrossRef CAS.
- S. Dierickx, J. Joos, A. Weber and E. Ivers-Tiffee, Electrochim. Acta, 2018, 265, 736–750 CrossRef CAS.
- R. O'Hayre, S.-W. Cha, W. G. Colella and F. B. Prinz, Fuel cell fundamentals, John Wiley & Sons, Ltd, 2007 Search PubMed.
Footnote |
| † Electronic supplementary information (ESI) available. See DOI: https://doi.org/10.1039/d2ra05665h |
| This journal is © The Royal Society of Chemistry 2022 |

