
 Open Access Article
 This Open Access Article is licensed under a Creative Commons Attribution-Non Commercial 3.0 Unported Licence
Luminescence, energy transfer, colour modulation and up-conversion mechanisms of Yb3+, Tm3+ and Ho3+ co-doped Y6MoO12†
Peng Guoa,
Jiaxuan Wanga,
Chuan Liaoa,
Haifeng Zhoub,
Dapeng Huang*a,
Guangjun Zhou *a,
Xiaoqiang Yua and
Jifan Hua
*a,
Xiaoqiang Yua and
Jifan Hua
aState Key Laboratory of Crystal Materials, Shandong University, Jinan, 250100, P. R. China. E-mail: gjzhou@sdu.edu.cn; dapenghuang@sdu.edu.cn
bSchool of Materials Science and Engineering, Qilu University of Technology (Shandong Academy of Sciences), Jinan, 250353, P. R. China
First published on 22nd November 2022
Abstract
A series of novel up-conversion luminescent Yb3+/Ln3+ (Tm3+, Ho3+, Tm3+/Ho3+)-doped Y6MoO12 (YMO) nanocrystals were synthesized using the sol–gel method. The consistent spherical morphology of the nanocrystals with different doping ratios was found to be profiting from the homogenisation and rapid agglomeration of the composition in the gel state and calcining process. The X-ray diffraction (XRD) and field-emission scanning electron microscope images were employed to confirm perfect crystallinity and uniform morphology. Photoluminescence spectra and decay curves were used to characterize the optical properties of the synthesized samples. The YMO:Yb3+/Ln3+ (Tm3+, Ho3+, Tm3+/Ho3+) nanocrystals were excited by near-infrared photons and emitted photons distributed in blue, green, and red bands with a wide colour gamut, and even white colour, by optimising the relative doping concentrations of the activator ions. The energy conversion mechanism in the up-conversion process was studied using power-dependent luminescence and is depicted in the energy level diagram. In addition, 70% of the luminescence intensity of YMO can be preserved after annealing at 700 °C, and the temperature sensing was tested in the range 298–498 K. These merits of multicolour emissions in the visible region and good stability endow the as-prepared nanocrystals with potential applications in the fields of optical data storage, encryption, sensing, and other multifunctional photonic technologies.
Introduction
Photon up-conversion (UC) is an anti-Stokes process in which the absorption of multiple low-energy photons leads to the emission of a photon with a higher energy than the excitation photon.1–7 Rare-earth-doped up-conversion nanocrystals have garnered considerable attention because of their efficient energy transfer, good luminescence properties, and optical absorption ability,8–11 which have significant applications in the fields of solid-state laser,12,13 multicolour display,14,15 optical data storage,16,17 optical communication,18,19 and optical sensing.20,21 Ye and co-worker discovered a new non-contact optical material Ba3Y4O9 for temperature measurement, and they achieved high sensitivity over a wide measuring temperature range.22–24 Currently, complex application scenarios and multifunctional photonic technologies have put broad requirements for luminescent matrix materials with excellent chemical and thermal stability, accompanied by good up-conversion luminescence and colour tunability.25–27Molybdate has emerged as an efficient matrix for luminescence.28 The up-conversion luminescence (UCL) properties of various metal molybdates such as BaMoO4 (ref. 29), NiMoO4 (ref. 30), Gd2Mo3O9 (ref. 31), Gd2(MoO4)3 (ref. 32), and CaMoO4 (ref. 33) are well documented in the literature. Y6MoO12 (YMO) is an effective matrix of the molybdate family in luminescent materials.34–36 The YMO crystal has a defect fluorite structure with a space group of Fm![[3 with combining macron]](https://www.rsc.org/images/entities/char_0033_0304.gif) m, and the MoO6 and YO7 polyhedra have good chemical and thermal stability. Meanwhile, YMO has comparatively low phonon energies and high solubility of rare-earth (RE) ions owing to its large lattice tolerance. To date, Li et al.28 investigated the photoluminescence (PL) properties of Eu3+-doped YMO. Bieza et al.37 investigated the optical properties of YMO doped with Yb3+ and successfully developed an optical ceramic. Several studies have demonstrated the excellent luminescence ability of the YMO matrix with good environmental tolerance, but UCL has not been realized owing to the absence of effective rare earth collocations and effective preparation methods.
m, and the MoO6 and YO7 polyhedra have good chemical and thermal stability. Meanwhile, YMO has comparatively low phonon energies and high solubility of rare-earth (RE) ions owing to its large lattice tolerance. To date, Li et al.28 investigated the photoluminescence (PL) properties of Eu3+-doped YMO. Bieza et al.37 investigated the optical properties of YMO doped with Yb3+ and successfully developed an optical ceramic. Several studies have demonstrated the excellent luminescence ability of the YMO matrix with good environmental tolerance, but UCL has not been realized owing to the absence of effective rare earth collocations and effective preparation methods.
It should be noted that lanthanides have a unique 4f electron configuration and an abundance of discrete energy levels. Among the rare-earth ions, Tm3+ and Ho3+ are usually used as efficient UC activators because of their high electronic structural symmetry, broadband absorption peaks, and excellent photon UC properties.38,39 Moreover, two rare earth ions have been identified for outputting blue, green, and red visible photons under excitation by a 980 nm semiconductor laser, which can realize multiple colour adjustments and even white light to meet a wide range of optical storage, optical information encryption, anti-counterfeiting, and other intelligent photonics applications. However, the efficiency of photon up-conversion is low in the absence of sensitisers. Yb3+ ions can be used as sensitisers to enhance UC efficiency by considering their higher absorption cross-section near 980 nm and excellent energy transfer from Yb3+ to Tm3+ and Ho3+ ions.40,41
In this study, we report an efficient sol–gel method for the selective synthesis of high-purity disordered cubic fluorite-phase YMO with perfect crystallinity in doped YMO. Under optimal reaction conditions, the comparative multicolour UC photoluminescence properties and energy transfer mechanism of YMO:Yb3+/Ln3+ (Tm3+, Ho3+, Tm3+/Ho3+) nanocrystals were investigated for different element ratios. The luminescence intensity and chromaticity coordinates could be adjusted by changing the Ln3+ concentration and species. In addition, the heat resistance of YMO was investigated, and its luminescence intensity can be preserved at 70% of its initial value after annealing at 700 °C. Moreover, we studied the potential temperature-sensing ability of YMO:Yb3+:Tm3+:Ho3+ phosphors. The merits of multicolour UCL and good stability enable the as-prepared Y6MoO12 (YMO) nanocrystals to perform well for extensive applications in multifunctional photonic technologies.
Experimental
Materials and methodology
The starting materials, Y(NO3)3 (99.99%), Yb(NO3)3 (99.99%), Tm(NO3)3 (99.99%), Ho(NO3)3 (99.99%), (NH4)6Mo7O24 (99.98%), polyethylene glycol (PEG, 99%), and citric acid C6H8O7 (>99.5%), were purchased from Macklin, and used without further purification. YMO:Yb3+/Ln3+ (Tm3+, Ho3+, Tm3+/Ho3+) was synthesised using the sol–gel method and then calcined in a muffle furnace. Different concentrations of reagents were used according to experimental requirements, such as Y99.7−yMO:yYb3+/0.3Tm3+(y = 0–25), Y80−tMO:20Yb3+/tTm3+(t = 0.3–0.9), Y80−hMO:20Yb3+/hHo3+(h = 0.1–0.9) and Y79.7−cMO:20Yb3+/0.3Tm3+/cHo3+(c = 0.25–1). Firstly, Y(NO3)3, Yb(NO3)3, Tm(NO3)3, Ho(NO3)3 and Tm(NO3)3/Ho(NO3)3 were doped at a set concentration and stirred to ensure uniform mixing. Citric acid was added and mixed thoroughly to form solution A. Then (NH4)6Mo7O24 (0.1428 mmol) and the corresponding proportion of citric acid were dissolved in deionised water to form solution B. This solution B was slowly added into solution A under stirring to form solution C. Subsequently, a certain amount of PEG was added, and the PH of the solution was adjusted to 2–3. The solution C was then stirred at 80 °C until a homogeneous sol–gel was formed and gradually converted to a highly concentrated brownish-yellow material. The gel was obtained by drying at 80 °C, for 12 h. The precursor was calcined in a muffle furnace at 700 °C for 4 h and cooled naturally to room temperature. The obtained samples were ground to a final powder for characterisation.Result and discussion
The X-ray diffraction (XRD) patterns of Yb3+/Tm3+, Yb3+/Ho3+, and Yb3+/Tm3+/Ho3+-doped YMO are shown in Fig. 1(a). All the diffraction peaks observed for the samples matched well with those of YMO (JCPD card no 30-1456). The absence of other miscellaneous peaks in Fig. 1(a) indicates that the doping of all ions did not cause any changes in the lattice and that the doped ions were well integrated into the lattice. Also, the high intensity of the peaks indicates that all the as-prepared samples have a high-purity phase and perfect crystallinity. According to the relevant literature,37 the structure of Yb3+ is similar to that of Y3+. Therefore, with the increase in the doping amount of Yb3+, no new peak appeared in the XRD patterns of YMO, and the positions of the peaks remained the same. In addition, as shown in Fig. 1(a), doping with Tm3+ and Ho3+ ions similarly cause no lattice changes, probably because of the low doping concentration. The intrinsic and ion-doped YMO crystals have a disordered cubic fluorite structure with a space group of Fmm. The calculated lattice constant is a = 5.29 Å. The average size of the synthesised YMO samples calcined at 700 °C was reported to be 80.1 nm, calculated using the Debye–Scherrer formula (D = kλ/β![[thin space (1/6-em)]](https://www.rsc.org/images/entities/char_2009.gif) cosθ)42 and correlated well with the size determined from SEM analysis.
cosθ)42 and correlated well with the size determined from SEM analysis.
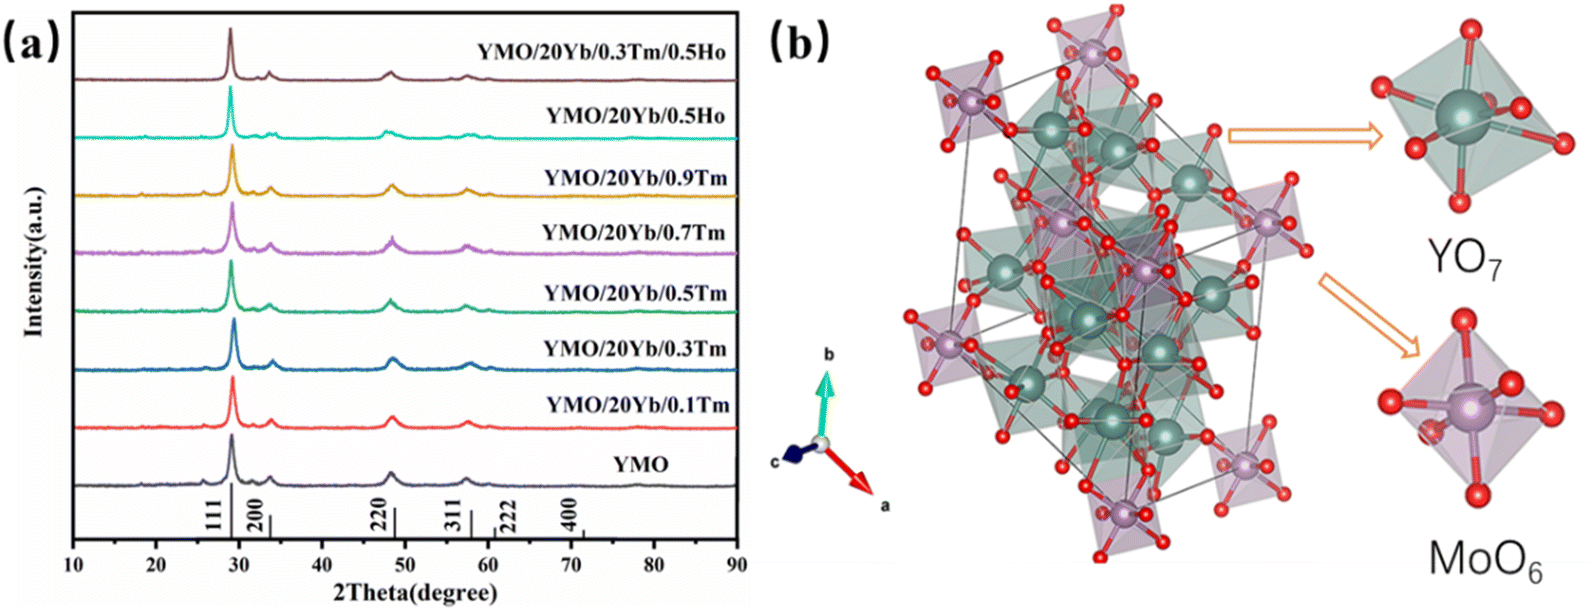 | ||
| Fig. 1 (a) XRD patterns of the YMO:Yb3+/Ln3+ (Tm3+, Ho3+, Tm3+/Ho3+) nanoparticles. (b) Visualisation of YMO cubic structure with MoO6 and YO7 polyhedra. Red atoms indicate the mixed rare earth molybdenum positions, green atoms indicate the mixed rare earth yttrium. | ||
As depicted in a previous report,37 the crystal structure of YMO was identical to that of Y6WO12, mainly because Mo6+ ions were completely replaced by W6+ ions. The prepared Re6MoO12 material was successfully obtained by calcination at 700 °C for 4 h. Mo6+ ions occupy 3a (0, 0, 0) octahedral sites, and Y3+ ions occupy 18f (x, y, z) sites.43 Mo6+ ions and the surrounding O2− ions form MoO6 octahedra, and other O2− ions and Y3+ ions form a YO7 polyhedron. As shown in Fig. 1(b), MoO6 and YO7 polyhedra are connected by sharing corners and edges. Because of the small difference between the ionic radii of the Yb3+ and Y3+ ions, the Yb3+ ions occupy the Y3+ site, and the lattice change caused by the doping of Yb3+ ions is negligible. Therefore, YMO doped with Yb3+ ions preserve the original crystal structure of YMO.
The size of the prepared nanocrystals was uniform, and the majority were 100 nm in size, which is smaller than the average size of reported YMO material.37 As shown in Fig. 2, doping does not change the morphology or particle size, which is consistent with the XRD results. The consistent spherical particles and similar particle size resulted from the homogenisation and rapid agglomeration of the composition in the gel-state and calcining process. Meanwhile, polymer surfactants adjusted the nanocrystal growth kinetics by interacting with the crystal surfaces. Owing to the rapid oxidation reaction of the material during calcination, the gases escaped rapidly and the composition agglomerated rapidly, so that many pores and voids were found in the calcined samples.
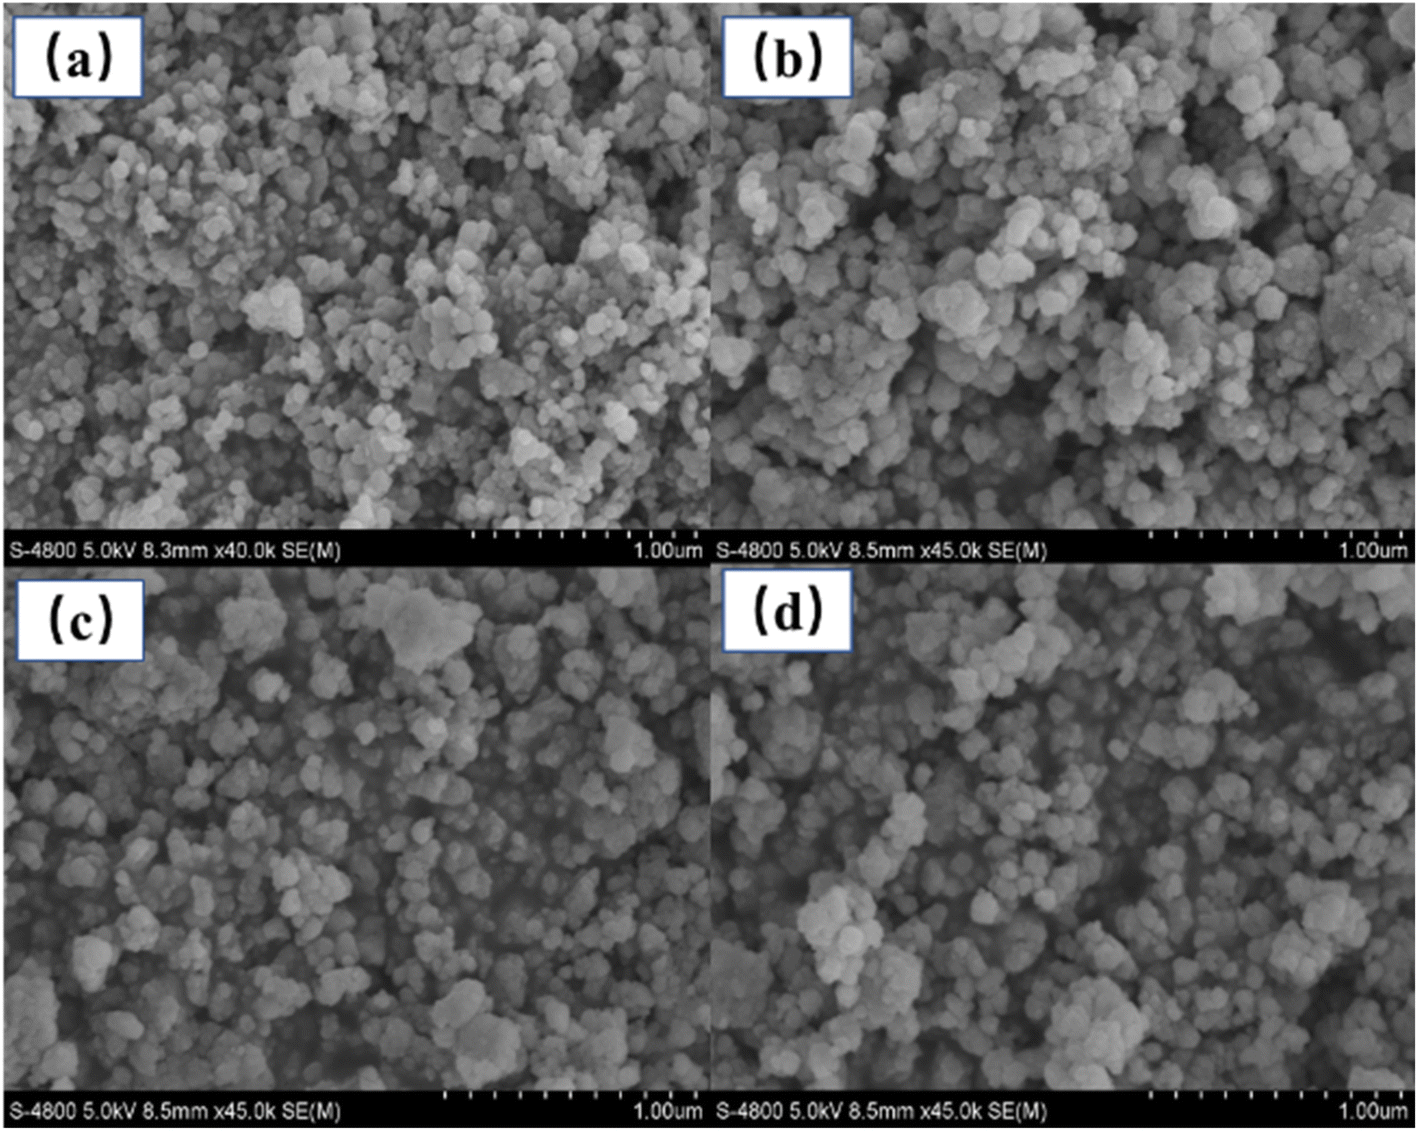 | ||
| Fig. 2 FE-SEM images of the samples. (a) YMO, (b) YMO:20Yb3+/0.3Tm3+, (c) YMO:20Yb3+/0.5Ho3+, (d) YMO:20Yb3+/0.3Tm3+/0.75Ho3+. | ||
Using a near-infrared laser (λex = 980 nm) exciting the Yb3+/Ln3+ (Ln = Tm3+, Ho3+, Tm3+/Ho3+)-doped YMO at room temperature, we obtained a series of multi-colour tunable UCL spectrum. As shown in Fig. 3(a), when the Tm3+ concentration is fixed at 0.3 mol%, with the change of Yb3+ doping amount, the luminescence phenomenon of the YMO made a significant change. In the blue and red ranges, there were two main emission peaks from the energy level transitions of 1G4 → 3H6 and 1G4 → 3F4 of Tm3+. The inset in Fig. 3(a) clearly shows the change in luminescence intensity of the UCL with increasing doping concentration of Yb3+, and at a doping concentration of 20 mol%, YMO has the best light intensity. When the Yb3+ doping concentration continued to increase, the fluorescence intensity showed a decreasing trend due to cross-relaxation losses. On this basis, YMO:20Yb3+/tTm3+ nanocrystals with varying Tm3+ concentrations were studied comprehensively. As shown in Fig. 3(b) and the inset, the spectrum of Tm3+ ion doping sample has a strong blue light at 475.5 nm and a weak red light at 648 nm, corresponding to the transitions of (1G4 → 3H6) and (1G4 → 3F4). The luminescence intensities of the peaks in the blue and red bands were enhanced as the concentration of Tm3+ increased to 0.3 mol%. Subsequently, the increase in the Tm3+ concentration induced luminescence quenching.
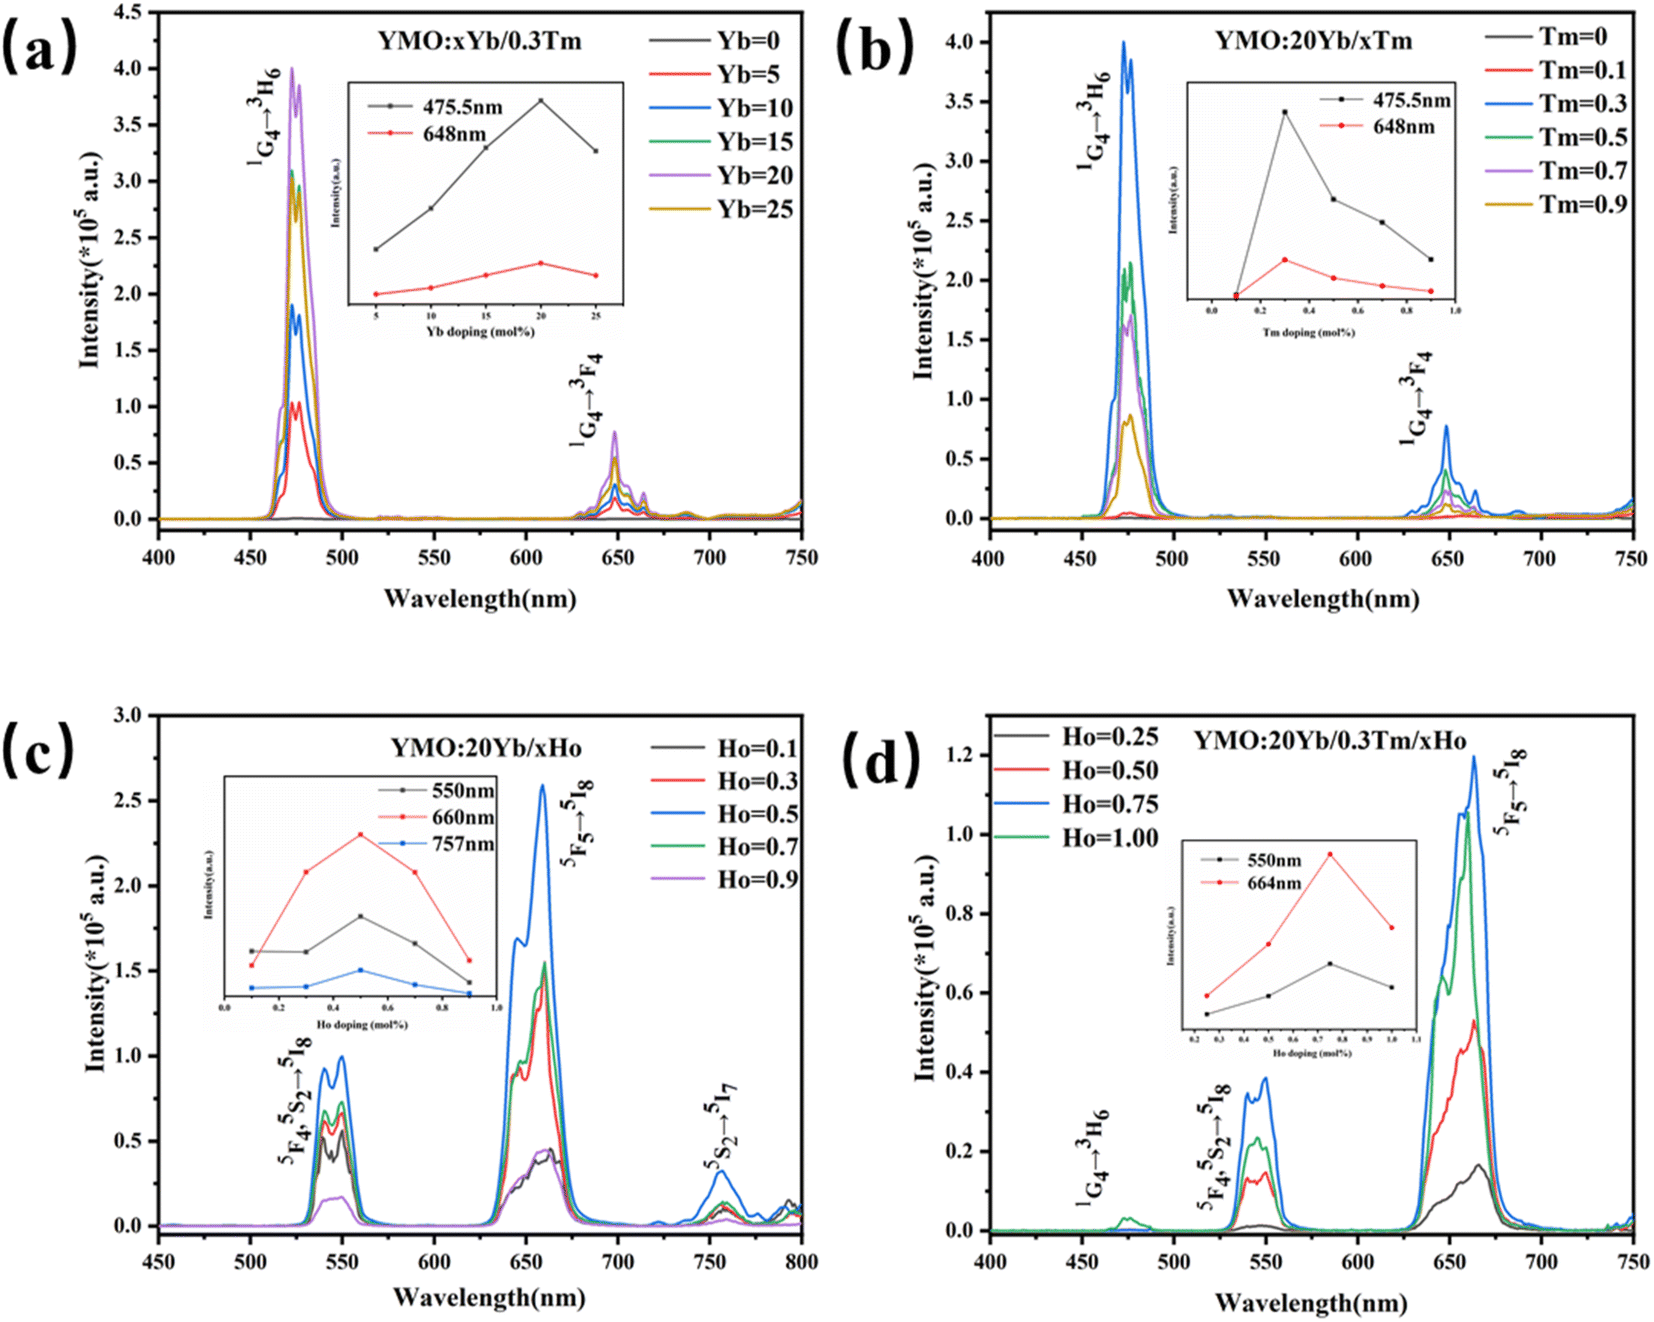 | ||
| Fig. 3 The up-conversion emission (a): (0–25) Yb3+/0.3Tm3+, (b): 20Yb3+/(0.1–0.9) Tm3+, (c): 20Yb3+/(0.1–0.9) Ho3+, (d): 20Yb3+/0.3Tm3+/(0.25–1) Ho3+ and the percentage change in luminescence intensity with different concentrations of rare earth ion doping are embedded in the graphs under 980 nm laser excitation. | ||
Further, as shown in Fig. 3(c), (0.1–0.9 mol%) Ho3+-doped YMO nanocrystals exhibit a weak green emission band (5F4, 5S2 → 5I8) centred at 540 and 550 nm, a strong red emission band (5F5 → 5I8) centred at 660 nm, and a weak red emission band (5S2 → 5I7) centred at 757 nm. As shown in the inset of Fig. 3(c), when the Ho3+ ion concentration is low, such as 0.1 mol%, green and red emissions are relatively weak. With an increase in the Ho3+ concentration, the intensity of this luminescence gradually increased. A strong green luminescence was observed at a concentration of 0.50 mol%, and the intensity of the three peaks show a trend of gradually increased. According to the study of different doping concentrations, it was found that the highest intensity of green and red luminescence was observed at the concentration of 0.50 mol% Ho3+, and the intensity of the three peaks was reduced due to the quenching of the concentration when the concentration of Ho3+ reached 1.00 mol%.
Fig. 3(d) shows the UCL spectra of Tm3+/(0.1–0.9 mol%) Ho3+ ions doped in YMO nanocrystals. Blue (477 nm: 1G4 → 3H6 of Tm3+ ions), green (547 nm and 550 nm: 3F4, 5S2 → 5I8 of Ho3+ ions), and red (664 nm: 5F5 → 5I8 of Ho3+ ions) emissions were observed. As shown in the inset of Fig. 3(d), the red and green luminescence intensities are the highest when the Ho3+ ion concentration reached 0.75 mol%. However, when the Ho3+ ion concentration reached 1 mol%, blue light centred at 477 nm appeared. The emission of red light was stronger than that of blue and green lights. As shown in Fig. 3(d), the emission peaks are mainly generated from the Ho3+ ion, accompanied by energy transfer (Yb3+ → Tm3+ → Ho3+).44 However, the 1G4 → 3H6 luminescence intensity of Tm3+ in Fig. 3(d) is substantially weaker, which may be due to the presence of cross-relaxation between Tm3+ and Ho3+. This causes a remarkable decrease in the luminescence of Tm3+ ions. However, when the doping concentration of the Ho3+ ion is 1 mol%, owing to the quenching of the concentration, the energy level transition (1G4 → 3H6) of the Tm3+ ion can be boosted by the emission of blue light (477 nm). Lanthanide elements exhibit different UCL characteristics owing to their different electron configurations and energy level structures. Therefore, it is a good choice to control the doping concentration of Ho3+ in the YMO host and control its colour.
It is well known that UCL is an anti-Stokes luminescence process, in which two or more low-energy photons are successively absorbed, and then one high-energy photon is emitted in rapid succession. The relationship between the up-conversion luminescence intensity (denoted as I) and excitation power (denoted as P) is I ∝ Pn, where I is the luminescence intensity, P is the infrared pump power, and n is a positive integer for the conversion of absorbed NIR photons to higher energies. Fig. 4(a–f) show the spectra of Yb3+/Ln3+ (Tm3+, Ho3+, Tm3+/Ho3+)-doped YMO at different powers.
 | ||
| Fig. 4 Up-conversion spectra of YMO:Yb3+/Ln3+ (Tm3+, Ho3+, Tm3+/Ho3+) under excitation of a 980 nm laser at the different power (a–c) and logarithmic plot of the luminescence intensities at different wavelength versus input power (d–f). | ||
As shown in Fig. 4(d), for the Yb3+/Tm3+-doped YMO up-conversion nanocrystals, the logarithmic plot of the luminescence intensities at 475.5 nm (1G4 → 3H6) and 648 nm (1G4 → 3F4) versus the input power present slope values of 1.576 and 1.445. This result indicates that the mechanism responsible for the observed emission is UC photoluminescence dominated by two-photon absorption, in which the blue luminescence process is more dominant than that of red luminescence. Similarly, as shown in Fig. 4(e), for Yb3+/Ho3+-doped YMO, the power-dependent luminescence at 550 nm (5S2 → 5I8) and 660 nm (5F5 → 5I8) present slopes of 1.885 and 1.459, respectively, indicating that the luminescence processes are two-photon absorption processes. The values of n for YMO:20Yb3+/0.3Tm3+/0.75Ho3+ with wavelengths of 550 nm (5S2 → 5I8) and 664 nm (5F5 → 5I8) are 1.903 and 1.738, respectively, which demonstrate the transition from Yb3+ to Tm3+ and Ho3+, involving two NIR photons. When a photon is absorbed by the host, the energy loss and non-radiative relaxation result in the emission energy being less than the absorbed energy, therefore, the slopes are all less than 2.
To demonstrate the kinetic process of the UCL, we studied the decay curves of YMO:20Yb3+,0.3Tm3+ (monitored at 475.5 nm and 648 nm for 1G4 → 3H6 and 1G4 → 3F4), YMO:20Yb3+,0.5Ho3+ (monitored at 550 nm and 660 nm for 5S2 → 5I8 and 5F5 → 5I8), and YMO:20Yb3+,0.3Tm3+,0.75Ho3+ (monitored at 550 nm and 664 nm for 1G4 → 3H6 and 1G4 → 3F4) under the excitation of a 980 nm laser. These samples can be fitted into a good double exponential formula as follows:
| I(τ) = I1exp(−t/τ1) + I2exp(−t/τ2), |
 | ||
| Fig. 5 Decay curves for samples under 980 nm excitation laser: (a) YMO/20Yb/0.3Tm, (b) YMO/20Yb/0.5Ho, (c) YMO/20Yb/0.3Tm/0.5Ho, (d) and (e) YMO/20Yb/0.3Tm/xHo (x = 0.25, 0.50, 0.75, 1.00%) at 550 nm, 664 nm, (f)–(h) YMO/20Yb/xTm/0.75Ho (x = 0.3, 0.6, 0.9, 1.2%) at 550 nm, 664 nm, and 796 nm, (i) the calculated decay times of corresponding emission energy levels. | ||
To compare the luminescence thermal stability of fluorides and oxides, NaYF4 was prepared by referring our previous work,25 and then YMO and NaYF4 were annealed at 700 °C, respectively. The resulting luminescence spectra are shown in Fig. 6. It can be seen from the emission spectrum that the luminescence intensity of YMO sample and NaYF4 sample decreased to 70% and 6.4% of the original after annealing at 700 °C, respectively. The luminescence decay of NaYF4 sample was more obvious due to the phase transition (β → α) at annealing process, which were verified by the XRD and TEM (Fig. S1 and S2†). The results clearly show that the luminescence thermal stability of YMO is much better than that of NaYF4 as heated up to 700 °C.
 | ||
| Fig. 6 Luminescence spectra before and after annealing: (a) YMO:Yb3+,Tm3+, (b) NaYF4:Yb3+,Tm3+. | ||
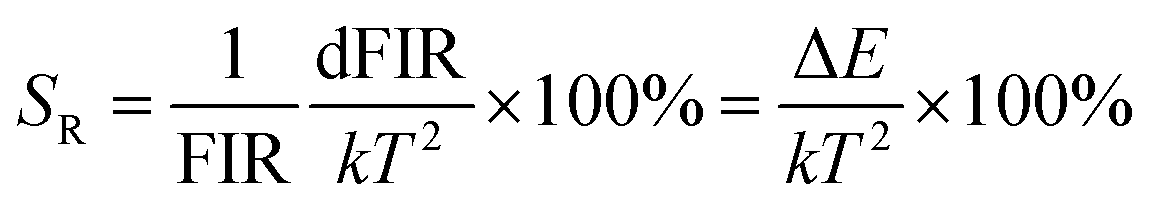
To enable a better understanding of the UC luminescence mechanism of YMO:Yb3+/Tm3+/Ho3+ materials at different temperatures, the samples are collected at temperatures from 298 K to 498 K, as shown in Fig. 7(a). It describes the normalised temperature-dependent 550 nm emission spectra of the sample to deeply comprehend the responses of the green emissions to temperature. It is clearly observed that the emission intensities of triple-doped YMO are gradually quenched with increasing temperature. The FIR values between the 5S2 → 5I8 and 5F5 → 5I8 transitions at various temperatures are calculated according to the recorded UC emission spectra, as shown in Fig. 7(b). With a reasonable approximation, the relation between FIR and absolute temperature can be expressed by the following expression:22,23

where B is a constant and ΔE refers to the energy gap. The data points can be fitted with a straight line, which confirms the suitability of the phosphor for temperature-sensing applications. The slope and intercept of the fitted line were approximately −756.3 and 1.469, respectively. To demonstrate the suitability of the studied samples for temperature detection, the sensor sensitivity at different temperatures (i.e., absolute sensor sensitivity (SA) and relative sensor sensitivity (SR)) should be discussed. According to this report, the values of SA and SR as a function of temperature can be obtained from the following expression:22,23


 | ||
| Fig. 7 (a) Normalized 550 nm emission spectra of the YMO:20Yb3+:0.3Tm3+:1Ho3+ microparticles in the temperature range 298–498 K. (b) FIR value as function of temperature and (c) plot of ln(FIR) versus T−1 for the YMO:20Yb3+:0.3Tm3+:1Ho3+ microparticles. (d) SR and SA values of the YMO:20Yb3+:0.3Tm3+:1Ho3+ microparticles as a function of temperature. | ||
Fig. 7(d) depicts the correlation between SA and SR values, as derived from equations FIR and ln(FIR) equations. The absolute sensitivity SA gradually increased with increasing temperature, with a maximum value of 0.0032 K−1. The maximum SR value is 0.85% K−1. The optical temperature sensing performance of this work and other RE doped materials are shown in Table S1.† The absolute sensitivity (SA) of YMO-based material shows a certain advantage among some oxides.48–51 In addition, the temperature range of YMO is wider than that of molybdate Gd2Mo3O952 and the relative sensitivity (SR) of YMO is higher than Y2WO6.49
The CIE coordinates of the YMO:Yb3+/Ln3+ (tTm3+, hHo3+, Tm3+/cHo3+) samples under 980 nm laser excitation are shown in Fig. 8 and Table 1. As the doping type of Ln3+ changed, there were distinct differences in the CIE coordinates. Because the energy level jump of the same doping type in the luminescence process is fixed, the change in the doping concentration of the sensitiser has little effect on the luminescence colour, and the CIE coordinates show aggregation by the same doping type with different concentrations. For Tm3+ ion doping, the luminescence peak is mainly concentrated in the blue region because the energy level transition from 1G4 → 3H6 is greater than that from 1G4 → 3F4, leading to the sample being mainly blue. In addition, the material achieves white up-conversion luminescence at a Tm3+ ion doping concentration of 0.1 mol%. Upon doping with Ho3+ alone, the luminescence colour is mainly yellow in CIE. For the double doping of Tm3+ and Ho3+ ions, it can be found that the luminescence region is mainly in the red-light region because of the leading emission peaks at 655 nm:1G4 → 3F4 of Tm3+ ions and 664 nm:5F5 → 5I8 of Ho3+ ions. Thus, by adjusting the concentrations of Tm3+ and Ho3+ ions, multi-colour tunable UCL over a wide gamut in the YMO matrix can be achieved.
 | ||
| Fig. 8 CIE chromaticity diagram for YMO:20Yb,tTm (T1–T5), YMO:20Yb,hHo (H1–H5), and YMO:20Yb,0.3Tm,cHo (C1–C4). | ||
| No. of points | YMO:20Yb:tTm | CIE (x, y) |
|---|---|---|
| T1 | t = 0.1 | (0.2609, 0.2435) |
| T2 | t = 0.3 | (0.1451, 0.1183) |
| T3 | t = 0.5 | (0.1431, 0.1159) |
| T4 | t = 0.7 | (0.1412, 0.1176) |
| T5 | t = 0.9 | (0.1480, 0.1334) |
| No. of points | YMO:20Yb:hHo | CIE (x, y) |
|---|---|---|
| H1 | h = 0.1 | (0.3711, 0.6191) |
| H2 | h = 0.3 | (0.4453, 0.5464) |
| H3 | h = 0.5 | (0.4639, 0.5260) |
| H4 | h = 0.7 | (0.4773, 05448) |
| H5 | h = 0.9 | (0.4772, 0.5153) |
| No. of points | YMO:20Yb:0.3Tm:cHo | CIE (x, y) |
|---|---|---|
| C1 | c = 0.25 | (0.6107, 0.3641) |
| C2 | c = 0.5 | (0.5119, 0.4773) |
| C3 | c = 0.75 | (0.4961, 0.4968) |
| C4 | c = 1 | (0.5124, 0.4514) |
The main mechanisms of the UCL include ground state/excited state absorption (GSA/ESA), energy transfer (ET) up-conversion, and photon avalanche (PA). To clarify the filling mechanism of the UCL, the energy level diagrams of YMO:Yb3+,Tm3+, YMO:Yb3+,Ho3+ are shown in Fig. 9. Because the slope does not change in Fig. 4, in principle, it does not involve the PA mechanism. Thus, the UCL process can be described as follows: first, the sensitiser Yb3+ ions absorb the near-infrared light at a wavelength of 980 nm, which leads to photon pumping from the ground state (2F7/2) to the excited state (2F5/2). Then the energy is transferred to Tm3+ (ET1: 3H5, ET2: 3F2,3, ET3: 1G4) and Ho3+ (ET4: 5I6, ET5: 5F4, 5S2), leading to the electron jumping from the ground state to the corresponding excited state, simultaneously with Yb3+ absorbing the energy again and transferring. The energy is then further transferred to the activator, and as the activator absorbs further energy, their electron energy levels further leap to higher energy levels. As the electrons continue to reach the corresponding highest excited state energy levels, the electrons continue to leap back to the ground state by radiation, eventually leading to UCL. For the Tm3+ ions, the energy absorbed by the Yb3+ ion was transferred to the ground state energy level of Tm3+, leading to an energy level leap of 3H6 → 3H5 (ET1), followed by a radiation-free relaxation of the 3H5 energy level to energy level 3F4. Subsequently, the Yb3+ ions transfer the energy absorbed again to energy level 3F4 (ET2), causing it to leap to energy level 3F2,3. The electrons at this energy level further relax to energy level 3H4, which then leaps to 1G4 by absorbing the energy absorbed by the Yb3+ ions (ET3) energy level and then radiating 1G4 → 3H6 (475.5 nm) and 1G4 → 3F4 (648 nm), respectively. For YMO:Yb3+,Ho3+, the energy of the Yb3+ ions is transferred to the Ho3+ ions, which excites its electrons from the ground state 5I8 to excited state 5I6 (ET4), while the Yb3+ ions again transfer the absorbed energy to Ho3+ ions (ET5), which causes its energy level to jump 5I6 → 5F4, 5S2, and then some electrons in the excited state energy level leap back to the ground state, such as 5F4, 5S2 → 5I8 (550 nm), and 5S2 → 5I7 (757 nm), and the remaining electrons relax to energy level 5F5 and then further relax to the new 5I8 emitting an intense red light (660 nm).
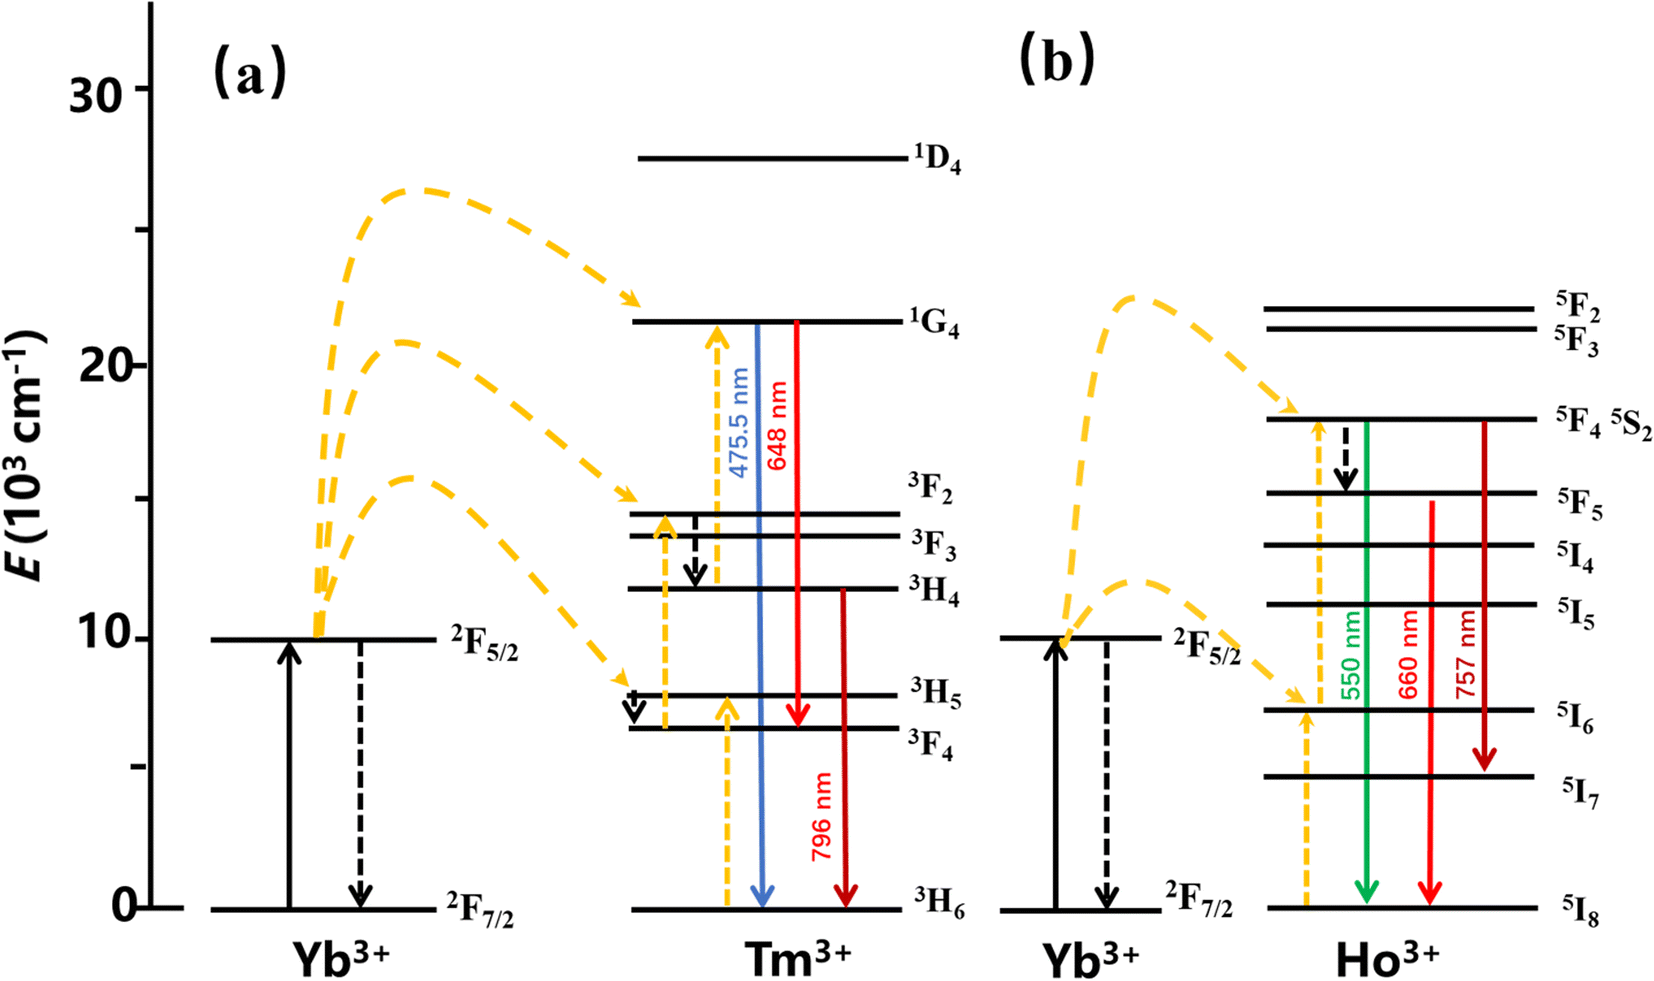 | ||
| Fig. 9 The energy level diagram for the Tm3+ ion is (a) and the energy level diagram for the Ho3+ ion is (b). | ||
The energy transfer process of Yb3+ → Tm3+ → Ho3+ can be decomposed into the ET process of Yb3+ → Tm3+ and the CR process of Tm3+ → Ho3+. After Yb3+ transfers energy to the Tm3+ energy level, a portion of the energy level relaxes, leading to 1G4 → 3H6 and 5S2 → 5I7, and excess energy is transferred to the Ho3+ ion energy level via the CR process, leading to 5S2 → 5I8 and 5F5 → 5I8. Combining the change in 1G4 → 3H6 luminescence intensity in the conversion of YMO:20Yb,tTm, and YMO:20Yb,0.3Tm,cHo in Fig. 3 and the related arguments in the lifetime of Fig. 5, it can be concluded that energy transfer process takes in Yb3+ → Tm3+ → Ho3+.
Conclusions
YMO materials were successfully prepared using a simple sol–gel method and subsequent combustion, and UCL results were obtained. Furthermore, the excellent heat resistance of YMO as an UC luminescent host was demonstrated. The results of XRD and SEM showed that the samples are disordered cubic fluorite structure with homogeneous spherical grains. The samples were irradiated with a 980 nm laser to obtain luminescence of different colours. The power-dependent UCL spectra indicated that YMO:Yb3+/Ln3+ (Tm3+, Ho3+, Tm3+/Ho3+) was the dominant two-photon absorption process. In addition, the corresponding mechanisms, including the energy level transfer and phonon relaxation processes, were discussed in detail. Also, YMO:Yb3+/Ln3+ (Tm3+, Ho3+, and Tm3+/Ho3+) has been verified with potential applications in optical temperature sensing.Conflicts of interest
There are no conflicts to declare.Acknowledgements
This work was supported by Shandong Province Science and Technology Program (2022TSGC1016); Foundation of Shandong Industrial Technology Research Institute (Z1250020007, Z1250020008); the National Natural Science Foundation of China (52102007, 51472150) and China Postdoctoral Science Foundation (2020M682175).References
- H. Huang, H. Zhou, J. Zhou, T. Wang, D. Huang, Y. Wu, L. Sun, G. Zhou, J. Zhan and J. Hu, RSC Adv., 2017, 7, 16777–16786 RSC.
- M. Haase and H. Schafer, Angew. Chem., Int. Ed. Engl., 2011, 50, 5808–5829 CrossRef CAS.
- X. Xie, Z. Li, Y. Zhang, S. Guo, A. I. Pendharkar, M. Lu, L. Huang, W. Huang and G. Han, Small, 2017, 13, 1602843 CrossRef.
- Y. Kaoru, M. Fujii, S. Sowa, K. Imakita and K. Aoki, J. Phys. Chem. C, 2015, 119, 1175–1179 CrossRef.
- S. Xu, X. Xie, B. Zhao, L. Nie, Y. Pan, H. Su, L. Huang and W. Huang, J. Rare Earth, 2017, 35, 28–33 CrossRef CAS.
- S. Liu, Z. An and B. Zhou, Chem. Eng. J., 2023, 452, 139649 CrossRef CAS.
- H. Huang, T. Wang, H. Zhou, D. Huang, Y. Wu, G. Zhou, J. Hu and J. Zhan, J. Alloys Compd., 2017, 702, 209–215 CrossRef CAS.
- Y. Yao, S. Zhang, H. Zhang, J. Ding, T. Jia, J. Qiu and Z. Sun, Sci. Rep., 2014, 4, 7295 CrossRef CAS.
- B. Zhang, J. Meng, X. Mi, C. Zhang, Z. Zhang and H. Zheng, RSC Adv., 2018, 8, 37618–37622 RSC.
- L. T. K. Giang, K. Trejgis, L. Marciniak, N. Vu and L. Q. Minh, Sci. Rep., 2020, 10, 14672 CrossRef CAS.
- R. K. Sharma, M. Ghora, Y. N. Chouryal, T. Ganguly, D. Acharjee, D. J. Mondal, S. Konar, S. Nigam and P. Ghosh, ACS Omega, 2022, 7, 16906–16916 CrossRef CAS PubMed.
- K. V. Krishnaiah, E. S. de Lima Filho, Y. Ledemi, G. Nemova, Y. Messaddeq and R. Kashyap, Sci. Rep., 2016, 6, 21905 CrossRef CAS PubMed.
- Y. L. Wang, N. Mohammadi Estakhri, A. Johnson, H. Y. Li, L. X. Xu, Z. Zhang, A. Alu, Q. Q. Wang and C. K. Shih, Sci. Rep., 2015, 5, 10196 CrossRef CAS.
- M. Kermorgant, J. Ben Salem, J. Santelli, D. Calise, A. C. Oster, O. Lairez, C. Coudret, M. Verelst, C. Gales, J. M. Senard, F. Beaudry, A. Pavy-Le Traon, C. Roux, R. Mauricot and D. N. Arvanitis, PLoS One, 2019, 14, 0225729 CrossRef.
- G. Chen, T. Y. Ohulchanskyy, R. Kumar, H. Agren and P. N. Prasad, ACS Nano, 2010, 4, 3163–3168 CrossRef CAS.
- Y. Han, H. Li, Y. Wang, Y. Pan, L. Huang, F. Song and W. Huang, Sci. Rep., 2017, 7, 1320 CrossRef PubMed.
- S. Lamon, Y. Wu, Q. Zhang, X. Liu and M. Gu, Sci. Adv., 2021, 7, 2209 CrossRef.
- F. Huang, X. Liu, Y. Ma, S. Kang, L. Hu and D. Chen, Sci. Rep., 2015, 5, 8233 CrossRef CAS.
- X. Chen, X. Zhu, Y. Hu, W. Yuan, X. Qiu, T. Jiang, C. Xia, L. Xiong, F. Li and Y. Gao, Theranostics, 2020, 10, 3281–3292 CrossRef CAS.
- K. Green, K. Huang, H. Pan, G. Han and S. F. Lim, Front. Chem., 2018, 6, 416 CrossRef CAS.
- Y. Bai, Y. Li, R. Wang and Y. Li, ChemistrySelect, 2021, 6, 10263–10273 CrossRef CAS.
- S. Liu, J. Cui, J. Jia, J. Fu, W. You, Q. Zeng, Y. Yang and X. Ye, J. Phys. Chem. C, 2018, 122, 16289–16303 CrossRef CAS.
- S. Liu, H. Ming, J. Cui, S. Liu, X. Ye, Y. Yang, H. Nie and R. Wang, Ceram. Int., 2019, 45, 1–10 CrossRef CAS.
- S. Liu, L. Yan, J. Huang, Q. Zhang and B. Zhou, Chem. Soc. Rev., 2022, 51, 1729 RSC.
- T. Wang, H. Feng, Z. Chao, G. Jun, J. Juan, D. Peng, L. Sun, P. Guo, Y. Sun and J. Hu, J. Phys. Chem. C, 2018, 122, 10113–10124 CrossRef CAS.
- B. Wu, L. Zhao, Y. Wang, H. Dong and H. Yu, RSC Adv., 2019, 9, 42228–42235 RSC.
- Y. Shang, S. Hao, C. Yang and G. Chen, Nanomaterials, 2015, 5, 1782–1809 CrossRef CAS.
- H. Li, X. Pu, S. Yao, X. Wang, H. M. Noh and J. H. Jeong, J. Nanosci. Nanotechnol., 2016, 16, 3636–3640 CrossRef CAS PubMed.
- S. K. Ray, Y. K. Kshetri, T. Yamaguchi, T.-H. Kim and S. W. Lee, J. Solid State Chem., 2019, 272, 87–95 CrossRef CAS.
- S. K. Ray, B. Joshi, S. Ramani, S. Park and J. Hur, J. Alloys Compd., 2022, 892, 162101 CrossRef CAS.
- J. Sun, B. Xue, G. Sun and D. Cui, J. Rare Earth, 2013, 31, 741–744 CrossRef CAS.
- A. Kumari, A. K. Soni and V. K. Rai, Infrared Phys. Technol., 2017, 81, 313–319 CrossRef CAS.
- J. H. Chung, J. H. Ryu, S. Y. Lee, S. H. Kang and K. B. Shim, Ceram. Int., 2013, 39, 1951–1956 CrossRef CAS.
- G. George, V. S. Vishnu and M. L. P. Reddy, Dyes Pigm., 2011, 88, 109–115 CrossRef CAS.
- X. Zhao, Y. Zhang, Y. Huang, H. Gong and J. Zhao, Dyes Pigm., 2015, 116, 119–123 CrossRef CAS.
- M. Sobota, P. Sobota, M. Bieza, M. Guzik, E. Tomaszewicz, Y. Guyot and G. Boulon, Opt. Mater., 2019, 90, 300–314 CrossRef CAS.
- M. Bieza, M. Guzik, E. Tomaszewicz, Y. Guyot and G. Boulon, Opt. Mater., 2017, 63, 3–12 CrossRef CAS.
- Z. Ding, Y. He, H. Rao, L. Zhang, W. Nguyen, J. Wang, Y. Wu, C. Han, C. Xing, C. Yan, W. Chen and Y. Liu, Nanomaterials, 2022, 12, 1787 CrossRef CAS PubMed.
- M. Secu, C. Secu and C. Bartha, Materials, 2021, 14, 6871 CrossRef CAS.
- X. Zhao, Z. Wu, Z. Yang, X. Yang, Y. Zhang, M. Yuan, K. Han, C. Song, Z. Jiang, H. Wang, S. Li and X. Xu, Nanomaterials, 2020, 10, 1475 CrossRef CAS.
- S. Shukla, P. C. Pandey and R. J. Narayan, Polymers, 2021, 13, 2694 CrossRef CAS PubMed.
- S. B. Somvanshi, P. B. Kharat, T. Saraf, S. B. Somwanshi, S. B. Shejul and K. M. Jadhav, Mater. Res. Innovations, 2021, 25, 169–174 CrossRef.
- N. Diot, P. Benard-Rocherulle and R. Marchand, Powder Diffr., 2000, 15, 220 CrossRef CAS.
- H. Zhang, D. Sun, J. Luo, F. Peng, Z. Fang, X. Zhao, C. Quan, M. Cheng, Q. Zhang and S. Yin, J. Lumin., 2018, 194, 636–640 CrossRef CAS.
- X. Ye, Y. Luo, S. L. D. Hou and W. You, J. Alloys Compd., 2017, 701, 806–815 CrossRef CAS.
- S. Liu, X. Ye, S. Liu, M. Chen, H. Niu, D. Hou and W. You, J. Am. Ceram. Soc., 2017, 100, 3530–3539 CrossRef CAS.
- S. Liu, S. Liu, H. Ming, F. Du, J. Peng, W. You and X. Ye, J. Mater. Sci., 2018, 53, 14469–14484 CrossRef CAS.
- H. Liu, X. Zheng, P. Wang, H. Wang and Y. Zhang, J. Opt. Soc. Am. B, 2022, 39, 2625 CrossRef CAS.
- J. Zhang, B. Ji, G. Cheng and Z. Hua, Inorg. Chem., 2018, 57, 5038–5047 CrossRef CAS PubMed.
- E. Maurice, G. Monnom, B. Dussardier, A. Saissy, D. B. Ostrowsky and G. W. Baxter, Appl. Opt., 1995, 34, 34 Search PubMed.
- P. V. dos Santos, M. T. de Araujo and A. S. Gouveia-Neto, Appl. Phys. Lett., 1998, 28, 578 CrossRef.
- S. Sinha, M. K. Mahata and K. Kumar, RSC Adv., 2016, 6, 89642–89654 RSC.
Footnote |
| † Electronic supplementary information (ESI) available. See DOI: https://doi.org/10.1039/d2ra05642a |
| This journal is © The Royal Society of Chemistry 2022 |