
 Open Access Article
 This Open Access Article is licensed under a Creative Commons Attribution-Non Commercial 3.0 Unported Licence
Dual-emissive ratiometric fluorescent nanosensor based on multi-nanomaterials for Ag+ determination in lake water
Ling Zhua,
Lujia Shib,
Yiping Tanb,
Huaiyin Zhangb,
Jiacheng Yinb,
Chang Xua,
Danlian Wua and
Yunsu Ma *b
*b
aDepartment of Pharmacy, The Affiliated Jiangyin Clinical College of Xuzhou Medical University, Wuxi, PR China
bSchool of Pharmacy, Xuzhou Medical University, Xuzhou, PR China. E-mail: yunsu@xzhmu.edu.cn
First published on 21st October 2022
Abstract
In this study, a sensitive ratiometric fluorescent nanosensor was constructed using a facile one-pot method by encapsulating carbon dots (CDs) and cadmium telluride quantum dots (CdTe QDs) into the pore cavities of a metal–organic framework (ZIF-8). In this nanosensor (CD/CdTe QD@ZIF-8), the fluorescence attributed to CdTe QDs was quenched by silver ions (Ag+), and the fluorescence intensity of CDs did not change. The introduction of ZIF-8 into the system can not only adsorb Ag+ but also easily separate CDs and CdTe QDs from the matrix. The developed CD/CdTe QD@ZIF-8 composite used as a ratiometric fluorescent probe exhibited high sensitivity and selectivity towards Ag+. The working linear range was 0.1–20 μM with a limit of detection (LOD) of 1.49 nM. Finally, the proposed nanosensor was applied to determine Ag+ in lake water with satisfactory results.
1. Introduction
With the development of science and technology, Ag+ has been extensively applied in various fields such as biomedicine, electricity, photography and disinfection.1 A large amount of Ag+ is released into the environment owing to industrial discharge. Over the years, long-term exposure to Ag+ in water and soil has led to the biological accumulation of Ag+ through food and water cycles. Some studies have shown that Ag+ higher than 0.9 μmol L−1 in drinking water is detrimental to the health of humans,2 which results in serious concerns including multiple organ dysfunction,3,4 presenile dementia,5 osteoporosis,6 and argyria.7–9With attention to these concerns, the quantitative determination of the trace amount of Ag+ in environmental and industrial samples has significant implications. To date, various analytical methods have been applied to detect Ag+, such as atomic absorption spectroscopy,10 inductively coupled plasma optical emission,11,12 electrochemical analysis,13,14 and fluorescence analysis.15–17 However, these methods either lack selectivity and sensitivity or are laboratory-based and tedious in sample preparation. Among them, spectrofluorimetry has drawn great attention owing to its simple and convenient operations. Recently, several fluorescent nanosensors based on organic fluorescent dyes,18–20 semiconductor quantum dots,21–25 and CDs26–29 have been constructed for the determination of Ag+. However, traditional spectrofluorimetry based on a single fluorescence intensity is influenced by various factors, such as probe concentration, light source and measurement conditions. Alternatively, some ratiometric fluorescent probes30,31 have been reported. Compared with traditional spectrofluorimetry based on single fluorophore, ratiometric fluorimetry has higher selectivity and sensitivity and a wider quantitative range.
As the functional groups on the surface of QDs are rich in metal ions, heavy metal ions in the environment are exchanged with functional groups of QDs by electron transfer, resulting in the collapse of QDs and fluorescence quenching.1,6 While the functional groups on the surface of CDs were –NH2 or –COOH, electron transfer is potentially less likely to happen between CDs and heavy metal ions.26 Therefore, most QDs were more sensitive to heavy metal ions than CDs. These provide a chance to develop a ratiometric fluorescent probe to detect Ag+.
ZIF-8, as a member of metal–organic frameworks (MOFs), is a novel porous material synthesized by self-assembling zinc ions with 2-methylimidazole under certain conditions. Owing to its unique structural characteristics that are rich in porosity and active metal sites, ZIF-8 shows promising potential in many fields such as separation, adsorption and catalysis.32–34 As the introduction of ZIF-8 into the system can make CDs and CdTe QDs enclosed in its holes,35 the compounds (CD/CdTe QD@ZIF-8) possess several advantages. First, nanosize CDs and CdTe QDs are water-soluble and are difficult to extract from the matrix, CD/CdTe QD@ZIF-8 can easily be separated by centrifugation. Second, ZIF-8 can adsorb and enrich Ag+ from surroundings so that it plays an important role in improving sensitivity immensely.
Therefore, to develop a sensitive, selective and convenient fluorescent nanosensor, multi-nanoparticles, including CDs, CdTe QDs and ZIF-8, were chosen to construct a ratiometric fluorescence probe (CD/CdTe QD@ZIF-8) in this paper. The introduction of Ag+ causes the fluorescence quenching of CD/CdTe QD@ZIF-8 at 650 nm, but no change at 430 nm. The concentration-dependent percent quenching was calculated. Finally, the nanosensor was applied to sense Ag+ in lake water.
2. Experimental
2.1 Materials
Citric acid monohydrate, diethylenetriamine, tellurium powder, sodium borohydride, 3-mercaptopropionic acid, 2-methylimidazole, zinc nitrate hexahydrate and ethylene diaminetetraacetic acid were purchased from Aladdin Biochemical Technology Co., Ltd (Shanghai, China). Cadmium chloride was purchased from Zhanyun Chemical Co., Ltd (Shanghai, China). Acetone, anhydrous ethanol and sodium hydroxide were purchased from Sinopharm Chemical Reagent Co., Ltd (Shanghai, China). Phosphate-buffered saline (PBS, 10 mM, pH 7.4). All reagents were of analytical grade and used without any further purification. The purified water used in all experiments was prepared using a water purification system obtained from Termo Scientific Technology Co., Ltd (Shanghai, China).2.2 Methods
![[thin space (1/6-em)]](https://www.rsc.org/images/entities/char_2009.gif) 000 rpm for 10 min. After being washed with deionized water several times, CD/CdTe QD@ZIF-8 were obtained. Then, it was dispersed in 20 mL of PBS for further use.
000 rpm for 10 min. After being washed with deionized water several times, CD/CdTe QD@ZIF-8 were obtained. Then, it was dispersed in 20 mL of PBS for further use.2.3 Determination of Ag+
A 400 μL of various concentrations of Ag+ were added into a 100 μL of CD/CdTe QD@ZIF-8. The final concentrations of Ag+ were 0, 0.1, 0.2, 0.5, 1, 2, 5, 10, and 20 μM. The mixed solution reacted for 30 seconds under the vortex. The fluorescence spectra of the mixture were measured at an excitation wavelength of 365 nm to determine Ag+.3. Results and discussion
The morphological characteristics of CDs and CdTe QDs are demonstrated in Fig. 1A and B, respectively. As shown in Fig. 1A, CDs were irregular rotundity with a narrow size distribution of about 3–5 nm. The lattice fringes were also observed; the inset showed that the solution of CDs was achromatous under daylight, showing blue fluorescence under UV-lamp. As shown in Fig. 1B, CdTe QDs were circular with a diameter of about 2–3 nm and were evenly dispersed in solution. The solution of CdTe QDs under daylight was clear red, whereas it showed red fluorescence under UV-lamp (insert of Fig. 1B).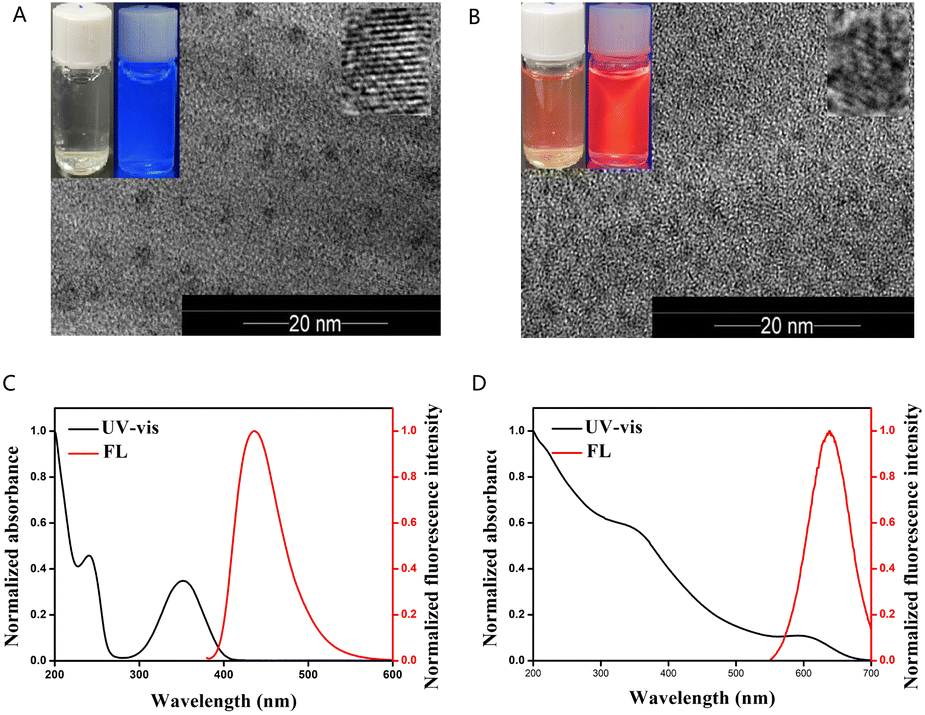 | ||
| Fig. 1 (A) The HRTEM images of CDs. Inset: the solution of CDs under day light and UV-lamp. (B) The HRTEM images of CdTe QDs. Inset: the solution of b-CDs under day light and UV-lamp. The UV-vis absorption spectra and fluorescence spectra of CDs (C) and CdTe QDs (D). | ||
As shown in Fig. 1C, the absorption peaks at 240 nm and 360 nm were attributed to the n–π* and π–π* transitions of C![[double bond, length as m-dash]](https://www.rsc.org/images/entities/char_e001.gif) C/CO, respectively. The CDs had a maximum fluorescence intensity of 430 nm based on the excitation wavelength of 365 nm.
C/CO, respectively. The CDs had a maximum fluorescence intensity of 430 nm based on the excitation wavelength of 365 nm.
The UV-vis absorption spectra and fluorescence spectra of CdTe QDs are also demonstrated in Fig. 1D. CdTe QDs had wide UV-vis absorption and an emission peak at 640 nm. The photometric characteristics of the prepared CDs and CdTe QDs were consistent with those reported in papers.23
The UV-vis absorption spectrum of CDs, CdTe QDs, ZIF-8 and CD/CdTe QD@ZIF-8 are depicted in Fig. 2A. The UV-vis absorption spectrum of CD/CdTe QD@ZIF-8 had a stronger and wider absorption than ZIF-8, which may be caused by the overlay of CDs and CdTe QDs. Furthermore, the characteristic absorption peaks of CDs at 240 nm and 360 nm disappeared in the UV-vis absorption spectrum of CD/CdTe QD@ZIF-8, which indicated that the CDs were covered by ZIF-8 not attached to the surface of ZIF-8. As shown in Fig. 2B, there were no obvious differences between the infrared spectrum diagrams of ZIF-8 and CD/CdTe QD@ZIF-8. Moreover, the correlative characteristic peaks attributed to CDs and CdTe QDs did not appear in CD/CdTe QD@ZIF-8. This indicated that the exterior structure of CD/CdTe QD@ZIF-8 had no significant changes compared with ZIF-8, which also proved that CDs and CdTe QDs were covered by ZIF-8. This is consistent with the results in Fig. 2A. As shown in Fig. 2C, CD/CdTe QD@ZIF-8 nanosensor had weaker emission peaks at 438 nm and 650 nm with a single excitation wavelength at 365 nm, while the maximum emission wavelengths of CDs and CdTe QDs were 430 and 640 nm, respectively. The appearance and bathochromic shift of dual-emissive fluorescent peaks demonstrated the successful combination of CDs, CdTe QDs and ZIF-8, and it meets the demand for developing ratiometric fluorescent probes.
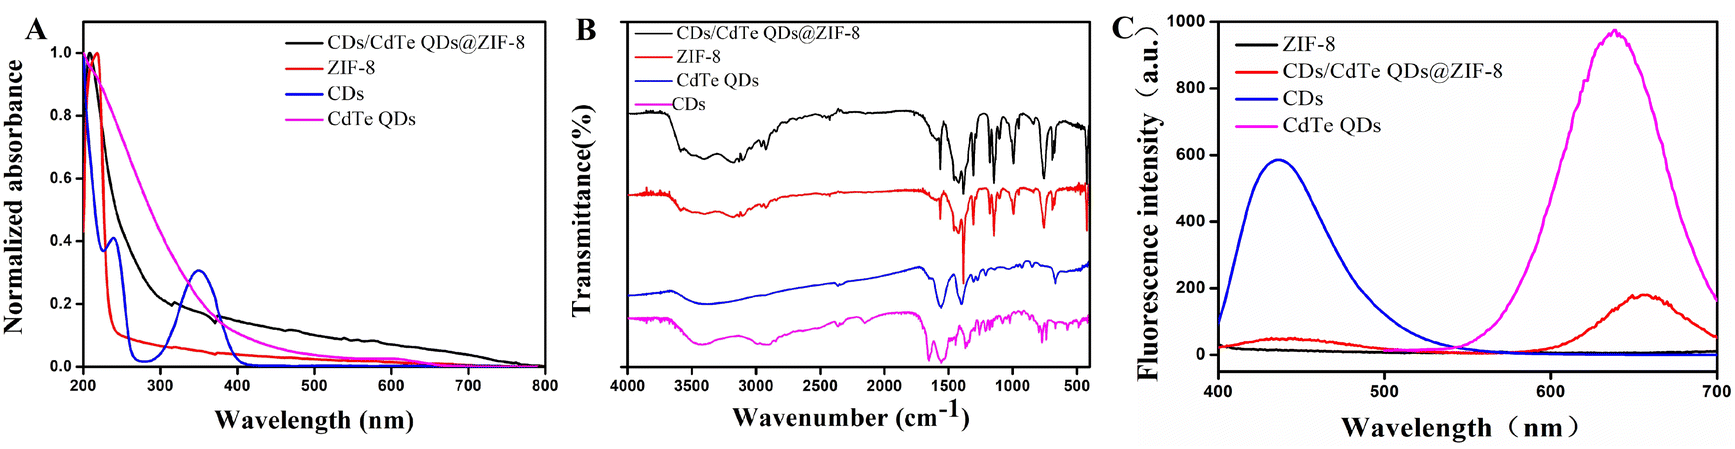 | ||
| Fig. 2 The UV-vis absorption spectra (A), FT-IR spectra (B) and fluorescence spectra (C) of CDs, CdTe QDs, ZIF-8 and CD/CdTe QD@ZIF-8. | ||
In addition, as shown in Fig. 3, the TEM and SEM images demonstrated that there were no significant changes between the size and shape of ZIF-8 and CD/CdTe QD@ZIF-8. This supports our supposition that CDs and CdTe QDs were successfully encapsulated in the cage construction of ZIF-8. EDS mapping images were carried out for the elemental composition tracing of ZIF-8 and CD/CdTe QD@ZIF-8, as depicted in Fig. 3E and F. After encapsuling in ZIF-8, the peaks of Cd and Te attributed to CdTe QDs appeared. Because CDs comprise chemical elements (C, N and O), which were also the components of ZIF-8, no significant changes can prove the existence of CDs occurred. The strong signal of Cu was caused by the copper nets used during the inspection. Combined with the fluorescence spectra of CD/CdTe QD@ZIF-8, we proved the successful synthesis of CD/CdTe QD@ZIF-8. CDs and CdTe QDs were enclosed in the interior space of ZIF-8, not in the external adsorption.
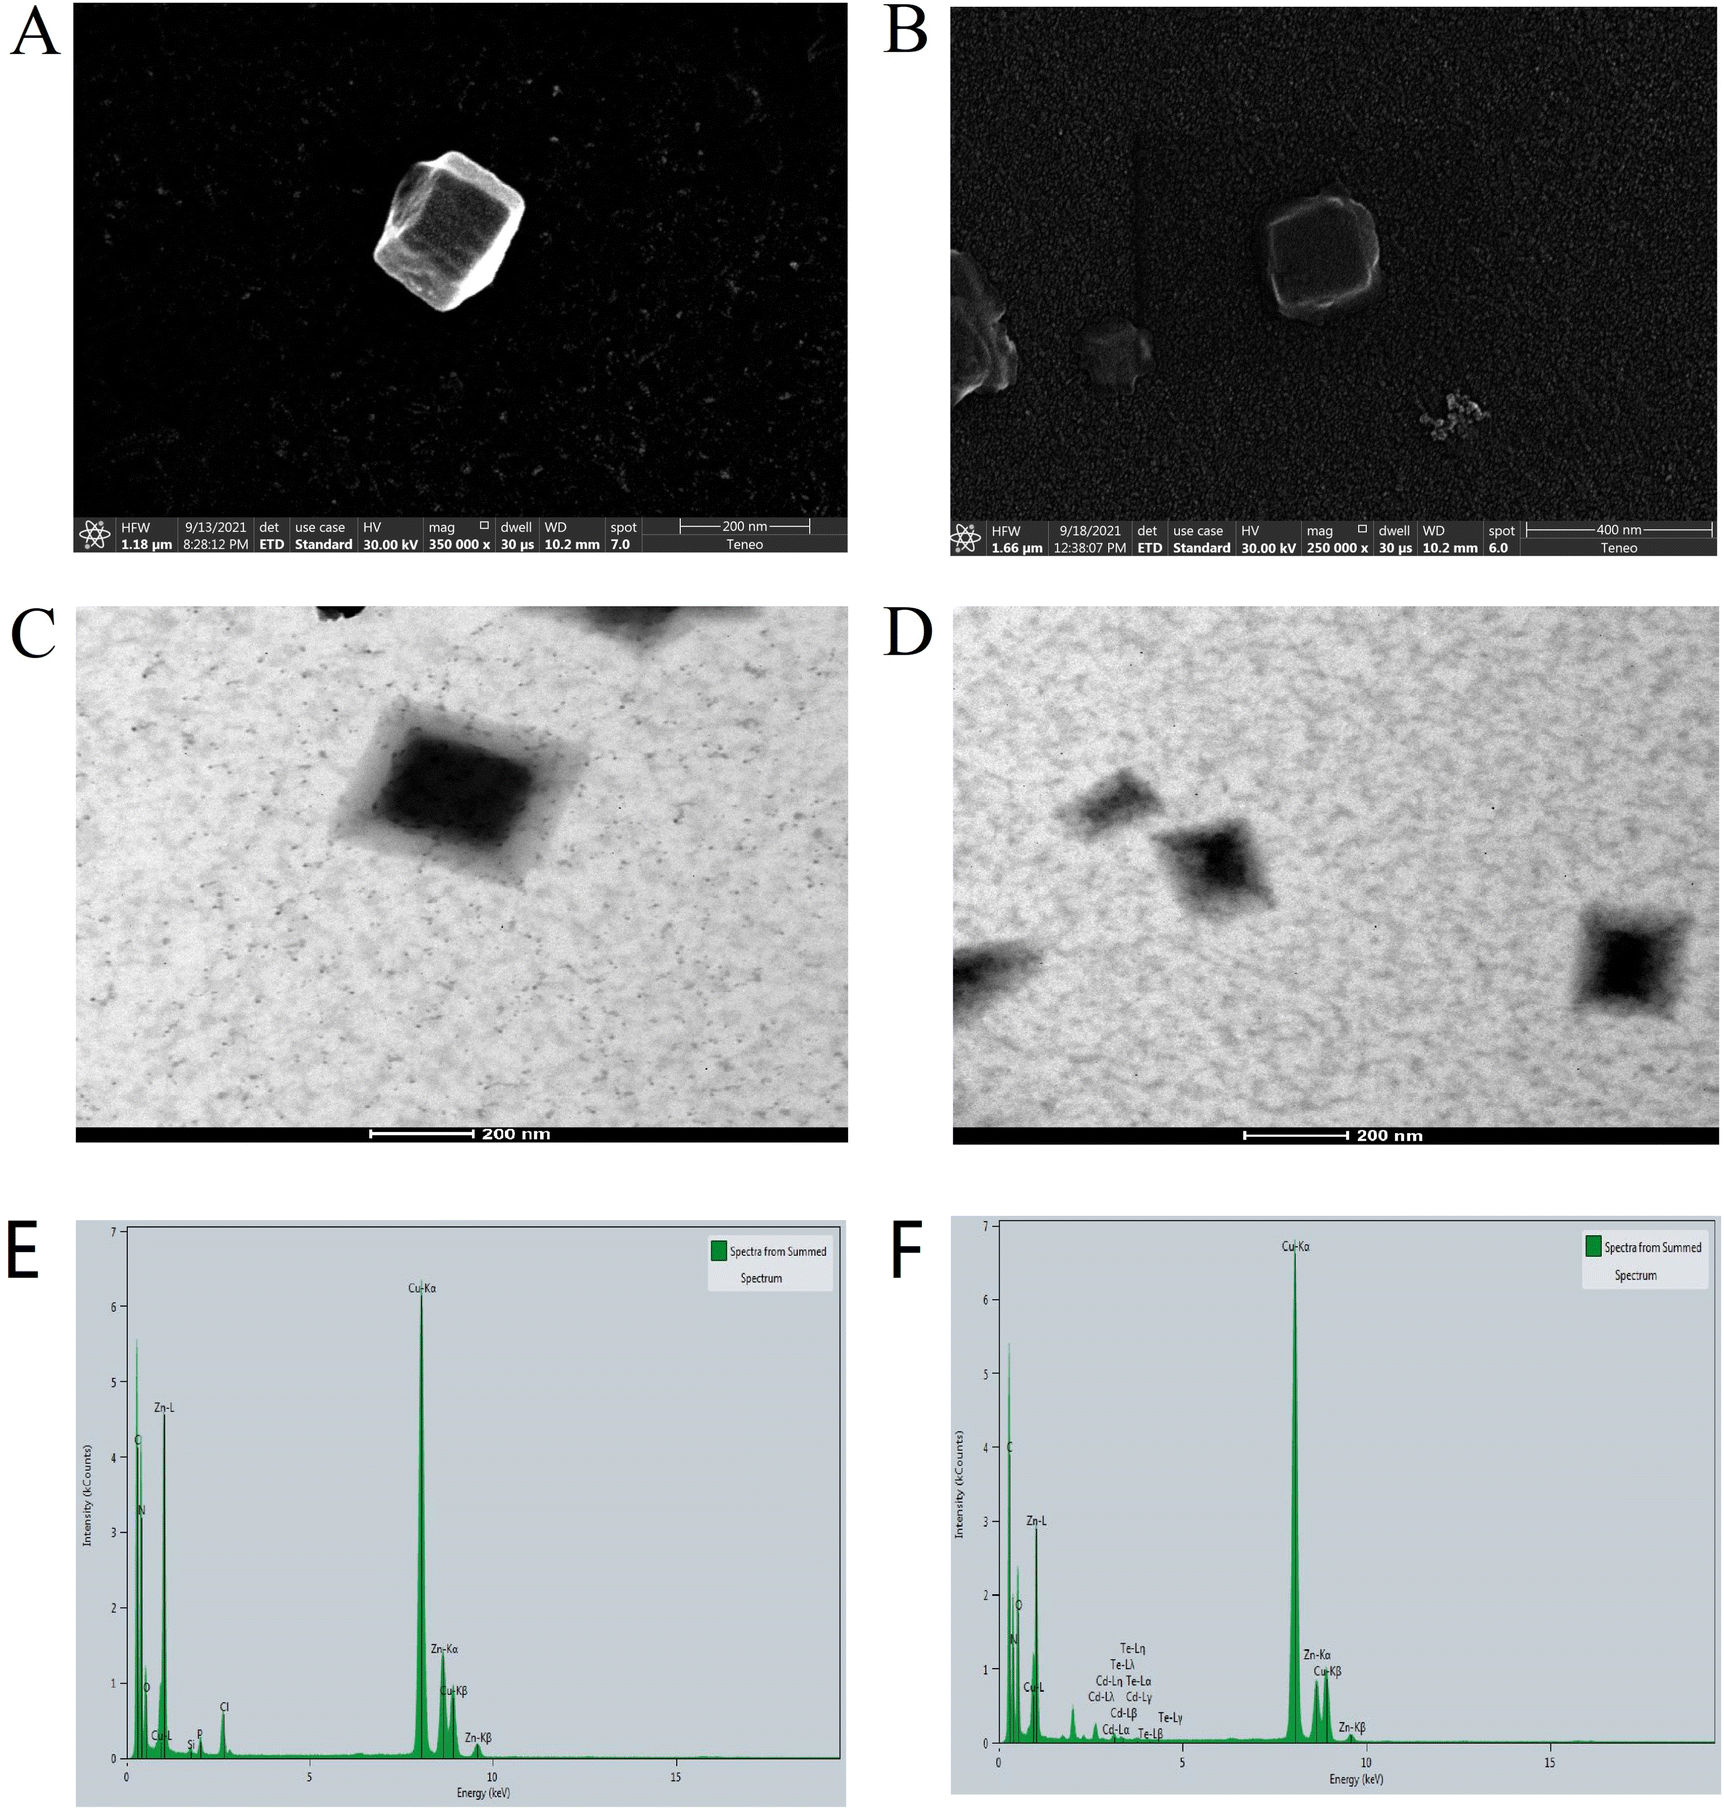 | ||
| Fig. 3 SEM images of ZIF-8 (A) and CD/CdTe QD@ZIF-8 (B); TEM images of ZIF-8 (C) and CD/CdTe QD@ZIF-8 (D); EDS mapping of ZIF-8 (E) and CD/CdTe QD@ZIF-8 (F). | ||
In this paper, we designed a ratiometric fluorescent probe for determining Ag+. As shown in Scheme 1, CDs (internal standard) and CdTe QDs (fluorophore) were synthesized beforehand. Then, the nanosensors (CD/CdTe QD@ZIF-8) were developed using a facile one-pot method, which encapsulates CDs and CdTe QDs into the pore cavities of ZIF-8 (adsorbing material and separator). Because of the excellent adsorption properties of ZIF-8, Ag+ was enriched in the medium. In the presence of Ag+, Ag+ with a large size cannot pass through the shell layer and exchange with Cd2+ from CdTe, and then Ag2Te is generated, which results in the collapse of CdTe QDs and fluorescence quenching. In this nanosensor (CD/CdTe QD@ZIF-8), owing to its excellent stability and chemical inertness to Ag+, CDs play a background reference role in the sensing system, while CdTe QDs are quenched as the Ag+ reaction site. The ratio of the fluorescence intensity of CdTe QDs to CDs was measured for quantitative analysis.
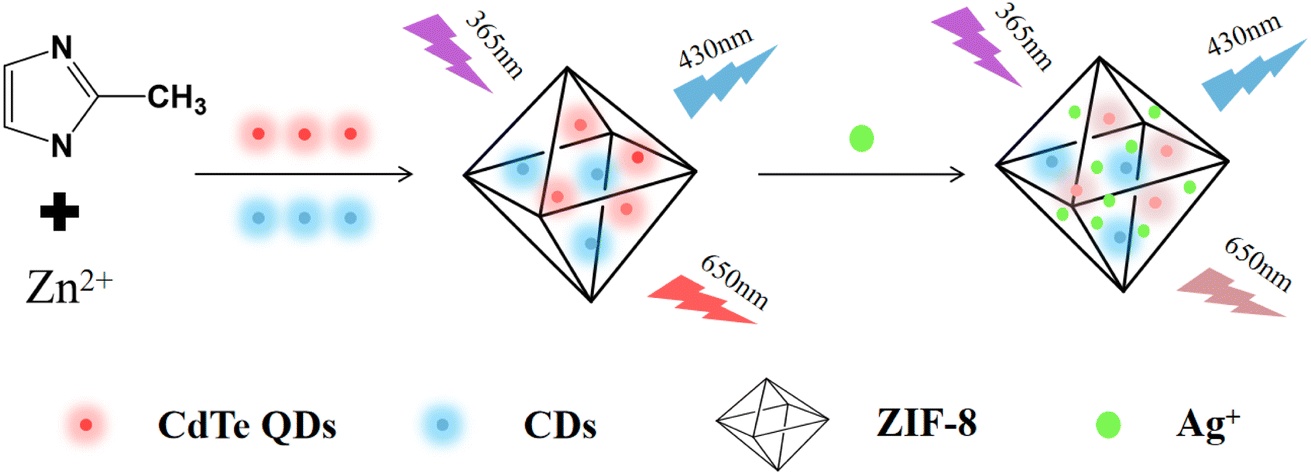 | ||
| Scheme 1 Preparation process and Ag+ detection mechanism of the ratiometric fluorescent probe. | ||
As water samples from the river had different kinds of metal ions, it may affect the fluorescence of the nanosensor.38–40 In our research, several common metal ions were chosen to investigate the responses of the as-prepared nanosensor. The effects of interferents (100 μM) on the fluorescence intensity of CD/CdTe QD@ZIF-8 are demonstrated in Fig. 4A. As shown, negligible changes in fluorescence intensity were observed in the presence of other metal ions, except in Fe3+, Fe2+, Cu2+, Ag+ and Hg2+, compared to nanosensor in anion free solution. The aforementioned results can be explained as follows: in the structure of CdTe QDs, some of the particles are not perfectly coated by a shell. Hence, cations with a small size can pass through the shell layer and interact with the core. Moreover, Ag+ and Cu2+ with larger sizes cannot pass through the shell layer but strongly bind onto the surface of CdTe QDs. Compared with CdTe, Ag2Te and CuTe had extremely low solubility, which resulted in the chemical displacement of surface Cd2+ by Ag+ or Cu2+ to form Ag2Te or CuTe particles on the surface of CdTe QDs. Once Ag2Te or CuTe particles grow, the fluorescence intensity of QDs is quenched efficiently.23,41 In addition, it was reported that Fe3+ could quench the fluorescence of CdTe QDs based on a coordination reaction or fluorescence resonance energy transfer. As for Fe2+ with a strong reducing action, it is easy to be oxidized to Fe3+ in the air. It is interesting that the addition of EDTA can eliminate the effects of other metal ions except for Ag+. Therefore, EDTA was chosen to eliminate the influences brought by these interference ions.42 The results are illustrated in Fig. 4B; only Ag+ can quench the fluorescence intensity effectively after the addition of EDTA. This is attributed to the exfoliation of metal ions–EDTA chelates from the surface of the nanosensor. The results indicate that the developed nanosensor has excellent selectivity and anti-interference ability after the addition of EDTA.
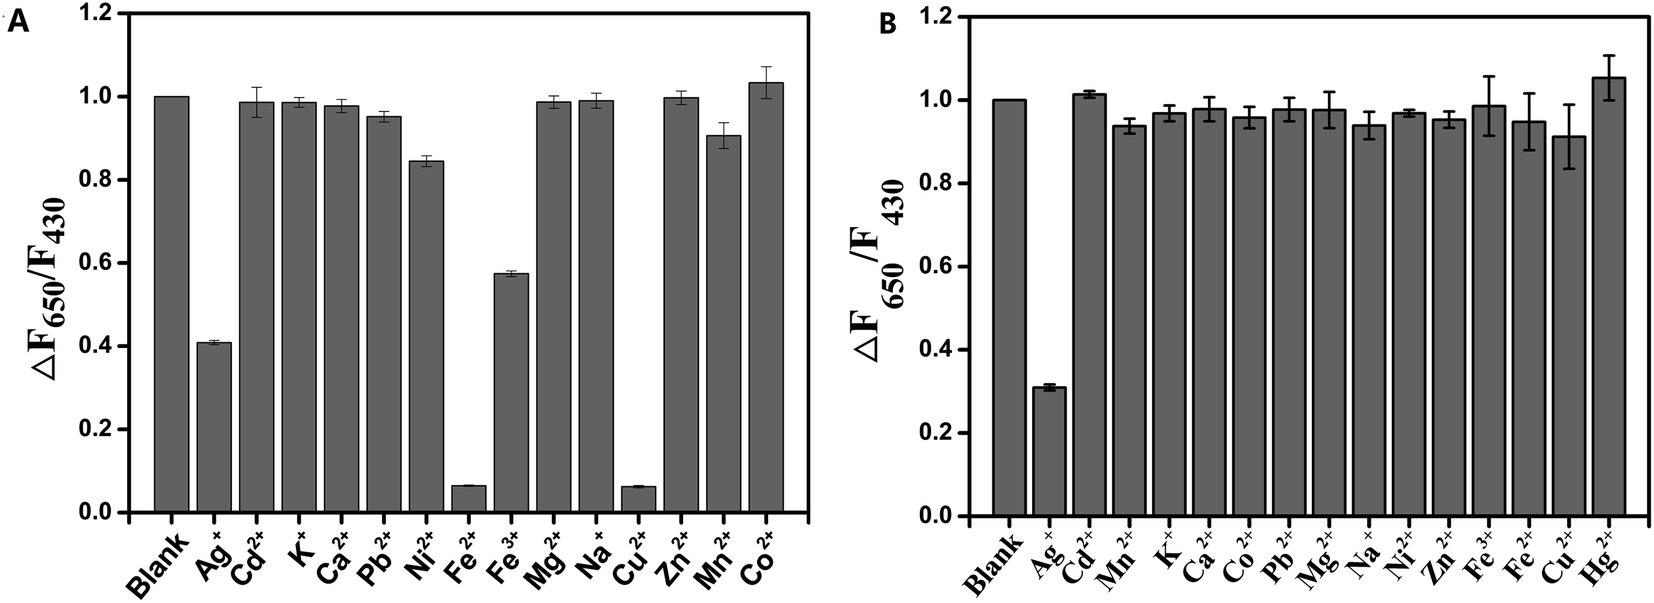 | ||
| Fig. 4 Selectivity of CD/CdTe QD@ZIF-8 in the presence of various potential interferents before (A) and after (B) the addition of EDTA. | ||
As shown in Fig. 5, the color of the CD/CdTe QD@ZIF-8 nanosensor changed gradually from red to pink along with the increase of the Ag+ concentration. Fig. 6 shows that the fluorescence intensity of the as-prepared ratiometric nanosensor at 650 nm decreased along with the increase of the concentration of Ag+, whereas the fluorescence intensity at 430 nm remained unchanged. The change of the fluorescence intensity ratio of the nanosensor at 650 nm and 430 nm (ΔF650/F430) showed a good linear relationship with the increase of Ag+ concentration in a range of 0.1–20 μM. The calibration curve is expressed by the equation ΔF650/F430 = 2.4972 × lg[Ag+] − 4.8643 with a correlation coefficient of 0.9997. The limit of detection based on 3σ/k was 1.49 nM, where σ is the standard deviation of the blank (n = 10) and k is the slope of the calibration line. As shown in Table 1, the intra-day and inter-day relative standard deviations (RSDs) of the three concentrations were all within 10%. Compared to many previously reported results, as depicted in Table 2, the present study using CD/CdTe QD@ZIF-8 nanosensor has a wider linear range and more excellent LOD for Ag+ determination. The outstanding sensitivity of the developed sensor is attributed to the excellent adsorption capacity of the ZIF-8 shell in CD/CdTe QD@ZIF-8. In short, the above results indicate that the probe conducted in this study can meet the needs of the determination of Ag+ in practical samples.
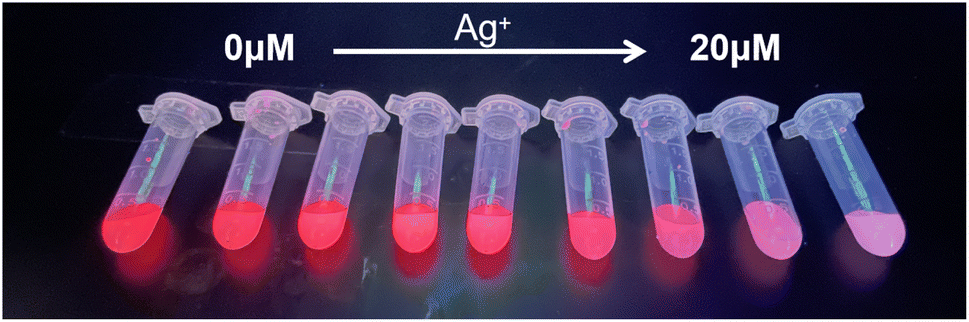 | ||
| Fig. 5 The images of fluorescence changes along with Ag+. | ||
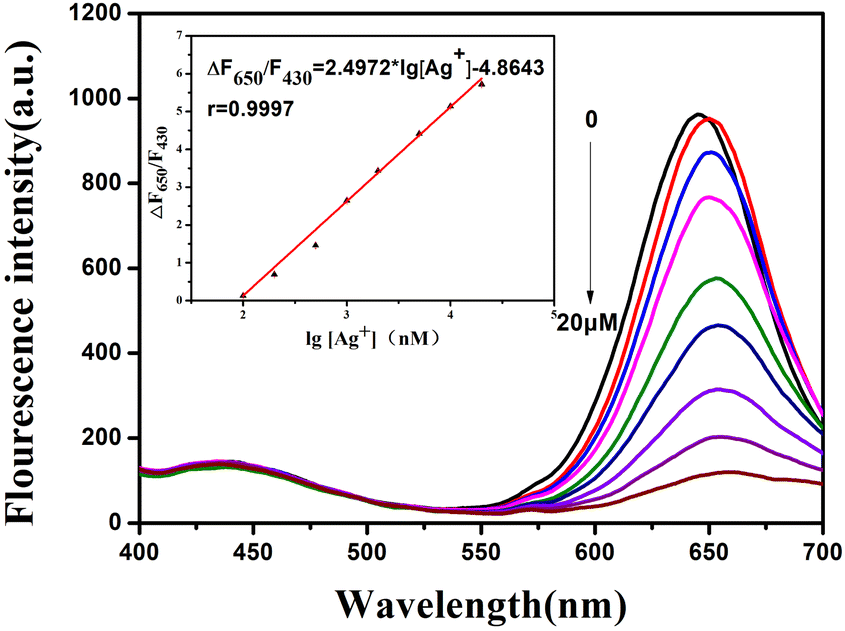 | ||
| Fig. 6 The linearity relationship between fluorescence intensity value of (ΔF650/F430) and different concentration of Ag+. Inset: calibration curve of Ag+ detection in the range of 0.1–20 μM. | ||
| concentration of Ag+ (μM) | Intra-day (μM) | RSD (%) | Inter-day (μM) | RSD (%) |
|---|---|---|---|---|
| 0.2 | 0.204 | 5.7 | 0.196 | 2.3 |
| 0.194 | 0.204 | |||
| 0.182 | 0.204 | |||
| 1 | 0.964 | 4.8 | 1.024 | 9.0 |
| 0.951 | 0.964 | |||
| 0.882 | 1.147 | |||
| 16 | 15.416 | 2.7 | 16.334 | 3.0 |
| 14.674 | 15.416 | |||
| 15.284 | 15.985 |
| Probe | Linear range (μM) | LOD (nM) | References |
|---|---|---|---|
| N-GQDs | 0.2–40 | 168 | 2 |
| MnO2 nanosheet–DNA complex | 30–240 | 9.1 | 16 |
| GSH@CdTe QDs | 0.02–0.2 | 1.3 | 21 |
| MPA stabled CdTe QDs | 0.4–3.2 | 41.06 | 23 |
| Dansyl-peptide | 1–5 | 80 | 43 |
| Cysteamine capped CdS QDs | 0.1–1.5 | 68 | 44 |
| DNA–Ag nanoclusters | 0.05–0.50 | 10 | 45 |
| DNA-functionalized AuNPs | 0.05–0.75 | 9.5 | 46 |
| GQDs and OPD | 0–115.2 | 250 | 47 |
| CD/CdTe QD@ZIF-8 | 0.1–20 | 1.49 | This work |
To verify the feasibility of the proposed method, the prepared nanosensor was applied to detect Ag+ using the standard addition method. The results are presented in Table 3. The recoveries were in the range of 88.29–90.39% with RSDs less than 1%. The results indicate that the as-prepared ratiometric fluorescent probe possesses viability for the determination of Ag+ from real samples.
| Sample | Spiked (nM) | Found (nM) | Recovery (%) | RSD (%) |
|---|---|---|---|---|
| Lake water | 0 | 152.78 | — | — |
| 150 | 288.36 | 90.39 | 0.52 | |
| 300 | 418.90 | 88.70 | 0.35 | |
| 450 | 550.11 | 88.29 | 0.18 |
4. Conclusion
In summary, we successfully prepared a ratiometric fluorescent probe based on multi-nanomaterials (CDs, CdTe QDs and ZIF-8) for determining Ag+ in this study. In this sensor, CDs and CdTe QDs were packaged using ZIF-8. The ZIF-8 shell enriched Ag+ into its interior, which was exchanged with Cd2+ to destroy the structure of CdTe QDs, followed by a change in the fluorescence intensity ratio of the probe. Then, the proposed nanosensor was used to quantitatively determine Ag+ with an LOD of 1.49 nM. Furthermore, the novel ratiometric fluorescent nanosensor with high selectivity and sensitivity shows its promising future in Ag+ detection.Author contributions
Ling Zhu performed the data analyses and wrote the manuscript. Lujia Shi and Yiping Tan contributed significantly to analysis and manuscript preparation. Huaiyin Zhang and Jiacheng Yin helped the testing program. Chang Xu and Danlian Wu helped perform the analysis with constructive discussions. Yunsu Ma contributed to the conception of the study. All authors read and approved the final manuscript.Conflicts of interest
The authors declare that they have no competing interests.Acknowledgements
This work was financially supported by National Natural Science Foundation of China (61901405), Excellent Talents Scientific Research Project (D2019026), General Project of Natural Science of Jiangsu Province (BK20221215), The Medical and Health Guidance Plan Project of Wuxi Science and Technology Development (NZ2019048), and Founded by China Postdoctoral Science Foundation (2020M671608).References
- Y. Zhang, A. Ye, Y. Yao and C. Yao, Sensors, 2019, 19, 247–258 CrossRef PubMed.
- R. Tabaraki and A. Nateghi, J. Fluoresc., 2016, 26, 297–305 CrossRef CAS PubMed.
- S.-L. Cai, Z.-C. Yang, K.-Y. Wu, C. Fan, L.-Y. Zhai, N.-H. Huang, R.-T. Li, W.-J. Duan and J.-X. Chen, RSC Adv., 2019, 9, 15424–15430 RSC.
- M. Yamanaka, K. Hara and J. Kudo, Appl. Environ. Microbiol., 2005, 71, 7589–7593 CrossRef CAS PubMed.
- K. Zou, Q. Liu, J. Chen and J. Du, Polym. Chem., 2014, 5, 405–411 RSC.
- J. F. Zhang, Y. Zhou, J. Yoon and J. S. Kim, Chem. Soc. Rev., 2011, 40, 3416–3429 RSC.
- H. T. Ratte, Environ. Toxicol. Chem., 1999, 18, 89–108 CrossRef CAS.
- C. Greulich, D. Braun, A. Peetsch, J. Diendorf, B. Siebers, M. Epple and M. Koeller, RSC Adv., 2012, 2, 6981–6987 RSC.
- S. Sato, H. Sueki and A. Nishijima, Br. J. Dermatol., 1999, 140, 158–163 CrossRef CAS PubMed.
- N. S. Feichtmeier and K. Leopold, Anal. Bioanal. Chem., 2014, 406, 3887–3894 CrossRef CAS PubMed.
- T. Matousek and R. E. Sturgeon, J. Anal. At. Spectrom., 2003, 18, 487–494 RSC.
- L. P. Zhitenko, Y. V. Taldonov, S. B. Pakhomova, G. S. Knyaz'kin and L. E. Ozerova, Inorg. Mater., 2015, 51, 1404–1409 CrossRef CAS.
- P. Miao, K. Han, B. Wang, G. Luo, P. Wang, M. Chen and Y. Tang, Sci. Rep., 2015, 5, 9161–9165 CrossRef CAS PubMed.
- A. R. Zanganeh and M. K. Amini, Electrochim. Acta, 2007, 52, 3822–3830 CrossRef CAS.
- Q. Zhang, D. Yu, S. Ding and G. Feng, Chem. Commun., 2014, 50, 14002–14005 RSC.
- L. Qi, Z. Yan, Y. Huo, X.-M. Hai and Z.-Q. Zhang, Biosens. Bioelectron., 2017, 87, 566–571 CrossRef CAS PubMed.
- X. Zhu, J. Wang, Y. Zhu, H. Jiang, D. Tan, Z. Xu, T. Mei, J. Li, L. Xue and X. Wang, Microchim. Acta, 2018, 185, 510–519 CrossRef PubMed.
- W. Pu, Z. Zhao, L. Wu, Y. Liu and H. Zhao, J. Nanosci. Nanotechnol., 2015, 15, 5524–5529 CrossRef CAS PubMed.
- X. Chen, Y. Chen, X. Zhou and J. Hu, Talanta, 2013, 107, 277–283 CrossRef CAS PubMed.
- M. Lang, Q. Li, H. Huang, F. Yu and Q. Chen, Microchim. Acta, 2016, 183, 1659–1665 CrossRef CAS.
- H. Wang, W. Zhu, M. Fang, Y. Xu and C. Li, J. Lumin., 2016, 180, 14–19 CrossRef CAS.
- Y.-S. Xia, C. Cao and C.-Q. Zhu, J. Lumin., 2008, 128, 166–172 CrossRef CAS.
- T.-T. Gan, Y.-J. Zhang, N.-J. Zhao, X. Xiao, G.-F. Yin, S.-H. Yu, H.-B. Wang, J.-B. Duan, C.-Y. Shi and W.-Q. Liu, Spectrochim. Acta, Part A, 2012, 99, 62–68 CrossRef CAS PubMed.
- M. Imran, M. Ikram, A. Shahzadi, S. Dilpazir, H. Khan, I. Shahzadi, S. A. Yousaf, S. Ali, J. Geng and Y. Huang, RSC Adv., 2018, 8, 18051–18058 RSC.
- M. Nafees, M. Ikram and S. Ali, Appl. Nanosci., 2017, 7, 399–406 CrossRef CAS.
- Y. Hou, H. Liu, Z. Li, H. Zhang, L. Wei and M. Yu, Anal. Methods, 2020, 12, 2835–2840 RSC.
- Y. Jiang, Z. Wang and Z. Dai, ACS Appl. Mater. Interfaces, 2016, 8, 3644–3650 CrossRef CAS PubMed.
- L. S. Walekar, P. Hu, F. Liao, X. Guo and M. Long, Microchim. Acta, 2018, 185(1), 31 CrossRef PubMed.
- F. Lu, Y. Zhang, J. Cheng, M. Zhang, J. Luo, H. Qu, Y. Zhao and Q. Wang, Mater. Res. Express, 2019, 6, 125005 CrossRef CAS.
- Q. Song, Y. Ma, X. Wang, T. Tang, Y. Song, Y. Ma, G. Xu, F. Wei, Y. Cen and Q. Hu, J. Colloid Interface Sci., 2018, 516, 522–528 CrossRef CAS PubMed.
- X. Xu, Y. Cen, G. Xu, F. Wei, M. Shi and Q. Hu, Biosens. Bioelectron., 2019, 131, 232–236 CrossRef CAS PubMed.
- W. Wu, Y. Fan, B. Tan and H. Zhao, Microchim. Acta, 2020, 187, 608–616 CrossRef CAS PubMed.
- R. Mirzajani, F. Kardani and Z. Ramezani, Microchim. Acta, 2019, 186, 129–143 CrossRef PubMed.
- W. Zhang, S. Fan, X. Li, S. Liu, D. Duan, L. Leng, C. Cui, Y. Zhang and L. Qu, Microchim. Acta, 2020, 187, 69–77 CrossRef CAS PubMed.
- Y. Ma, G. Xu, F. Wei, Y. Cen, Y. Ma, Y. Song, X. Xu, M. Shi, S. Muhammad and Q. Hu, J. Mater. Chem. C, 2017, 5, 8566–8571 RSC.
- L. Zhu, G. Xu, Q. Song, T. Tang, X. Wang, F. Wei and Q. Hu, Sens. Actuators, B, 2016, 231, 506–512 CrossRef CAS.
- Y. Cai, J. You, Z. You, F. Dong, S. Du and L. Zhang, Biosens. Bioelectron., 2018, 99, 332–337 CrossRef CAS PubMed.
- U. Qumar, M. Ikram, M. Imran, A. Haider, A. Ul-Hamid, J. Haider, K. N. Riaz and S. Ali, Dalton Trans., 2020, 49, 5362–5377 RSC.
- J. Hassan, M. Ikram, A. Ul-Hamid, M. Imran, M. Aqeel and S. Ali, Nanoscale Res. Lett., 2020, 15, 75 CrossRef CAS PubMed.
- S. O. A. Ahmad, M. Ikram, M. Imran, S. Naz, A. Ul-Hamid, A. Haider, A. Shahzadi and J. Haider, RSC Adv., 2021, 11, 23330–23344 RSC.
- Y.-h. Zhang, H.-s. Zhang, M. Ma, X.-f. Guo and H. Wang, Appl. Surf. Sci., 2009, 255, 4747–4753 CrossRef CAS.
- M. Ding, K. Wang, M. Fang, W. Zhu, L. Du and C. Li, Spectrochim. Acta, Part A, 2020, 234, 118249 CrossRef CAS PubMed.
- S. Yu, Z. Wang, L. Gao, B. Zhang, L. Wang, J. Kong and L. Li, J. Fluoresc., 2021, 31, 237–246 CrossRef CAS PubMed.
- T. Khantaw, C. Boonmee, T. Tuntulani and W. Ngeontae, Talanta, 2013, 115, 849–856 CrossRef CAS PubMed.
- J. Lee, J. Park, H. H. Lee, H. Park, H. I. Kim and W. J. Kim, Biosens. Bioelectron., 2015, 68, 642–647 CrossRef CAS PubMed.
- G. Wang, S. Wang, C. Yan, G. Bai and Y. Liu, Colloids Surf., B, 2018, 167, 150–155 CrossRef CAS PubMed.
- X.-E. Zhao, C. Lei, Y. Gao, H. Gao, S. Zhu, X. Yang, J. You and H. Wang, Sens. Actuators, B, 2017, 253, 239–246 CrossRef CAS.
| This journal is © The Royal Society of Chemistry 2022 |