 Open Access Article
Modification of carbon foam with 4-mercaptobenzoic acid functionalised gold nanoparticles for an application in a yeast-based microbial fuel cell†
Aliyah ,
Mochammad Arfin Fardiansyah Nasution
 ,
Yulia Mariana Tesa Ayudia Putri
 ,
Jarnuzi Gunlazuardi
 and
Tribidasari Anggraningrum Ivandini
 *
*
Department of Chemistry, Faculty of Mathematics and Natural Sciences (FMIPA), Universitas Indonesia, Kampus UI Depok, Depok 16424, Indonesia. E-mail: ivandini.tri@sci.ui.ac.id
First published on 7th October 2022
Abstract
Modification of carbon foam with gold nanoparticles (AuNPs) was successfully performed through a hydrothermal method. The modified AuNPs were functionalised with 4-mercaptobenzoic acid (MBA) to improve their affinity toward microorganisms. TEM and SEM characterization indicated that although polydisperse spherical nanoparticles of AuNPs with particle sizes around 17 nm were obtained, the attached nanoparticles were agglomerated to be around 0.4 to 1.5 μm in size on the carbon foam surface. The electrochemical studies using cyclic voltammetry technique affirmed that the modified carbon foam electrodes have electroactive properties against glucose. Evaluation of the electrode was performed for a microbial fuel cell using Candida fukuyamaensis yeast as the microorganisms. The polarization curves showed that functionalisation of AuNPs-modified carbon foam with MBA provides around three times higher current density (1226.93 mA m−2) and power density (330.61 mW m−2) compared to the unmodified one. This result indicated that the modification is suitable to improve yeast attachment on the electrode surface.
Introduction
The dependency on non-renewable energy sources has already triggered several negative environmental impacts, such as greenhouse gas emissions and air pollution, which raise various health and social consequences.1 One of the efforts to overcome the energy problem is to utilize environmentally friendly and renewable energy sources that can support human needs for electricity.2Compared to the other energy sources, microbial fuel cells (MFC) are considered as an inexpensive, relatively safe renewable energy source that can convert organic substances, such as acetate and glucose, into electricity through an electrochemical technique by utilizing microorganisms and their metabolic pathways.3,4 Not only to reduce the dependency on fossil-generated energy sources, but the application of MFC can also be used to produce energy from wasteful sources,3 such as household/industrial wastewater,5,6 lignocelluloses biomass,7 and urine.8,9 In principle, MFC performance can be influenced by several factors, namely the microbial inoculums, fuel substrates, proton exchange membranes, and electrode materials.10 The role of electrode and its modification in determining MFC performance has been extensively discussed compared to the other factors as it may significantly affect bacterial adhesion and electron transfer.11
Electrode materials such as graphite rods, graphite brushes, carbon cloth, and carbon paper are commonly used as electrodes in MFCs due to their high electrical conductivity, specific surface area, high biocompatibility, chemically stable and low cost.11,12 In addition, the efficiency of catalysts can be further improved by increasing the surface area through porous electrode material.13 The porous material, for example carbon foam (CF), can also facilitate the microorganisms to colonize and potentially increase the electron transfer between the microorganism and electrodes.14 Accordingly, CF becomes a promising candidate for MFC material electrode. However, CF has several limitations, including its chemically inert surface and low specific surface area.15 To solve the problems, modification of CF with other metals has been often performed to improve its performance.
Some previous works exposed the possibility to improve the performance of the CF as an electrode in glucose fuel cell application by using a noble metal.16,17 Gold nanoparticles (AuNPs) are favourable due to their operational stability and electrocatalytic activity for glucose oxidation.18 Moreover, AuNPs are also biocompatible and chemically stable in the presence of microorganisms without observable self-poisoning.16
It is also crucial in the MFC system to keep the power output stable by maintaining the stability of the microorganisms, as in this system electrons were obtained due to an anaerobic respiratory reaction of the microorganisms by oxidizing glucose. In this case, instead of the direct oxidation of glucose at the catalytic site of electrode, the oxidation of glucose will be performed by the microorganisms, followed by electron transfer to the modified electrode. Accordingly, good immobilization of the microorganisms on the electrode surface is particularly important to maintain the electron transfer between the microorganisms and the electrode. It was reported that gold functionalisation with carboxyl and amine groups forming a stable microbial layer on the electrode surface.19 A direct contact of the implanted functional groups on electrode surface with trans-membrane protein was proposed to enhance microbe adhesion through the polar covalent bonds between carboxyl and amine groups of yeast cells. A number of previous studies proved that carboxyl containing functional groups were responsible to accelerate the direct extracellular electron transfer (EET) of electrochemically active microbe due to the C–N bonds between microorganism and electrode surface.19–21
On the other hand, the development of yeast-based fuel cells has attracted great attention due to its several advantages, such as mostly non-pathogenic, wide range substrate metabolisms as well as inexpensive and easy handling under ambient condition.21,22 Although prokaryotic-based fuel cells have been widely studied and showed great results to transfer electrons by cytochromes in outer membrane, yeasts, the eukaryotic cells, are considered to be the ideal biocatalyst for MFC applications due to its superior metabolic pathway in providing the cell energy balance.23 Additionally, yeast cell membrane contains higher protein which is useful as the electrochemically active sites to capture electrons via EET to generate power.24,25 Several studies have reported the effectiveness of using various yeasts as biocatalysts in MFC systems, such as Saccharomyces cerevisiae sp.,21 Candida sp.,26 and Arxula adeninivorans.27
In this report, AuNPs have been deposited on the CF surface, which was then functionalised with 4-mercaptobenzoic acid (MBA) to provide active sites for the immobilisation of Candida fukuyamaensis (UICC Y-247) in the MFC system. The carboxyl functional groups in MBA were expected to exchange electrons with the immobilised yeast and speed up the metabolism rate. C. fukuyamaensis was selected as the yeast because it is easy to obtain, can grow easily, and relatively stable in extreme conditions.28 An application of this yeast for a sensor development to determine biochemical oxygen demand was reported to perform a stable detection method.28 However, the use of this yeast as a biocatalyst in the MFC system has not been reported. As it was expected, the modification of CF with MBA-AuNPs improved the attachment of C. fukuyamaensis yeast in the MFC system, resulting a significant increase in the power generation.
Experimental
Materials and methods
Glucose (C6H12O6), hydrogen tetrachloro aurate(III) tetrahydrate (HAuCl4), and agar powder were purchased from Wako Pure Chemical Industries, Ltd (Osaka, Japan). Trisodium citrate dihydrate (C6H5Na3O7·2H2O), hydrogen peroxide (H2O2, 30%), potassium hydrogen phosphate (KH2PO4), dipotassium hydrogen phosphate (K2HPO4), Nafion-117, ethanol (CH3CH2OH), and nitric acid (HNO3) were obtained from Merck (Darmstadt, Germany). Sulphuric acid (H2SO4, 98%) was supplied by J.T. Baker (Center Valley, PA, USA), while MBA (4-mercaptobenzoic acid, HSC6H4CO2H, 99%) was obtained from Sigma-Aldrich (St. Louis, MO, USA). All chemicals were purchased and used without further purification. In addition, CF was manufactured and purchased from Xiamen Lith Machine Ltd., while the double-distilled water was produced using Millipore Direct-Q® 5 UV. Finally, the C. fukuyamaensis (UICC Y-247) was cultured and retrieved from the Culture Collection Laboratory, Centre of Excellence Indigenous Biological Resources and Genome, Universitas Indonesia.Microorganism and experimental set-up
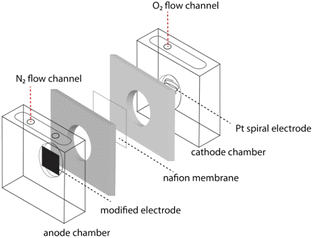
The cube-type MFC reactor was designed with a volume of 40 mL in each chamber and separated by a proton exchange membrane, Nafion 117. Prior to modification, Nafion 117 was pre-treated by boiling in 3% H2O2 for 1 h, soaked in 1 M H2SO4, and finally washed with deionized water to remove the impurities. The system was inoculated with a pure culture of C. fukuyamaensis grown with an anaerobic condition in a sterilized medium fed (10 g L−1 glucose, 3 g L−1 yeast extract, 3 g L−1 malt extract, and 5 g L−1 peptone). The anode compartment was filled with phosphate buffer, glucose, and C. fukuyamaensis. An oxygen-free cell was conditioned by bubbling with high-purity nitrogen gas through the anode compartment. Meanwhile, the cathode compartment was filled with phosphate buffer bubbling with oxygen to support the water formation reaction. The schematic equipment of the fabricated MFC cell is shown in Fig. 1.Electrode preparation
The electrode for MFC was prepared by modifying CF with AuNPs using a hydrothermal method.29 Prior to modification, CF was cleaned by ultrasonication in 0.1 M HNO3 followed by deionized water for 15 min each. Then, CF was immersed into a mixture solution of 30 mL 2.4 mM HAuCl4 solution and 5 mL 1% sodium citrate solution in a 50 mL Teflon-lined stainless steel.30,31 The mixture containing CF was then placed in an autoclave and heated to 120 °C for 6 h. After the reaction, CF was separated, rinsed with distilled water, and dried in the oven at 60 °C.To functionalise the AuNPs-modified CF (AuNPs@CF) with MBA, AuNPs@CF was placed in ethanol solution containing 2 mmol L−1 MBA for 48 h.32 Then, the MBA-functionalised AuNPs@CF (MBA-AuNPs@CF) was rinsed with deionized water and dried in N2 atmosphere. The characterization was performed by FTIR and UV-vis spectroscopy as well as SEM, TEM, and XRD. The schematic preparation of the MBA-AuNPs@CF electrode was provided in Fig. S2.†
Electrochemical characterization of MFC system
Electrochemical characterization was conducted by using cyclic voltammetry (CV) and electrochemical impedance spectroscopy (EIS) to analyse the electrochemical process in the system. All the electrochemical measurements were conducted using a three-electrode electrochemical system. The MBA-AuNPs@CF was used as the working electrode, while Pt spiral and Ag/AgCl were used in this work as the counter and the reference electrodes, respectively. All electrodes were connected to Autolab potentiostat (PGSTAT204) to collect the measured voltage and current data. Open circuit voltage (OCV) was first measured for 10 min until it reaches the steady state. The voltage output was measured for 5 h running and the average of the last 10 seconds of data in every 5 min were then recorded as voltage and current data.Results and discussion
Preparation and characterization of the modified-carbon foam
AuNPs were synthesized using trisodium citrate as both reducing and capping agent to control the morphology and dispersity of nanoparticles as well as to prevent aggregation or coagulation during the synthesis.33 Trisodium citrate can be later decomposed into citric acid, which can act as a weak reducing agent to reduce AuCl4− (from HAuCl4, the precursor) into Au0. Several parameters affecting the formation results can be controlled including the ratio of gold ion concentration, reaction temperature, synthesis time, and pH.34The hydrothermal method was used in the synthesis and deposition of AuNPs on CF electrodes. This technique was used to accelerate the interaction between solid and liquid substances, resulting in an increase kinetics reaction.35 Thus, the high production yield of homogeneous particle size can be achieved. In this study, the cleaned CF electrodes were placed in the Teflon autoclave together with HAuCl4 and trisodium citrate solutions. It was expected that AuNPs will grow on the electrode surface due to the electrostatic interaction occurs between AuNPs on the CF. Charge transfer and π–d electronic interactions facilitate the electronic affinity between AuNPs and CF as a support material.30 The occurrence of AuNPs deposited on the electrode surface is visually indicated by the presence of a dark purple coating on the CF surface after the hydrothermal process.
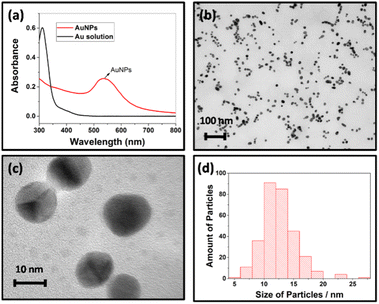
The size of AuNPs formed on the surface of CF was predicted by characterizing the solution in the reactor with a UV-vis spectrometer and TEM. The ability of AuNPs to display a series of colours (brown, orange, red, and purple) in solutions can be reflected in the visible spectrum with an absorption peak at 500–550 nm.36 The wavelength of the absorbance peak depends on the increase of particle diameter, which corresponds to the particle formation from 1 to 100 nm. The UV-vis spectrum of AuNPs solutions synthesized with the hydrothermal method showed an absorption spectrum at a wavelength of 533 nm (Fig. 2a), indicating that AuNPs have been formed with a diameter of more than 10 nm.33 Confirmation using TEM shows that AuNPs have spherical shapes (Fig. 2b and c) with a size distribution from 6 nm to 25 nm determined by ImageJ software (Fig. 2d).
SEM characterization was also performed to determine the CF morphology before and after modification with AuNPs. Fig. 3 shows that the AuNPs have been well deposited on the CF surface. The results show that the gold particles have fewer uniform sizes, with the distribution size between 0.4 and 1.5 μm. Corresponding to the particle size, the AuNPs were agglomerated after being deposited on the CF surface which can be caused by attraction forces between the nanoparticles. However, the distribution of Au particles on the CF surface seems to be evenly spread and well deposited through the results of SEM mapping (Fig. S1†). Furthermore, EDS characterization revealed the presence of nickel at around 13.89% as the carbon foam was prepared by using nickel foam as the support. Meanwhile, the presence of gold was 37.46%. The EDS result is summarised in Table 1.
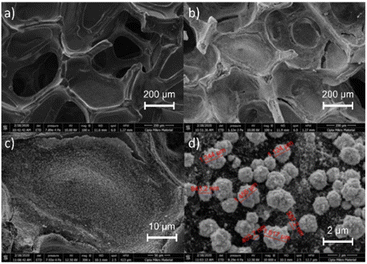 | ||
Fig. 3 SEM images of CF morphology before (a) and after modification with AuNPs with (b) 100×, (c) 300×, and (d) 100![[thin space (1/6-em)]](https://www.rsc.org/images/entities/char_2009.gif) 00× magnifications. 00× magnifications. | ||
| Element | % Mass | % Atom |
|---|---|---|
| C | 37.95 | 74.25 |
| O | 10.70 | 15.71 |
| Ni | 13.89 | 5.56 |
| Au | 37.46 | 4.47 |
Further confirmation by using XRD was performed. Fig. 4a displays the XRD pattern of CF in comparison with those of the gold plate and the prepared AuNPs@CF. The XRD spectra of CF (black line) show very sharp peaks of the 2θ of 44.1° and 51.6° correspond to Ni (111) and Ni (200).37,38 However, the spectrum magnification observes weak peaks at the 2θ of 26.6° (002), and 44.8° (100) validating the presence of carbon.38,39 These spectra confirm the specification of the CF that was prepared by carbon coating on the surface of nickel foam as the template. On the contrary, the strong XRD pattern of Au (orange line) shows the typical characteristic diffraction peaks of gold at the 2θ of 38.4° (111), 44.5° (200), and 64.9° (220).37,40 These peaks appear at the XRD spectrum after the modification of CF to be AuNPs@CF (blue line), indicating the successful AuNPs attachment on the surface of CF.
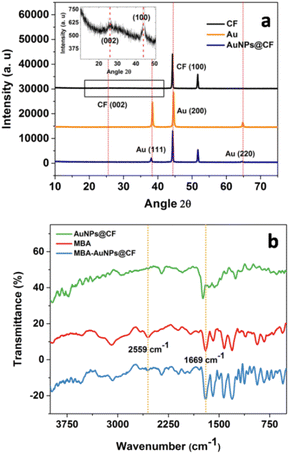 | ||
| Fig. 4 (a) XRD patterns of CF, Au, and synthesized AuNPs@CF, and (b) FTIR spectra of MBA, AuNPS@CF, and MBA-AuNPs@CF. Inset of (a) shows the magnification of the XRD spectrum of CF. | ||
Furthermore, full width at half maximum value was measured using the Debye–Scherrer equation to calculate the size of the crystal particles. From the three typical AuNPs@CF peaks, the similar average particle size of one crystal unit was observed at 17 nm.
To confirm the presence of MBA at the modified CF, FTIR characterization was performed. The FTIR spectra (Fig. 4b) were recorded for MBA-AuNPs@CF in comparison to the unfunctionalized AuNPs@CF and MBA. The spectrum of AuNPs@CF (green line) exhibited stretching bands at 1739 cm−1 and 1261 cm−1 due to the COO− vibrations of citrate from the capping agent, trisodium citrate.41 This result showed the evidence that citrate has been adsorbed on the AuNPs and acted as the capping agent of AuNPs. Furthermore, the spectrum of MBA (red line) shows typical peaks at wavenumber 2559 cm−1 correspond to S–H stretching absorption, 1699 cm−1 related to C![[double bond, length as m-dash]](https://www.rsc.org/images/entities/char_e001.gif) O carbonyl stretching, 1483, 1428, 1392 cm−1 to C
O carbonyl stretching, 1483, 1428, 1392 cm−1 to C![[double bond, length as m-dash]](https://www.rsc.org/images/entities/char_e001.gif) C aromatic, and 2500–3300 cm−1 to O–H vibration of carboxylic acid. Additionally, several fingerprint-region peaks were observed at 692 cm−1, which corresponds to C–S stretching vibration, while at 936 cm−1 to O–H bending vibration (out of plane), and at 1306 cm−1 to C–O stretching vibration.
C aromatic, and 2500–3300 cm−1 to O–H vibration of carboxylic acid. Additionally, several fingerprint-region peaks were observed at 692 cm−1, which corresponds to C–S stretching vibration, while at 936 cm−1 to O–H bending vibration (out of plane), and at 1306 cm−1 to C–O stretching vibration.
Meanwhile, upon the addition of MBA, all those peaks at both MBA and AuNPs@CF spectra were observed to have the same absorption peaks at the MBA-AuNPs@CF spectrum (blue line) with the absence of –SH at 2559 cm−1 as the exception. The results indicated that MBA has been successfully attached on the surface of the AuNPs specifically through its –SH groups.42 The tendency of AuNP to attach at –SH groups can be explained based on the hard and soft Lewis acids and bases theory.43 Accordingly, considering higher affinity of S to gold than S to carbon, most probably S–Au bonds were mainly formed in the attachment of MBA. Although from the FTIR spectra, it was not clear whether S–C or S–Au bonds were formed.
Electrochemical studies of the prepared electrodes
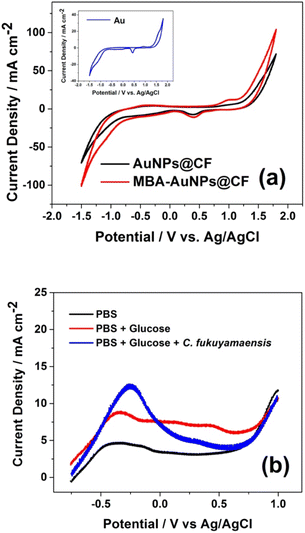
To confirm the existence of AuNPs that has been well deposited on the electrode surface, electrochemical studies in 0.1 M phosphate buffer solution (PBS) pH 7.2 were conducted using electrodes before and after MBA functionalisation. The anodic and cathodic peaks were observed in the AuNPs@CF voltammogram (Fig. 5a, black line) at +1.00 and +0.40 V, respectively. According to eqn (1),43 these oxidation peaks correspond to the formation of an oxide monolayer on the AuNPs.| 2Au + 3H2O + 6e− → Au2O3 + 6H+ | (1) |
This result was confirmed to the voltammogram of the Au electrode as the control (Inset of Fig. 5a), which shows similar peak potentials. These typical peaks were also observed after electrode functionalisation to be MBA-AuNPs@CF (Fig. 5a, red line) with a slightly higher generated current density (11.8 mA cm−2) compared to that before the modification. The higher current density of MBA-AuNPs@CF was due to the increase of the electroactive surface area and the conductivity of the electrode after the MBA functionalisation.
Linear sweep voltammetry was also performed in three different mediums to confirm the oxidation of glucose as the substrate and the role of C. fukuyamaensis as the biocatalyst using the modified electrode, MBA-AuNPs@CF. Comparison of the voltammograms in the absence (Fig. 5b, black line) and in the presence of glucose (Fig. 5b, red line), showing two oxidation peaks detected at approximately −0.2 and 0.4 V in the N2-saturated electrolyte. After glucose was added, an obvious oxidation peak appeared, indicating that glucose was oxidized by the AuNPs. These peaks were associated to the oxidation of glucose forming the overlapping peaks with the further glucose oxidation, as previously reported.44 Meanwhile, in the addition of C. fukuyamaensis (Fig. 5b, blue line), the peaks at −0.2 and 0.4 V were not observed in the voltammograms, while a significant increase of current density at −0.3 V is observed due to the oxidation of glucose through the anaerobic respiration of C. fukuyamaensis. The mechanism of glucose oxidation by microorganisms was proposed to be similar to the enzymatic reaction by glucose oxidase.45
To evaluate the effectiveness of MBA functionalisation in increasing current density by producing a higher biofilm attachment, further CV measurements were carried out using two different electrodes (AuPNs@CF and MBA-AuNPs@CF) in the absence and in the presence of C. fukuyamaensis as the biocatalyst. In the absence of C. fukuyamaensis (Fig. 6a), oxidation peaks are observed in both electrodes. This profile proved that the glucose oxidase-like activity of AuNPs promotes the oxidation process of glucose which represents by anodic peak at −0.3 V. Moreover, the presence of C. fukuyamaensis (Fig. 6b) at each electrode depicts a reduction peak around −0.4 V which attributed to the reduction of NAD+ (NAD+ + H+ + 2e− → NADH) through a metabolic pathway of C. fukuyamaensis. A summary of the peak potentials and the current density produced from the voltammograms in Fig. 6 is displayed in Table 2, showing higher peak intensity at the modified electrodes. The results indicated that more microorganisms could be attached on the surface of MBA-functionalised electrode.
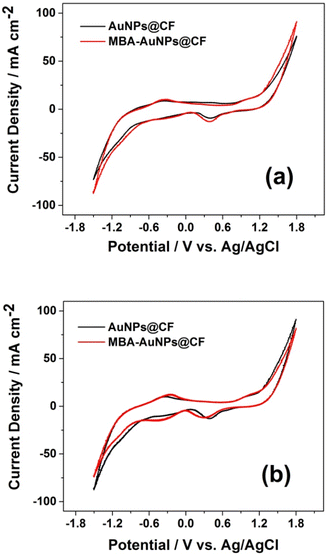 | ||
| Fig. 6 Cyclic voltammograms of glucose in 0.1 M PBS (a) in the absence and (b) in the presence of C. fukuyamaensis. | ||
| Electrode | Epc (V vs. Ag/AgCl) | J (mA cm−2) in the absence of biocatalyst | J (mA cm−2) in the presence of biocatalyst |
|---|---|---|---|
| AuNPs@CF | −0.3908 | 8.96 | 10.27 |
| MBA-AuNPs@CF | −0.3912 | 10.28 | 16.87 |
It was previously reported that the N-, O-, and S-containing surface functional groups on carbon substrate can improve adsorption capacity of carbon for not only molecules like CO2, heavy metals, or other metabolites, but also microorganisms.46,47 FTIR spectra in Fig. 4b suggest that the MBA modification at AuNPs@CF provided carboxyl functional groups, which can contribute to the electron exchange capacity of carbon materials to form stable interactions with amine groups of yeast. The increase of the current density after MBA modification (Table 2) indicated the improvement of electrons exchange of the modified carboxyl surface functional groups with the adsorbed yeast to speed up the metabolism rate. Furthermore, the extracellular electron transfer mechanism of MBA-AuNPs@CF between the conductive material and the yeast on the electrode can involve the direct interspecies electron transfer (DIET), resulting in higher conductivity of CF and AuNPs. Recently, the DIET mechanism of carbon materials in microbial (electrochemical) systems have been discussed.48–50 Briefly, the DIET mechanism of electron transfer in yeast cell was defined during the degradation of organic compounds, in this case is glucose (Fig. S3 Scheme A†). Initially, glucose consumed by the C. fukuyamaensis is oxidized into pyruvate during glycolysis process (glucose → pyruvate + 4H+ + 4e−), generating ATP and NADH, which then recycled through its oxidation by releasing the electron to the anode surface through the trans-membrane protein via DIET (Scheme B†). Since glycolysis reaction takes place in the cytosols of the cells rather than in the mitochondria, the electrons are easily accessible throughout the membrane of the yeast by the help of carboxyl functional groups to be further transported into the electrode surface in the anode chamber. Further, these electrons will be transported onto the cathode chamber throughout the external circuit to exhibit currents. Accordingly, it could be concluded that the MBA functionalisation could improve the electron exchange capacity through the simple DIET mechanisms and be promising to enhance the MFC performances.
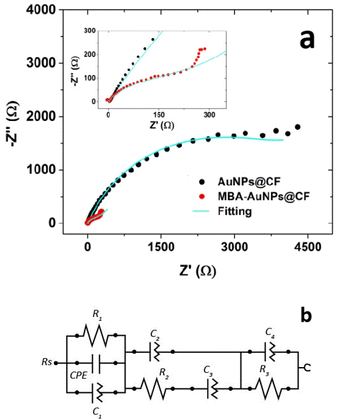
Electrochemical impedance spectroscopy (EIS) measurements were carried out to provide information on the impedance changes caused by chemical interaction at the interface between the electrode surface and electrolyte, which produce an electrical charge transfer or ion diffusion process.45 In the frequency ranges from 100 kHz to 1 MHz with an amplitude signal of 10 mV, the EIS spectra (Fig. 7) show an incredibly significant difference between AuNPs@CF with and without MBA functionalisation. The Nyquist plot of the functionalised electrode (red line) displays a linear and semicircle part, while the non-functionalised one (black line) shows only a large-diameter semicircle. The smaller semicircle of MBA-AuNPs@CF exhibits an exceptionally low charge transfer resistance and indicates remarkable enhancement of catalytic reaction and electron transfer. These findings reflect the vital role of MBA functional groups in enhancing and promoting electron transfer as the resistance decrease the MBA-AuNPs@CF to the electrolyte interface. In addition to the expectation in increasing the direct contact between the electrode and the C. fukuyamaensis due to the presence functional group of MBA, it is also expected to enhance the electron transfer efficiency.51
The values of polarization resistance (Rp) and initial resistance (Rs) were obtained and summarized in Table 3. The value of Rp was similar to that of Rct which represents the charge transfer resistance between electrolyte and electrode surface. Compared to those of the AuNPs@CF, the Rp and Rs of MBA-AuNPs@CF were smaller, suggesting the decrease of resistance AuNPs@CF after the functionalisation. In this work, the appearance of negative resistance (Rs = −0.2099 Ω) in the Nyquist plots of the MBA-AuNPs@CF electrode corresponds to the formation of an oxide film.52 This issue will correlatively give the same result to the measurements of the polarization curve by giving a negative slope. In addition, the experimental data fitting to the conventional non-linear least-square exhibits a good agreement as shown by the corresponding Nyquist plots in Fig. 7b. The decrease of the resistance in MFC system due to the addition of the functional groups was previously reported as well.51
| Electrode | Rs (Ω) | Rp (Ω) |
|---|---|---|
| AuNPs@CF | 4.3235 | 4512.6 |
| MBA-AuNPs@CF | −0.2099 | 319.74 |
MFC acclimatization
Acclimatization is the process by which a microbial population adapts to degrade a compound (glucose, in this study) to which it is exposed. The acclimatization process is a significant role to understand the microorganisms’ activity for power production. The current density output during the acclimatization process, as the growth time and the formation of biofilm on the surface of the electrodes, was monitored.The current density output in Fig. 8 shows an upward trend from the first day until the fourth day. Starting from zero, the current density continuously raises to 100 mA m−2 on the first and the 2nd day, while on the next day, the current density sharply raises, reaching approximately 650 mA m−2 and hitting the maximum point at 1270 mA m−2. A rapid increase in current density indicates that the microorganisms were in a logarithmic growth phase. Furthermore, current density generation on the 4th day reaches around 1250 mA m−2 in 60 min, and then continues hovering reaching the steady-state condition. After 4 days of acclimatization, a stable biofilm was established in the MFC system, adapted to utilize glucose as its substrate.
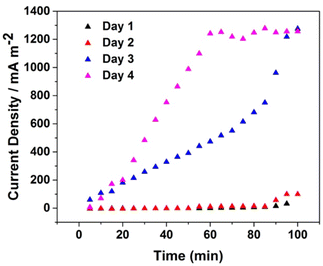 | ||
| Fig. 8 Profile of the current density output of the MFC in 0.1 M PBS pH 7.2 containing glucose and C. fukuyamaensis during the acclimatization using MBA-AuNPs@CF electrode in 4 days measurements. | ||
Power production
There are four options for MFC polarization measurement,50 first is by giving the resistance to the MFC system; the second is by conducting LSV with a slow scan rate; the third is by controlling the current density and the resulting voltages measured (galvanostatic discharge); and the last is by potentiostatic discharge. Performance studies of the electrode in this study were defined by a potentiostatic discharge, where the voltage was controlled then the resulting current density was measured.The polarization curves in Fig. 9 shows the performance parameter including open circuit potential (OCV) and power density generation of the AuNPs@CF (Fig. 9a) and MBA-AuNPs@CF (Fig. 9b) electrodes. The potential generated by the MBA-AuNPs@CF was 0.5564 V vs. SHE with the obtained maximum current density was 3797 mA m−2. In the case of AuNPs@CF, the obtained potential and maximum current density were 0.6060 V vs. SHE and 894 mA m−2, respectively. The power density was calculated by multiplying the potential and current density response and plotted as a semi-circular curve.
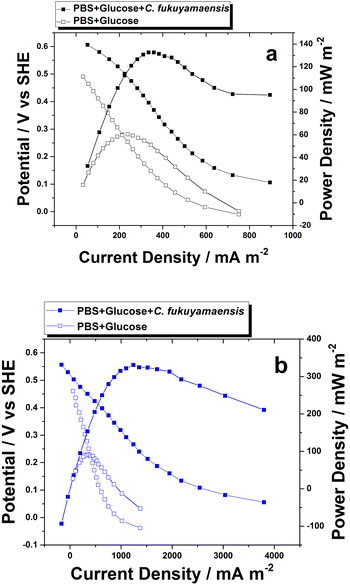 | ||
| Fig. 9 Typical power density and polarization curves generated using (a) AuNPs@CF and (b) MBA-AuNPs@CF in 0.1 M PBS pH 7 containing 5 mM glucose with and without the presence of C. fukuyamaensis. | ||
The comparison between two electrodes indicated that the functionalised electrode could stimulate biofilm enrichment. However, when compared to both results in Table 4, the OCV of both electrodes have different values which are then associated with the power obtained. MBA-AuNPs@CF produces lower potentials than AuNPs@CF. Nonetheless, the power produced by MBA-AuNPs@CF was higher than the unfunctionalized one. Some previous studies reported that power production of MFC laboratory-scale is varied depending on some factors, namely voltage produced by the systems, electrode surface area, and external resistance.53,54 These factors allow an analysis of how the external resistance could affect the power production, which was in accordance with the observation of EIS measurements.
| Electrode | Medium | OCV (V) | Current density (mA m−2) | Power density (mW m−2) |
|---|---|---|---|---|
| AuNPs@CF | PBS + glucose | 0.4907 | 283.27 | 40.9 |
| PBS + glucose + C. fukuyamaensis | 0.6060 | 392.29 | 132.67 | |
| MBA-AuNPs@CF | PBS + glucose | 0.4602 | 300.63 | 81.82 |
| PBS + glucose + C. fukuyamaensis | 0.5564 | 1226.93 | 330.61 |
A summary of the OCV and power density measurements is displayed in Table 4, showing that the MFC performance using the MBA-AuNPs@CF as the working electrode has the highest current and power density compared to the AuNPs@CF electrode. The maximum power density of AuNPs@CF was improved to be around four times higher after it functionalised with MBA as displayed in Fig. 9. Eventually, this result suggests that the modification of the electrode surface enables better MFC performance due to better microorganism’s attachment on the electrode.
Typical studies by Han et al.13 illustrated the effect of porosity as an accessible surface for microorganism entrapment by comparing CF and graphite felt, where the CF appeared to have a larger amount of microorganism adherence as well as a higher current density generation. The surface functional groups influence biofilm growth and structure. Functionalisation of the electrode with MBA could significantly improve the interaction between the surface electrode and microorganism as the implanted functional groups on electrode surfaces facilitate a short-distance force, namely hydrogen bonds, covalent bonds, or peptide bonds as expected in this study. In addition, stable microorganism adsorption has been well achieved for the majority of microorganism adhering, which led to an increase in the MFC power output. This result is in good accordance with the SEM result after MFC measurements as shown in Fig. 10.
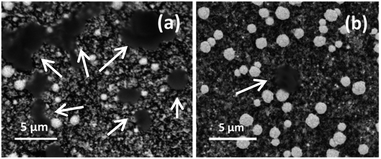 | ||
| Fig. 10 SEM images after 5 hours MFC measurements using MBA-AuNPs@CF (a) and AuNPs@CF (b). The white arrow in (a and b) indicates the C. fukuyamaensis yeast existence on the electrode surface. | ||
SEM images were conducted to verify the attachment of C. fukuyamaensis on each electrode after 5 h MFC operation. Fig. 10 clearly shows bubble area image in clear black contrast resembles of the yeast clusters. The two electrodes showed differences in the biofilm morphologies of their surfaces. The appearance of cell aggregates wrapped the MBA-AuNPs@CF (Fig. 10a) electrode, while the biofilm on AuNPs@CF (Fig. 10b) was sparse and rare. In particular, the MBA-AuNPs@CF electrode was observed to attach more amount of C. fukuyamaensis.
Table 5 shows the comparison of AuNPs@CF and MBA-AuNPs@CF used in this work with other reported Au and carbon-based electrodes for MFC application.8,13,17,19 MBA-AuNPs@CF produced higher current density as well as power density in compared to Au, Au-COOH, Au-NH2, BDD, and Bio Au MWCNT@CC,8,17,19 although lower current and power densities were generated compared to the CF and NPS-CF electrode when acetate and G. sulfurreducens were used as the substrate and biofilm,14 respectively. The probable reason might be due to the different formation of biofilm which could affect its ability to surpass the electron into the electrode that led to generating higher power density in MFC. Therefore, this MBA-AuNPs@CF still needs to be further optimized to achieve better performance.
| Anode | Substrate | Biofilm | Power density (mW m−2) | Current density (A m−2) | Ref. |
|---|---|---|---|---|---|
| Au | Acetate and fumarate | G. sulfurreducens | — | 0.35 | 19 |
| Au-COOH | — | 0.99 | |||
| Au-NH2 | — | 0.82 | |||
| Carbon foam | Acetate | G. sulfurreducens | 1218 | 2.87 | 13 |
| NPS-CF | 3134 | 7.56 | |||
| Boron-doped diamond | Glucose | C. fukuyamaensis | 186 | 1.03 | 8 |
| Bio Au MWCNT@CC | — | Digester sludge | 178.34 | — | 17 |
| MBA-AuNPs@CF | Glucose | C. fukuyamaensis | 330.61 | 1.23 | This work |
Despite the value being low compared to the previous work,13 the performance is still better than the work of Rahmawati et al.8 using the same substrate and yeast which produced current and power densities of 1030 mA m−2 and 186.43 mW m−2, respectively. The low power generated may be caused by poor mass transfer and poor electron transfer pathway due to the inconvenient orientation between C. fukuyamaensis and MBA-AuNPs@CF. Therefore, it is necessary to maximize the current density generation by the use a flow cell as well as optimising the amount of the applied yeast.
System stability
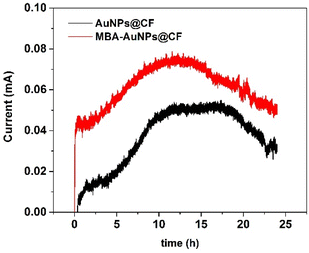
In contrast to the chemical fuel cell where the electrode has a key role as catalyst, in microbial fuel cell, microorganisms initiate the chemical reaction as the biocatalyst. Therefore, the stability process in MFC system depends on the availability of the microorganisms. The substrate, serving as energy source, is one of the major challenges in MFC affecting long-term stability. Several studies discovered the connection between substrate concentration and power generation.55,56 Using two linearization method, Lineweaver–Burk and Eadie–Hofstee, Lorant et al. reported that a decrease in substrate concentration will not affect the decrease in power production, as if the concentration used does not reach the saturation constant limit according to the two-linearization method.6 Henceforth, Ullah et al. demonstrated the higher the substrate concentrations, the higher power generations.54The stability of the MFC with two different electrodes was examined using chronoamperometry conducted in 0.1 M PBS containing glucose and C. fukuyamaensis and was then recorded for 24 hours operation. An applied potential of −0.355 V was performed in accordance with CV measurement for glucose oxidation. Fig. 11 demonstrates the three major phase of C. fukuyamaensis growth in glucose 5 mM. The initial phase occurs when the current response first recorded, namely a lag phase. During this phase, cells were acclimating to the environment and were growing in size. After a short lag phase, there was a significant increase in current response indicating the entry of the logarithmic phase begins around 12 hours’ operation resulted the highest current response reaching 0.07 mA for MBA-AuNPs@CF electrode. However, after 12 h operation, the AuNPs@CF electrode appears to have a longer stationary phase compared to the modified electrode. While –COOH functional groups of MBA facilitates the attachment of C. fukuyamaensis by forming the peptide bond with the N-terminal site of trans-membrane protein, the colonies formation on the MBA-AuNPs@CF would increase rapidly. Consequently, the nutrient demands of growth and reproduction decreases over the time enter a stationary stage, where cell division slows-down and cell population stays constant. Followed by stationary phase with no growth and no nutrient, the cells eventually lead to death.
Conclusions
Modifications of carbon foam electrodes with gold nanoparticles and further functionalisation with 4-MBA have been successfully performed. The functionalisation was proven to facilitate the microorganism colonization on the surface of the electrode, resulting in a better performance of the modified electrodes with the significant increase of the current and the maximum power densities in compared to the unfunctionalized one. Furthermore, better stability was shown, suggested that the modified electrodes can be applied for a real MFC application.Author contributions
A fully performed and analysed the data from experiments as well as the initial draft of the manuscript. MAFN and YMTAP interpreted the data and redesigned the figures. JG and TAI supervised this study, planned the conception of the project, and completed the manuscript. All authors wrote, contributed, and approved the final manuscript.Conflicts of interest
None declared.Acknowledgements
This research is funded by PUTI KI 2020 Universitas Indonesia (Grant No: NKB-777/UN2. RST/HKP.05.00/2020). We also thank Dr Wellyzar Sjamsuridzal and Dr Ariyanti Oetari from the Center of Excellence Indigenous Biological Resources and Genome, Universitas Indonesia who assisted and provided the yeast in this research.References
- S. A. Solarin, Environ. Impact Assess. Rev., 2020, 85, 106443 CrossRef.
- N. Armaroli and V. Balzani, Energy Environ. Sci., 2011, 4, 3193–3222 RSC.
- D. Pant, G. Van Bogaert, L. Diels and K. Vanbroekhoven, Bioresour. Technol., 2010, 101, 1533–1543 CrossRef CAS PubMed.
- M. K. Awasthi, S. Sarsaiya, H. Chen, Q. Wang, M. Wang, S. K. Awasthi, J. Li, T. Liu, A. Pandey and Z. Zhang, in Current Developments in Biotechnology and Bioengineering: Waste Treatment Processes for Energy Generation, 2019, pp. 31–52 Search PubMed.
- B. Thulasinathan, S. Nainamohamed, J. O. Ebenezer Samuel, S. Soorangkattan, J. B. Muthuramalingam, M. Kulanthaisamy, R. Balasubramani, D. D. Nguyen, S. W. Chang, N. Bolan, Y. F. Tsang, L. E. Amabilis-Sosa and A. Alagarsamy, Fuel, 2019, 248, 47–55 CrossRef CAS.
- T. N.-D. Cao, S.-S. Chen, H.-M. Chang, T. X. Bui and I.-C. Chien, Environ. Sci. Water Res. Technol., 2020, 6, 2776–2788 RSC.
- F. Rezaei, D. Xing, R. Wagner, J. M. Regan, T. L. Richard and B. E. Logan, Appl. Environ. Microbiol., 2009, 75, 3673–3678 CrossRef CAS PubMed.
- I. Rahmawati, T. A. Ivandini and E. Saepudin, IOP Conf. Ser.: Mater. Sci. Eng., 2017, 188, 012001 Search PubMed.
- S. G. Barbosa, L. Peixoto, A. Ter Heijne, P. Kuntke, M. M. Alves and M. A. Pereira, Environ. Sci. Water Res. Technol., 2017, 3, 897–904 RSC.
- A. Hafeez and S. Abbas, Green Chem. Lett. Rev., 2020, 13(4), 101–117 Search PubMed.
- M. Zhou, M. Chi, J. Luo, H. He and T. Jin, J. Power Sources, 2011, 196, 4427–4435 CrossRef CAS.
- J. Wei, P. Liang and X. Huang, Bioresour. Technol., 2011, 102, 9335–9344 CrossRef CAS PubMed.
- L. Zhang, W. He, J. Yang, J. Sun, H. Li, B. Han, S. Zhao, Y. Shi, Y. Feng, Z. Tang and S. Liu, Biosens. Bioelectron., 2018, 122, 217–223 CrossRef CAS PubMed.
- K. P. Katuri and K. Scott, Enzyme Microb. Technol., 2011, 48, 351–358 CrossRef CAS PubMed.
- H. Li, N. Xiao, Y. Wang, C. Li, X. Ye, Z. Guo, X. Pan, C. Liu, J. Bai, J. Xiao, X. Zhang, S. Zhao and J. Qiu, J. Mater. Chem. A, 2019, 7, 18852–18860 RSC.
- J. Chen, H. Zheng, J. Kang, F. Yang, Y. Cao and M. Xiang, RSC Adv., 2017, 7, 3035–3042 RSC.
- X. Wu, X. Xiong, G. Owens, G. Brunetti, J. Zhou, X. Yong, X. Xie, L. Zhang, P. Wei and H. Jia, Bioresour. Technol., 2018, 270, 11–19 CrossRef CAS PubMed.
- Fachrurrazie, T. A. Ivandini and W. Wibowo, IOP Conf. Ser.: Mater. Sci. Eng., 2017, 188, 012046 Search PubMed.
- F. Zhang, S. Yu, J. Li, W. Li and H. Yu, Front. Environ. Sci. Eng., 2016, 10, 531–538 CrossRef CAS.
- X. Tang, K. Guo, H. Li, Z. Du and J. Tian, Bioresour. Technol., 2011, 102, 3558–3560 CrossRef CAS PubMed.
- M. Christwardana and Y. Kwon, Bioresour. Technol., 2017, 225, 175–182 CrossRef CAS PubMed.
- E. Sayed and N. Nakagawa, J. Chem. Technol. Bioechnol., 2018, 93, 1588–1594 CrossRef CAS.
- S. V. Raghavulu, R. K. Goud, P. N. Sarma and S. V. Mohan, Bioresour. Technol., 2011, 102, 2751–2757 CrossRef CAS PubMed.
- M. A. Islam, B. Ethiraj, C. K. Cheng, A. Yousuf, S. Thiruvenkadam, R. Prasad and M. M. Rahman Khan, Ind. Eng. Chem. Res., 2018, 57, 813–821 CrossRef CAS.
- M. Verma and V. Mishra, Chemosphere, 2021, 284, 131383 CrossRef CAS PubMed.
- Y. Y. Lee, T. G. Kim and K. S. Cho, Bioresour. Technol., 2015, 192, 556–563 CrossRef CAS PubMed.
- N. D. Haslett, F. J. Rawson, F. Barriëre, G. Kunze, N. Pasco, R. Gooneratne and K. H. R. Baronian, Biosens. Bioelectron., 2011, 26, 3742–3747 CrossRef CAS PubMed.
- T. A. Ivandini, Harmesa, E. Saepudin and Y. Einaga, Anal. Sci., 2015, 31, 643–649 CrossRef CAS PubMed.
- X. Liu, Y. Li, Z. Xing, X. Zhao, N. Liu and F. Chen, New J. Chem., 2017, 41, 15027–15032 RSC.
- T. A. Ivandini, M. S. P. Luhur, M. Khalil and Y. Einaga, Analyst, 2021, 146, 2842–2850 RSC.
- J. Gunlazuardi, A. D. Kurniawan, P. K. Jiwanti, Y. Einaga and T. A. Ivandini, Anal. Methods, 2022, 14, 726–733 RSC.
- A. Sharma, Z. Matharu, G. Sumana, P. R. Solanki, C. G. Kim and B. D. Malhotra, Thin Solid Films, 2010, 519, 1213–1218 CrossRef CAS.
- S. Link and M. A. El-Sayed, J. Phys. Chem. B, 1999, 103, 4212–4217 CrossRef CAS.
- J. P. Oliveira, A. R. Prado, W. J. Keijok, M. R. N. Ribeiro, M. J. Pontes, B. V. Nogueira and M. C. C. Guimarães, Arab. J. Chem., 2020, 13, 216–226 CrossRef CAS.
- M. Yoshimura and K. Byrappa, J. Mater. Sci., 2008, 43(7), 2085–2103 CrossRef CAS.
- C. B. Murray, C. R. Kagan and M. G. Bawendi, Annu. Rev. Mater. Sci., 2000, 30, 545–610 CrossRef CAS.
- F. Xu, H. Lai and H. Xu, Anal. Methods, 2018, 10, 3170–3177 RSC.
- S. Sun, P. Diao, C. Feng, E. M. Ungureanu, Y. Tang, B. Hu and Q. Hu, RSC Adv., 2018, 8, 19776–19785 RSC.
- G. S. Rao, H. Nabipour, P. Zhang, X. Wang, W. Xing, L. Song and Y. Hu, J. Mater. Res. Technol., 2020, 9, 4655–4664 CrossRef CAS.
- S. Krishnamurthy, A. Esterle, N. C. Sharma and S. V. Sahi, Nanoscale Res. Lett., 2014, 9, 1–9 CrossRef CAS PubMed.
- P. Wulandari, T. Nagahiro, N. Fukada, Y. Kimura, M. Niwano and K. Tamada, J. Colloid Interface Sci., 2015, 438, 244–248 CrossRef CAS PubMed.
- Z. Zhang, X. Ye, Q. Liu, Y. Liu and R. Liu, J. Anal. Sci. Technol., 2020, 11, 0–6 Search PubMed.
- H. J. Choi, I. Y. Jeon, D. W. Chang, D. Yu, L. Dai, L. S. Tan and J. B. Baek, J. Phys. Chem. C, 2011, 115, 1746–1751 CrossRef CAS.
- M. Tominaga, T. Shimazoe, M. Nagashima and I. Taniguchi, Electrochem. Commun., 2005, 7, 189–193 CrossRef CAS.
- Z. Kang, K. Jiao, C. Yu, J. Dong, R. Peng, Z. Hu and S. Jiao, RSC Adv., 2017, 7, 4572–4579 RSC.
- B. Li, S. Yun, T. Xing, K. Wang, T. Ke and J. An, Chem. Eng. J., 2021, 425, 130473 CrossRef CAS.
- S. Yun, W. Fang, T. Du, X. Hu, X. Huang, X. Li, C. Zhang and P. D. Lund, Energy, 2018, 164, 898–909 CrossRef CAS.
- Y. Abbas, S. Yun, Z. Wang, Y. Zhang, X. Zhang and K. Wang, Renewable Sustainable Energy Rev., 2021, 135, 110378 CrossRef CAS.
- T. Xing, S. Yun, B. Li, K. Wang, J. Chen, B. Jia, T. Ke and J. An, Bioresour. Technol., 2021, 238, 125520 CrossRef PubMed.
- Z. Wang, S. Yun, H. Xu, C. Wang, Y. Zhang, J. Chen and B. Jia, Bioresour. Technol., 2019, 286, 121394 CrossRef CAS PubMed.
- C. Li and S. Cheng, Crit. Rev. Biotechnol., 2019, 39, 1015–1030 CrossRef CAS PubMed.
- A. E. Bolzán and L. M. Gassa, J. Appl. Electrochem., 2014, 44, 279–292 CrossRef.
- H. Liu and B. Logan, ACS Natl. Meet. Book Abstr., 2004, 228, 4040–4046 Search PubMed.
- K. J. Chae, M. Choi, F. F. Ajayi, W. Park, I. S. Chang and I. S. Kim, Energy Fuels, 2008, 22, 169–176 CrossRef CAS.
- B. Lorant, M. Loka and G. M. Tardy, in IYCE 2015 – Proc. 2015 5th Int. Youth Conf. Energy, 2015, pp. 1–7 Search PubMed.
- Z. Ullah and S. Zeshan, Water Sci. Technol., 2020, 81, 1336–1344 CrossRef PubMed.
Footnote |
| † Electronic supplementary information (ESI) available. See https://doi.org/10.1039/d2ra05100a |
| This journal is © The Royal Society of Chemistry 2022 |

