
 Open Access Article
 This Open Access Article is licensed under a Creative Commons Attribution-Non Commercial 3.0 Unported Licence
Amyloid fibrillation of the glaucoma associated myocilin protein is inhibited by epicatechin gallate (ECG)†
Ritika Sharma a,
Anchala Kumarib,
Bishwajit Kunduc and
Abhinav Grover*a
a,
Anchala Kumarib,
Bishwajit Kunduc and
Abhinav Grover*a
aSchool of Biotechnology, Jawaharlal Nehru University, New Delhi-110067, India. E-mail: sharma.ritika198@gmail.com; abhinavgr@gmail.com; Tel: +91-8130738032
bIndian Council of Medical Research, International Health Division, New Delhi-110029, India. E-mail: anchala.choudhary27@gmail.com
cKusuma School of Biological Sciences, Indian Institute of Technology Delhi, Hauz Khas, New Delhi, India – 110016. E-mail: bkundu@bioschool.iitd.ac.in
First published on 14th October 2022
Abstract
Inherited glaucoma is a recent addition to the inventory of diseases arising due to protein misfolding. Mutations in the olfactomedin (OLF) domain of myocilin are the most common genetic cause behind this disease. Disease associated variants of m-OLF are predisposed to misfold and aggregate in the trabecular meshwork (TM) tissue of the eye. In recent years, the nature of these aggregates was revealed to exhibit the hallmarks of amyloids. Amyloid aggregates are highly stable structures that are formed, often with toxic consequences in a number of debilitating diseases. In spite of its clinical relevance the amyloidogenic nature of m-OLF has not been studied adequately. Here we have studied the amyloid fibrillation of m-OLF and report ECG as an inhibitor against it. Using biophysical and biochemical assays, coupled with advanced microscopic evaluations we show that ECG binds and stabilizes native m-OLF and thus prevents its aggregation into amyloid fibrils. Furthermore, we have used REMD simulations to delineate the stabilizing effects of ECG on the structure of m-OLF. Collectively, we report ECG as a molecular scaffold for designing and testing of novel inhibitors against m-OLF amyloid fibrillation.
1. Introduction
Glaucoma comes only second in line after cataracts as the prominent cause of permanent blindness, worldwide.1 Primary open angle glaucoma (POAG) represents the major form of glaucoma, contributing to nearly 74% of the total disease caseload.2–4 Mutations in the myocilin gene (MYOC) are commonly implicated in occurrences of early onset POAG.5,6 Nearly 5% of all hereditary glaucoma cases arise because of alterations in MYOC, impacting nearly three million people worldwide.4,5,7,8The myocilin protein has a molecular weight of ∼55 kDa and is expressed in several parts of the body but its maximal expression occurs in the trabecular meshwork (TM) tissue of the eye. TM regulates intraocular pressure (IOP) levels.9 Under normal conditions, a fraction of the synthesized myocilin is proteolytically processed within the endoplasmic reticulum (ER), yielding a C-terminal olfactomedin (OLF) domain (∼35 kDa) and a N-terminal CC domain (∼20 kDa).10,11 The OLF domain along with the unprocessed full-length myocilin undergoes cellular secretion, whereas the N-terminal region is retained intracellularly.10,12 It is in the OLF domain where more than 90% of all glaucoma associated alterations occur.5,13,14 Currently, the most widely held view regarding inherited glaucoma is that mutations in myocilin activate a gain-of-function toxic phenotype.10,15–21 Mutations cause structural perturbations in the protein conformation hindering its proteolytic processing and cellular secretion, and as a result mutant myocilin builds up within ER of TM cells.10,12,16,22 This misfolded, aggregated myocilin is unable to be cleared by the ER associated degradation (ERAD) pathway because of its aberrant interactions with the Grp94 chaperone protein.23 The build-up of aggregated myocilin instigates ER stress and death of TM cells22,24,25 which contributes to increased IOP levels mediated visual impairment, and in prolonged cases permanent blindness.26,27 However, it is not just mutations in myocilin that can result in development of different forms of POAG. Overexpression of wild type (WT) myocilin under the influence of steroids is also reported to trigger protein aggregation and increased ER stress in TM cells, contributing to steroid associated glaucoma.28,29 The biological role of myocilin remains unidentified; although its contribution in maintenance of ECM homeostasis in the TM tissue is well perceived. There is also a paucity of information regarding its ligands and interacting partners.27,30,31
Recent studies suggest that the cytotoxicity associated with myocilin aggregation might be a consequence of its amyloidogenic nature. The OLF domain of WT as well as mutant myocilin produces mature amyloid fibrils in in vitro aggregation assays,32–34 and the presence of these amyloid species has also been confirmed using model cell lines.32,35 Protein misfolding and amyloid formation is implicated in several debilitating ailments comprising Alzheimer's disease, Parkinson's disease, Huntington's disease, cataracts and type-II diabetes, to name a few.36 Myocilin associated POAG can thus be considered an inclusion to the expanding catalogue of ailments arising due to protein misfolding.26,35,37
Regulation of IOP levels has remained the primary therapeutic strategy for managing glaucoma patients. Eye drop formulation of drugs that help in reducing the production of AH and/or enhancing its removal are customarily employed to regulate IOP levels.38,39 While traditional therapeutics can manage/delay disease progression in most glaucoma patients, their efficacy is found to be comparatively lower in patients with inherited glaucoma characterized by mutations in myocilin.40 Patients suffering from juvenile open angle glaucoma (JOAG) or early onset POAG have medical requirements that are not catered efficiently by conventional glaucoma treatments.27,35,38 Inherited glaucoma is a major health burden across the world, but can be managed or even prevented with early detection and tailored treatments.11 With the advent of genome wide association studies and polygenic risk score calculations, genetic testing to detect disease associated MYOC variants will become accessible to at risk individuals.41 Likewise, there is a need to develop treatments that can target myocilin directly.
Countering the aggregation and misfolding of myocilin as a therapeutic intervention strategy against glaucoma has recently gained attention.18,42–45 Amongst other approaches that are routinely investigated for developing therapeutics against protein misfolding disorders, is the strategy of utilizing small molecules for maintenance of the native structure of the implicated protein. Preservation of the native protein state can mitigate the progression of misfolding and associated amyloidogenesis.37,46–52
Despite the clinical relevance of myocilin, only limited studies have been performed to inspect the aggregation nature of this protein. Production of recombinant myocilin in amounts enough for carrying out in vitro aggregation assays is a likely hindrance.42 Likewise, there are very few reports where binding partners (particularly small molecules) have been discovered and tested for their efficacy against the amyloid aggregation of m-OLF (myocilin OLF domain). Apigenin and GW5074 are two such compounds that were identified as ligands for m-OLF using a biochemical binding assay; and have displayed successful anti-amyloid activity against m-OLF in vitro.52 In recent years, with the availability of the crystal structure for m-OLF, in silico screenings of small molecules ligands of m-OLF have also been ensued.53,54
In this study, we describe a new mode for recombinant production of natively folded WT m-OLF and explore the amyloid aggregation properties of this protein. By coupling experimental and computational results, we have identified the green tea polyphenol – epicatechin gallate (ECG) as a ligand for m-OLF that can avert its aggregation into amyloid fibrils. Collectively, the current study provides further support for the amyloidogenic nature of myocilin and presents ECG as a likely structural candidate for future drug discovery studies against myocilin associated glaucoma.
2. Results and discussion
2.1 Cloning, expression, purification and refolding of m-OLF
The OLF domain of myocilin (residues 244–504) was cloned into the pET28a(+) expression vector and confirmed via sequencing. As the coding sequence of MYOC gene contains a significant proportion of rare codons, hence the Rosetta-gami 2(DE3) pLysS strain of E. coli that helps in overcoming codon bias was used for expressing the protein. The m-OLF protein expression was maximal at 2 hours, post induction. Similar to previous studies we found the myocilin protein to be expressed only in the form of inclusion bodies.55,56 There are very few reports where m-OLF has been recovered from inclusion bodies and successfully refolded back to its native state.55 Using an arrangement of methods, we were able to achieve this feat resourcefully. The His-tagged, m-OLF protein was first purified through nickel affinity chromatography under denaturing conditions followed by its dilution in refolding buffer that assisted in correct disulphide bond formation and folding. The principal components of the refolding buffer were arginine and a combination of reduced (GSH) and oxidized (GSSG) glutathione. Arginine is widely used as an additive during the in vitro refolding of proteins as its effective in subduing protein aggregation which competes with process of protein refolding.57 A redox combination of GSH/GSSG is also routinely employed in in vitro protein refolding experiments as it facilitates a controlled oxidizing environment in which the formation of native disulfide bonds can proceed accurately.58,59 The refolded protein was assessed by Size Exclusion Chromatography (SEC), Circular Dichroism (CD) spectroscopy and Dynamic Light Scattering (DLS) to confirm its folded state [ESI Fig. S1†]. The SEC as well as the DLS profile verified the purity and homogeneity of the recovered protein. Likewise, CD spectroscopy scans in the near and far-UV range affirmed the intactness of the tertiary and secondary structural elements respectively. The obtained CD spectra correlated well with the previously reported CD spectral profiles for natively folded m-OLF in the near and far UV regions.33,60 The far-UV CD signature was composed of a broad minimum ∼215 nm and an additional 230 nm shoulder, while the near-UV CD spectra exhibited close double troughs at 284 nm and 292 nm. We were able to purify ∼3 mg of pure recombinant human m-OLF protein from 1 L of harvested bacterial culture.2.2 Binding interaction of the heteromolecular association of ECG with m-OLF
From the initial screening of the Sigma phytocompound library, only those compounds that displayed docking scores greater than −6 kcal mol−1 were further inspected using the XP docking protocol. ECG was thus obtained as one of the top three scoring hits [Table 1]. However, since the inhibitory potential of catechins against amyloid aggregation of several amyloidogenic proteins/peptides is well established in literature,61–70 we decided to proceed further with ECG in our study and evaluate its potency against m-OLF amyloid aggregation. Visualization of the likely protein–ligand interactions was enabled by LigPlot+ in 2D details.71 Likewise, the conformational view of the binding interaction was pictured using Chimera.72 ECG was found to occupy the surface groove in the m-OLF structure as depicted in Fig. 1A. The binding between ECG and m-OLF was found to be stabilized by several hydrophobic interactions involving the protein residues Tyr267, Thr290, Gly292, Thr293, Leu322, Glu323, Thr325, Ala339, Glu340, His 366, Gly375 and Tyr376. Also, a single hydrogen bond is formed between m-OLF's Ser324 and ECG that provided additional stability to the complex [Fig. 1B and C]. The B10–C11 loop comprising residues 360–379, is the largest unstructured region in the m-OLF structure and has been characterized as a destabilizing site previously.30 ECG binds to three amino acid residues in this loop namely His366, Gly375, and Tyr 376; which can prevent structural perturbations from ensuing in this region and hence confer the protein with stability. Additionally, ECG interacting m-OLF residues Leu322, Glu323, Ser324, Thr325, Ala339 and Glu340, closely flank one of the previously identified amyloid forming cores of m-OLF specifically, G326AVVYSGSLYFQ337.33,73 Under destabilizing conditions, interactions between these critical amino acid residues and ECG could avert the exposure of m-OLF amyloidogenic, hydrophobic core and thus strengthen the native monomeric protein conformation.74| Parameter | Value |
|---|---|
| Ligand molecular weight | 442.37 g mol−1 |
| Glide docking score | −7.54 kcal mol−1 |
| Glide energy | −31.249 kcal mol−1 |
 | ||
| Fig. 1 Evaluation of the binding interactions through molecular docking and SPR. (A) Representation of the m-OLF + ECG docked complex with the ligand occupying the surface groove of the m-OLF structure. Zoomed representation of the binding interactions that stabilize m-OLF + ECG complex in 3D (B) and 2D details (C). (D) Real time binding affinity measurements of ECG using SPR, represented as sensorgrams obtained on injecting ECG at different concentrations over a CM5 chip immobilized with m-OLF. | ||
Additional support for the likely binding between ECG and m-OLF was achieved by performing Surface Plasmon Resonance (SPR) experiments. This also enabled in determining the kinetic parameters governing the interaction between these two biomolecules. The dose–response sensorgrams obtained during this study indicated the existence of a favourable binding pocket for ECG in the native m-OLF structure. Initially, binding association (kon) and dissociation rate constants (koff) were derived using the Langmuir global fitting model. Furthermore, on observing the sensorgrams curves and the quantitative values obtained for kon and koff, it is evident that ECG exhibits a faster rate of association to m-OLF but its rate of dissociation is considerably slow and incomplete [Fig. 1C]. The dissociation constant (KD) for m-OLF–ECG interaction was derived on fitting the obtained affinity curve and was found to have a value of 19.8 μM, which is indicative of a decent affinity between the protein and ligand molecules [ESI Fig. S2†]. Evidently, the active hydroxyl group bearing ring structure of ECG help in anchoring it into the functional clefts of m-OLF, generating a stable hetero-molecular complex.
2.3 ECG inhibits the amyloid aggregation of m-OLF
After validating the interaction between m-OLF and ECG, we proceeded to test the effect of ECG on the amyloid aggregation of m-OLF. ThT binding assay is routinely used to examine the aggregation of amyloidogenic proteins/peptides. ThT binding to amyloid fibrils exhibits an increased fluorescence value which is directly proportional to the amount of fibrillar load.75 The plotted ThT kinetics data was fitted using the following equation to a sigmoidal model as described previously.76,77
In this equation, Y represents the fluorescence intensity, x is time in hours, t50 is the time at which the attained ThT fluorescence is half of the maximum recorded intensity and τ is the time constant. Accordingly, the apparent rate constant (kapp) and lag time calculations are made using the expressions 1/τ and t50 − 2τ respectively [Table S1†].
The kinetics of m-OLF aggregation exhibited a sigmoidal trend, with a lag phase of ∼20 hours which is succeeded by an exponential growth phase and a final saturation phase where ThT fluorescence values remain constant [Fig. 2]. The presence of ECG decreased the aggregation of m-OLF into amyloid aggregates; significantly lower fluorescence values were observed for m-OLF samples that were incubated with ECG. Furthermore, the decrease in the level of fluorescence values was proportional to the concentration of ECG tested. At the highest tested concentration of ECG (75 μM) we observed ∼65% reduction in the value of maximal ThT fluorescence and an increase in the lag time of m-OLF fibrillation by ∼9 h. The increased lag phase in the presence of ECG insinuated that ECG impacted the primary nucleation stage of the fibrillation pathway.
 | ||
| Fig. 2 Effect of ECG on the kinetics of m-OLF fibrillation. Variation in the levels of ThT fluorescence plotted as a function of time, depicting the fibrillation of m-OLF alone (red traces) and in the presence of increasing concentrations of ECG (blue and green traces). The kinetics of m-OLF aggregation exhibits a sigmoidal transition and a dose-dependent decline in the levels of ThT fluorescence is observed for m-OLF in the presence of ECG. | ||
It is possible that effects other than stabilization of the native protein structure may operate in providing an overall protection against amyloid fibrillation. Catechins are reported to bind the oligomers formed by amyloid-beta (Aβ) and various other amyloidogenic polypeptides such as α-synuclein, tau, and islet amyloid polypeptide (IAPP) and remodel them into off-pathway aggregates.62,66,78–80 It is plausible that the inhibitory effect of ECG on m-OLF fibrillation may also stem from such alternative properties.
Additionally, catechins have been reported to compete with ThT for binding to amyloid fibrils.81 Therefore, to ascertain if the observed decrease in ThT fluorescence is indeed due to subjugation of m-OLF amyloid fibrillation in the presence of ECG, we verified our results by using other complimentary techniques such as microscopic evaluations and anilino-8-naphthalenesulfonate (ANS) assay.
2.4 Morphological examination of aggregates
The resulting aggregates formed were inspected for their morphological and structural characteristics using transmission electron microscopy (TEM) and atomic force microscopy (AFM) [Fig. 3]. On visualization using TEM m-OLF amyloid aggregates appeared as negatively stained, twisted, rope-like and unbranched fibers having a diameter of ≈16 nm. However, in case of ECG treated m-OLF samples mostly amorphous aggregates were observed with scarce and small sized fibrils. The morphological characters of m-OLF aggregates formed in the presence/absence of ECG as studied by TEM also corroborated with the results obtained by AFM. Microscopic evaluations on ECG treated samples were performed using samples from its highest tested concentration (75 μM). The dimensions of the aggregates observed for ECG treated m-OLF samples were significantly lower in proportion to the control (m-OLF alone) aggregation samples. | ||
| Fig. 3 Morphological characterization of the m-OLF aggregates formed in the presence and absence of ECG. Negatively stained amyloid fibrils formed by m-OLF in the absence of ECG as observed using TEM (A) and AFM (B; where arrows in white pinpoint the straight fibrils). Amorphous aggregates formed by m-OLF samples in the presence of ECG as visualized using TEM (C) and AFM (D). Scale bars represent 100 nm and 1 μM for TEM and AFM images respectively. Colour bars in (B) and (D) provide a gradation for the height of the observed aggregates, structures in bright yellow have the maximum height. | ||
2.5 Aggregation induced secondary structural variations in m-OLF
For visualizing the secondary structural changes associated with the amyloid fibrillation of m-OLF, far-UV CD spectroscopic evaluation of native and aggregated m-OLF samples was carried [Fig. 4A]. Native m-OLF exhibits prevalence of a β-sheet secondary structure with a broad minimum centred at ∼215 nm. The far-UV CD spectral profile of aggregated m-OLF differed from that of native m-OLF considerably. A reduction in the absorption minimum at ∼215 nm and its slight shift towards 220 nm was evident for aggregated m-OLF, without ECG. The far-UV CD spectra of aggregates formed by m-OLF in the presence of ECG although exhibited an appreciable decline of CD signal at ∼215 nm but its overall profile displayed a greater resemblance to the spectra of native m-OLF [Table S2†]. Thus, the interaction between m-OLF and ECG stabilizes the protein's secondary structural features while preventing its aggregation into non-native forms. | ||
| Fig. 4 Secondary structural changes and hydrophobicity assessment of the aggregates formed by m-OLF. (A) Far UV CD spectra for aggregated m-OLF in the absence and presence of ECG exhibited a decrease in the CD signal at 215 nm, and a slight shift of the spectral minimum towards 220 nm was observed for m-OLF in the absence of ECG. (B) ECG binding results in formation of m-OLF aggregates with reduced surface hydrophobicity. | ||
2.6 ECG modulates m-OLF surface hydrophobicity
ANS binding assay is widely utilized for assessing the exposure of a protein's hydrophobic surface patches to the surrounding solvent molecules as well as to characterize protein folding intermediates and molten globules.82,83 Local unfolding of a protein exposes hydrophobic patches that can trigger aberrant intermolecular interactions between protein molecules and lead to aggregation.84 Native m-OLF exhibits negligible ANS fluorescence as is expected for a well folded protein. In contrast, aggregated m-OLF exhibited increased levels of ANS fluorescence with the characteristic blue shift in its emission maximum which is indicative of increased m-OLF surface hydrophobicity [Fig. 4B]. However, ECG treated m-OLF aggregates were found to have much lower levels of ANS fluorescence and exhibited no blue shift in its emission maximum. Thus, the results of ANS assay are indicative of the stabilizing effect ECG binding has on the structure of m-OLF. Apparently, ECG binding subdues the exposed hydrophobic surfaces of m-OLF, further preventing the interaction of misfolded aggregating monomers, consequently inhibiting its amyloid fibrillation.2.7 ECG controls the conformational transitions of m-OLF into non-native states
The above results suggested that the heteromolecular interaction between ECG and m-OLF preserves the structural integrity of m-OLF. It has been previously proposed that in vitro amyloid fibrillation of m-OLF proceeds from its partially folded states that can be accessed at elevated temperatures, acidic conditions and also via agitation under physiological settings.32 To gain further insights into the mechanistic effect that ECG can have on the conformational alterations occurring in m-OLF that can predispose it towards an amyloid forming competent state, we performed all atomistic replica exchange molecular dynamics (REMD) simulations. Standard MD simulations are not well suited to understand the unfolding of large globular proteins such as m-OLF because of their limited sampling of major conformational states.85–87 REMD simulations can overcome these issues by simultaneously running numerous simulations for alike systems (replicas) at a wide range of temperature, wherein at every few stages, the temperatures are indiscriminately replaced amongst these replicas. This process assists in overcoming energy barriers and the resulting trajectories explore the conformational space in contrast to normal MD simulations.85Initial analysis focused on inspecting the changes observed in secondary structural elements for m-OLF alone, in comparison to m-OLF docked with ECG [Fig. 5]. To achieve this, root mean square deviation (RMSD) and root mean square fluctuation (RMSF) was assessed for the two systems. The complex of m-OLF and ECG exhibited lower RMSD values as compared to the m-OLF alone system. Around ∼60 ns there was an increase in the RMSD values for the m-OLF + ECG complex but the trajectory stabilized before the simulation ended [Fig. 5A]. Decline in the average RMSD values for both the systems towards the end of the simulation indicated that the simulation had achieved convergence and the individual trajectories were suitable for carrying out further analysis. Following this, RMSF values were computed and compared for both the systems. It was observed that m-OLF exhibited almost similar RMSF values in the presence as well as absence of ECG. Amino acid residues found at positions 280, 310–325, 370–375, 420–428 and 458 showed lower fluctuations in the m-OLF + ECG complex, while those present at locations 355–358, 379, 390, 405–420, 460–485 exhibited slightly increased RMSF values when compared to m-OLF alone [Fig. 5B]. Overall, it was observed that amino acid residues that interact with ECG exhibited lower RMSF values when compared to the non-bound residues. In sum, the overall RMSD and RMSF profiles of both the systems for the stipulated simulation time, did not exhibit large deviations from the initial structure which is indicative of the structural stability of WT m-OLF. Furthermore, other structural parameters such as radius of gyration (Rg), solvent accessible surface area (SASA) and H bond numbers were compared for both the systems. The m-OLF + ECG complex exhibited little difference in the Rg values in comparison to the m-OLF alone system [Fig. 5C]. However, an increase in the values of SASA [Fig. 5D] and protein–solvent H bonds [Fig. 5E] was observed for the m-OLF alone system. Correspondingly, the number of intramolecular protein H bonds was found to be well conserved in case of the m-OLF + ECG complex but had decreased slightly in case of the m-OLF alone system [ESI Fig. S3A†]. Preservation of local H bonds within the protein is suggestive of a stable structure, while an increasing interaction with the solvent molecules is characteristic of protein unfolding.88 These results suggested that ECG had a stabilizing effect on the protein structure and resulted in overall protein compaction. Additionally, hydrogen bonding analysis also affirmed that the heteromolecular H bonding interaction between m-OLF and ECG was well sustained during the course of the simulation, implying a stable interaction between the two [ESI Fig. S3B†].
 | ||
| Fig. 5 Evaluation of the REMD simulation trajectories for studying conformational variations. (A) Backbone RMSD variations of m-OLF alone (red traces) and m-OLF + ECG complex (green traces) during the complete simulation. (B) Computed RMSF depicting the structural fluctuations by each amino acid residue for the stable time frame. Probability distribution plots of Rg (C), SASA (D) and protein–solvent contacts (E) compared for both the systems. | ||
Subsequently, population density analysis was performed to assess the distribution of conformations sampled during the course of the entire REMD simulation. The global structural parameters – Rg and RMSD were used as functions to accomplish the same. Most conformations sampled for the m-OLF + ECG system had lower RMSD values centred around 0.22 nm [ESI Fig. S4†] and thus were closer to the initial native structure of m-OLF. In contrast, the conformational area for m-OLF system had digressed with the most populated configuration states exhibiting comparatively higher RMSD values, clustered around 0.28 nm. Consequently, 2D and 3D free energy landscapes (FELs) for both the systems were assembled and projected against the same two parameters [Fig. 6]. A 3D FEL illustrates protein stability on the basis of the appearance and dimension of the folding funnel with a global energy minimum; it helps envision the conformational landscape accessible to the protein in the ensemble of trajectories.89,90 A more converged orange region in the FEL is an indicator of higher stability for the protein. As observed in the 2D free energy plots of Fig. 6, most of the conformations sampled had lower free energy values for both the systems. Thus, m-OLF retained an overall folded conformation both in the presence and absence of ECG in the stipulated simulation time. However, the population density of the sampled low energy conformations was found to be significantly reduced in case of m-OLF alone system when compared to the m-OLF + ECG system. The 3D FEL plots exhibited a single energy minimum for both the systems, but with a slightly wider basin in case of m-OLF alone. These results suggest that interaction with ECG provides considerable stability to the m-OLF structure and prevents its unfolding into non-native forms.
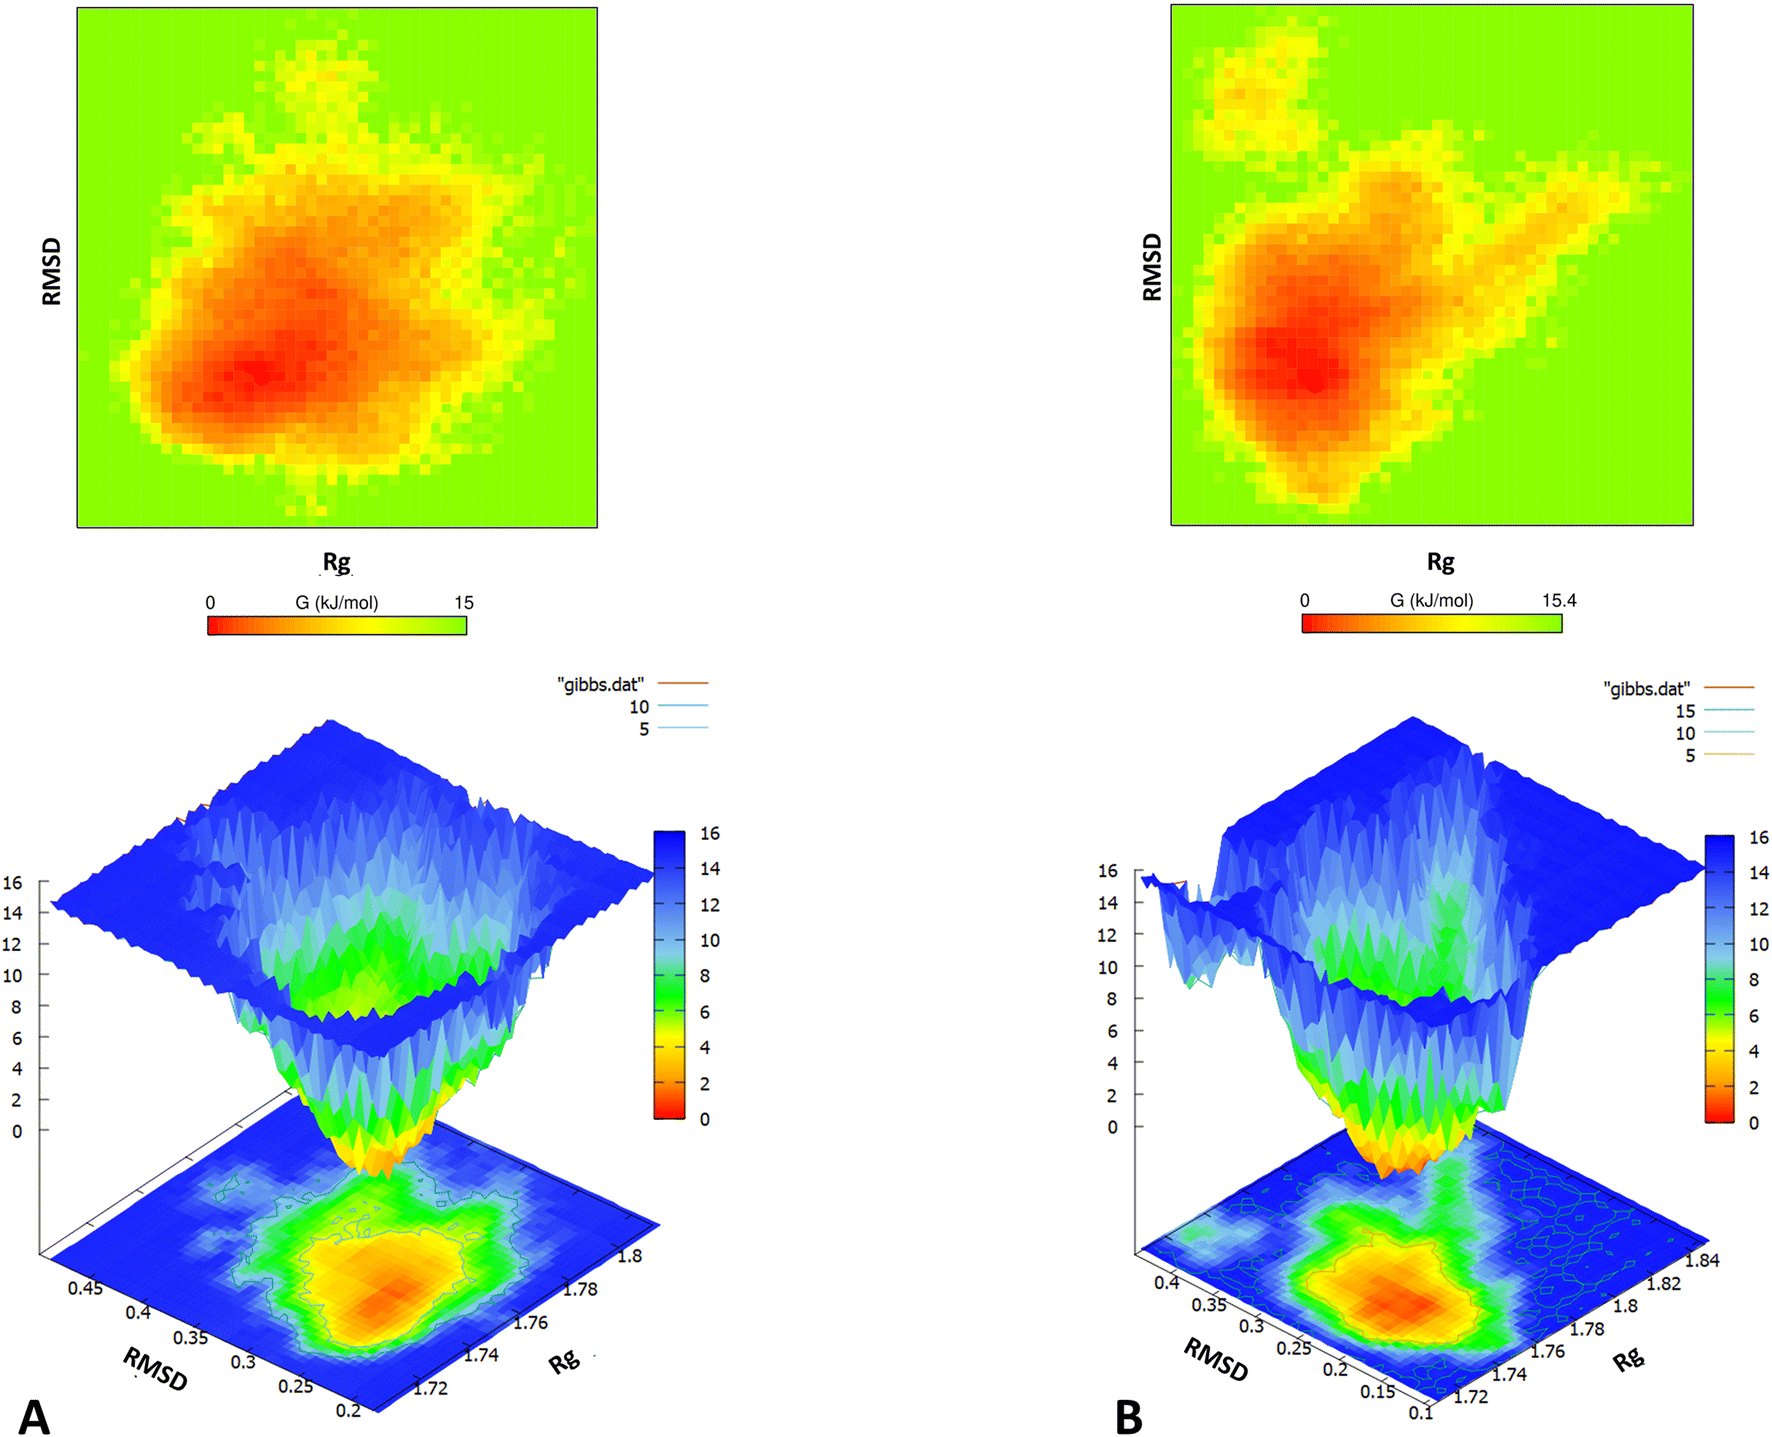 | ||
| Fig. 6 Free energy landscape of m-OLF. 2D and 3D Gibbs free energy landscapes (kcal mol−1) of m-OLF projected as a function of the backbone Rg and RMSD values in the absence (A) and presence of ECG (B). | ||
The structural changes that occurred in m-OLF in the presence/absence of ECG were compared at the end of the simulation. The same are represented in Fig. 7, where the end-point structures for both the systems have been compared to the native m-OLF structure (PDB id: 4WXQ) [Fig. 7A]. Though no major structural loss has ensued in the β sheet core of both m-OLF alone and m-OLF + ECG systems, the side helix which is a part of the A blade in m-OLF β-propeller structure is completely unwound in the system where m-OLF was simulated alone [Fig. 7B]. However, in case of the m-OLF + ECG docked complex system the side helix is still intact [Fig. 7C and D] and the protein retains its overall conformation. The unfolding of the side helix has been previously reported as one of the first steps in the unfolding of m-OLF, but the generated conformation was inferred to be distinct from the molten globule form of m-OLF from which amyloid aggregation proceeds.91 Studying the unfolding transitions for a considerably large and stable globular protein domain such as m-OLF is expected to be challenging using conventional computational methods. Simulation times have to be sufficiently large to access all protein conformations at partially unfolded states.87
 | ||
| Fig. 7 Comparison of the structural variation in m-OLF protein at the end of the simulation. (A) Native structure of the monomeric m-OLF domain, which comprises of a β propeller structure having five blades numbered A–E. Each blade is composed of four antiparallel β sheets which are joined by intermediate loops with two helical turns and a short α-helix in between the outer strands of the A blade. (B) Structure of m-OLF when simulated alone for 100 ns, the arrow highlights an unfolded α-helix. (C) m-OLF simulated in the presence of ECG with the side helix intact at the end of the simulation. (D) Surface representation of the docked complex of m-OLF + ECG at the end of the simulation. | ||
3. Conclusion
The present study describes the modulatory effects of ECG in countering the amyloid fibrillation of WT m-OLF. This was achieved using biophysical and in silico studies. We also report an efficient method of producing native m-OLF recombinantly, in amounts that are necessary to carry out biophysical studies. Our results suggest that ECG prevents the fibrillation of m-OLF via binding to the native protein and bestowing relative stabilization to its structure, which prevents amyloidogenic structural transitions from happening. In future the effects of ECG on the disease associated variants of m-OLF can be tested via biophysical and cellular secretion assays to affirm its therapeutic potential in delivering targeted treatments for patients with inherited glaucoma. Moreover, ECG can be used as a structural template to design and test additional inhibitors against m-OLF amyloid aggregation.4. Materials and methods
4.1 Cloning of the human myocilin OLF domain
The OLF domain of the human MYOC gene (m-OLF) was amplified using gene specific primers from pMYOCWT-EGFP plasmid, available from Addgene (Repository #39326). The amplified DNA was annealed into the pET28a(+) expression vector (Novagen), and the subsequent construct DNA was sequenced to confirm the success of cloning.4.2 Protein expression and purification
The plasmid DNA (pET28a + mOLF) was transformed into Rosetta-gami 2(DE3) pLysS (Novagen) cells and cultivated in LB-Broth till the optical density at 600 nm reached ∼0.7. Following this the cells were induced with 0.5 mM isopropyl β-D-thiogalactopyranoside (IPTG) for 2 hours at a temperature of 37 °C. The cells were then collected via centrifugation and stored at −80 °C until further processing.The bacterial cell pellet was suspended in lysis buffer (100 mM NaH2PO4, 10 mM Tris, 200 mM NaCl, 8 M urea, 10 mM imidazole, 10 mM reduced glutathione, 1 mM EDTA), pH 7.4. The cell suspension was then subjected to sonication at 4 °C, following which the cell lysate was centrifuged at 15000g for 20 minutes at 4 °C to remove insoluble particulates. The cleared lysate was then allowed to flow over Ni-NTA matrix (Qiagen, Germany) pre-equilibrated with the lysis buffer in a gravity flow column. Following this the Ni-NTA matrix was washed twice with Wash buffer (100 mM NaH2PO4, 10 mM Tris, 200 mM NaCl, 8 M urea, 25 mM imidazole, 10 mM reduced glutathione, 1 mM EDTA), pH 7.4. Finally, the purified protein was collected after washing the column in elution buffer (100 mM NaH2PO4, 10 mM Tris, 200 mM NaCl, 8 M urea, 100 mM imidazole, 10 mM reduced glutathione, 1 mM EDTA), pH 7.4. The purified protein was diluted 10 times into the refolding buffer (100 mM NaH2PO4, 10 mM Tris, 200 mM NaCl, 0.5 M L-arginine HCl, 25 mM imidazole, 1 mM reduced glutathione, 0.1 mM oxidized glutathione, and 1 mM EDTA), pH 7.4 and left overnight at 4 °C.
The refolded, diluted protein was dialyzed against dialysis buffer (10 mM sodium phosphate, 200 mM NaCl, 1 mM EDTA and 1% glycine), pH 7.2. After dialysis the diluted protein was filtered using a 0.22 μm filter and then concentrated using an Amicon® Stirred Cell (Merck). The concentrated protein was loaded on a Superdex 75 prep grade column (Cytiva) equilibrated with reaction buffer (10 mM Na phosphate, 200 mM NaCl, and 1 mM EDTA), pH 7.2 and monomeric m-OLF was finally recovered. The protein was immediately used or stored at −80 °C until further processing.
4.3 DLS
Light scattering for the refolded m-OLF (0.5 mg mL−1, in reaction buffer) was inspected using an Xtal-Spectrosize-300 instrument (Xtal Concepts, Germany). An average of 10 scans was performed and the obtained mass histograms were plotted using the OriginPro 8.5.4.4 High throughput virtual screening (HTVS) for identifying m-OLF ligands
HTVS was used to identify plausible binding partners for m-OLF, the sigma phytocompounds drug library was screened using GLIDE,92 a module of Schrodinger. The X-ray crystal structure of Human Myocilin OLF protein (PDB id: 4WXQ) was obtained from the RCSB-Protein Data Bank.93 The active site of the protein was identified using the CASTp server https://sts.bioe.uic.edu/castp/.94 The protein was further pre-processed and optimized using the protein preparation wizard of the Schrodinger suite. A receptor grid was generated by exploiting the centroid of the detected active site residues. The LigPrep module95 of Schrodinger was used for preparing the Sigma phytocompound library. The two-step docking approach was employed wherein HTVS is proceeded by extra precision (XP) docking.4.5 Amyloid aggregation kinetic assay
Purified protein stored at −80 °C (from multiple batches of purification) was allowed to thaw on ice, following which it was pooled. The pooled protein was concentrated using Amicon® ultra centrifugal filters (Merck) and then subjected to SEC as described before (section 4.2). Only the monomeric protein fraction obtained using SEC was quantified using bicinchoninic acid (BCA) assay and utilized for setting up the amyloid aggregation assay. Monomeric m-OLF at a concentration of 0.5 mg mL−1 (15 μM) in reaction buffer was taken in 1.5 mL micro-centrifuge vials with/without the presence of ECG (Cayman Chemical) and incubated at 37 °C with a steady agitation rate of 200 rpm. The experiment was performed in triplicates, all reaction vials were sampled at regular intervals by aliquoting 10 μL of the reaction mix and diluting it with 90 μL of Thioflavin T (ThT) prepared in the same buffer. ThT was employed at a final dilution of 10 μM; fluorescence emission values were documented at 485 nm of wavelength following excitation at a wavelength of 450 nm in SpectraMax® M2e multimode plate reader (Molecular Devices), using a 1 cm path length quartz cuvette. OriginPro 8.5 was used for plotting and fitting the data, sigmoidal fit for the scatter points was obtained by utilizing the curve fitting Boltzmann function.4.6 TEM
After completion of the kinetic assay, 15 μL of aggregation product was adsorbed on carbon shielded copper mesh grids (Agar Scientific Formvar 300 mesh) for 2 minutes. The grids were subsequently stained using uranyl acetate for 1 minute. Excess stain was removed by rinsing with de-ionized water for 10 seconds, the grids were left for overnight drying. Visualization of the grids was performed with JEM-2100F (JEOL, USA) transmission electron microscope running at an accelerating voltage of 200 kV.4.7 AFM
Surface topography of the aggregates was inspected using a WITec alpha 300 atomic force microscope (WITec GmbH, Germany). Aggregated protein samples (20 μL) were allowed to absorb on freshly cleaved mica discs for 30 minutes, following which the mica discs were rinsed with de-ionised water and left undisturbed for overnight drying. The mica discs were scanned in ambient conditions using intermitted contact mode and a NSG30-TipsNano probe; with 256 points per line 256 lines per image and a standard scan rate of 0.5 Hz.4.8 SPR binding and kinetic analysis
To determine the kinetic parameters of the interaction between ECG and m-OLF, SPR tests were completed using a BIAcore X100 machine (Cytiva), as described before.52 Briefly, a CM5 sensor chip (Cytiva) was activated using an equimolar combination of EDC [N-ethyl-N-(diethylaminopropyl)carbodiimide] and NHS (N-hydroxy succinimide). For immobilization, the protein was freshly diluted from a main stock (3 mg mL−1, prepared in PBS) into the immobilization buffer (sodium acetate buffer, pH 4.5) at a working concentration of 50 μg mL−1. One of the flow cells was used for blank corrections, on which blocking was performed using ethanolamine as per the standard manufacturer operating protocol. A binding level response of ∼3700 resonance units (RU) was accomplished for m-OLF. PBS was used as running buffer during binding and kinetics experiments and the system was primed twice before each run, with a flow rate of 30 μL per minute. Values of the dissociation constant were calculated by means of the BIA evaluation 4.1 software (BIAcore), affinity and kinetic analysis. The Langmuir isotherm model was employed for data fitting.4.9 Far and near UV CD spectroscopy
CD spectra were recorded using a J-815 Spectropolarimeter (Jasco, Tokyo, Japan). Near and far-UV spectra for native m-OLF were obtained at a final protein concentration of 0.5 mg mL−1 in reaction buffer. Far-UV CD spectra for aggregated m-OLF was inspected by directly utilizing the samples obtained at the end of aggregation kinetics assay – m-OLF in the absence and presence of ECG (1![[thin space (1/6-em)]](https://www.rsc.org/images/entities/char_2009.gif) :5). All spectral measurements were obtained at room temperature at a data pitch of 1 nm and a scanning rate of 50 nm min−1 for near UV and 100 nm min−1 for far UV. A quartz cuvette with a path length of 1 cm was used for near UV measurements whereas a 0.1 cm quartz cuvette was used for far UV scans. The scans were conducted in triplicates and the averaged data was plotted in units of mean residue ellipticity. The percentage of different secondary structural elements in the far UV CD spectra was calculated using the BeStSel tool.96
:5). All spectral measurements were obtained at room temperature at a data pitch of 1 nm and a scanning rate of 50 nm min−1 for near UV and 100 nm min−1 for far UV. A quartz cuvette with a path length of 1 cm was used for near UV measurements whereas a 0.1 cm quartz cuvette was used for far UV scans. The scans were conducted in triplicates and the averaged data was plotted in units of mean residue ellipticity. The percentage of different secondary structural elements in the far UV CD spectra was calculated using the BeStSel tool.96
4.10 ANS binding assay
ANS binding assay was used for evaluating the hydrophobicity of m-OLF aggregates. The control (m-OLF alone) and treated (m-OLF + ECG) aggregation samples were diluted to a final protein concentration of 10 μM in reaction buffer, supplemented with 100 μM of ANS (diluted from a main stock of 10 mM ANS, prepared in deionised water). After incubation for 5 minutes at 25 °C and using an excitation wavelength of 380 nm, the emitted fluorescence was recorded between 400 and 600 nm. A SpectraMax® M2e multimode plate reader (Molecular Devices), and 1 cm path length quartz cuvette was used for obtaining the measurements.4.11 REMD simulations
The protein preparation wizard module of Schrödinger was used to prepare m-OLF structure (PDB 4WXQ) for running atomistic REMD simulations. Also, the heteroatoms like poly ethylene glycol (PEG), calcium and sodium present in the PDB structure of m-OLF were removed beforehand. The 3D structure of ECG was downloaded in SDF format from PubChem.97 Further, PRODRG98 was used to generate the coordinates and topology files of ECG compatible to GROMACS.99 After obtaining the prepared structures of both m-OLF and ECG, the simulation box was created keeping the protein in the center of the box of diameter 1.5 nm and shape of the box to be cubic. Leapfrog integrator algorithm was used to incorporate Newton's equation of motion with a time step of 2 fs.100 Both long- and short-range electrostatics were inferred along with particle-mesh Ewald algorithm and van der Waals interactions.101 In order to minimize the barriers of the REMD simulations, fast Fourier transform algorithm was also included. The system size effect was enhanced by applying periodic boundary conditions and the m-OLF topologies were developed by applying GROMOS96 force field. The simple point charge (SPC)102 water model was used as solvent and the charges of m-OLF were neutralized by addition of charged ions.The NPT equilibrations were performed on the two REMD simulation systems (m-OLF and m-OLF + ECG) in order to attain an isotropic condition (1 bar pressure and 300 K temperature) i.e., constant pressure and temperature along with constant number of atoms. Barostat and Berendsen weak coupling thermostat103 were applied to achieve equilibrated box dimensions at a compressibility of 4.5 × 10⁻⁵ bar−1. Also, Nose–Hoover thermostat104 was used to employ NVT equilibrations at constant volume and temperature along with a constant number of atoms. A precise thermodynamics conformational ensemble was achieved by an advanced Hamiltonian jointed superficially with the heat-bath. The linear constraint solver algorithm (LINCS) along with the SETTLE algorithm105 was used to constrain both protein and water bonds separately. Symplectic integrator and Lagrange multipliers were used in both LINCS and SETTLE algorithms to constrain the chemical bonds.
Under above conditions, the advanced REMD simulations were implemented to enhance conformational sampling of m-OLF and m-OLF + ECG simulation systems. Various replicas at different temperature (290–500 K) were executed with marginally different ensembles, switching the replica coordinates among the different ensembles intermittently. The exponential spacing law was used in recent studies for the temperature selection and distribution to perform REMD simulations.106 One of the web-server named, REMD Temperature Generator https://virtualchemistry.org/remd-temperature-generator/107 was also used in the previous studies.86 The same web-server was implemented in our study for selection and distribution of temperatures in REMD simulations. A total of 32 replicas were used for each system with an average exchange probability of 20% within replicas in every 2 ps. The m-OLF and m-OLF + ECG systems were simulated for 100 ns per replica and the REMD analysis was achieved on the final trajectories at 351 K.
Author contributions
BK, AG and RS conceptualized and visualized the whole study. RS designed, conducted and analyzed the experimental studies. AK performed and analyzed the computational experiments. RS and AK wrote the manuscript. BK and AG managed resources and reviewed the manuscript. All authors read and approved the manuscript.Conflicts of interest
The authors declare that they have no known competing interests.Acknowledgements
RS is thankful to Indian Council of Medical Research (ICMR), India for the Senior Research Fellowship. AG is thankful to University Grant Commission, India for the faculty Recharge position. RS is grateful to Dr Nikita Admane for technical discussions.References
- M. T. Leite, L. M. Sakata and F. A. Medeiros, Arquivos Brasileiros de Oftalmologia, 2011, 74, 83–84 CrossRef PubMed.
- H. A. Quigley and A. T. Broman, Br. J. Ophthalmol., 2006, 90, 262–267 CrossRef CAS PubMed.
- Y.-C. Tham, X. Li, T. Y. Wong, H. A. Quigley, T. Aung and C.-Y. Cheng, Ophthalmology, 2014, 121, 2081–2090 CrossRef PubMed.
- V. V. Kapetanakis, M. P. Y. Chan, P. J. Foster, D. G. Cook, C. G. Owen and A. R. Rudnicka, Br. J. Ophthalmol., 2016, 100, 86–93 CrossRef PubMed.
- J. H. Fingert, E. Héon, J. M. Liebmann, T. Yamamoto, J. E. Craig, J. Rait, K. Kawase, S.-T. Hoh, Y. M. Buys and J. Dickinson, Hum. Mol. Genet., 1999, 8, 899–905 CrossRef CAS PubMed.
- M. A. Aldred, L. Baumber, A. Hill, E. C. Schwalbe, K. Goh, W. Karwatowski and R. C. Trembath, Hum. Genet., 2004, 115, 428–431 CrossRef PubMed.
- J. L. Wiggs, K. F. Damji, J. L. Haines, M. A. Pericak-Vance and R. R. Allingham, Am. J. Hum. Genet., 1996, 58, 243 CAS.
- D. J. E. Huard and R. L. Lieberman, Future Med. Chem., 2018, 10, 1391–1393 CrossRef CAS PubMed.
- A. Llobet, X. Gasull and A. Gual, Physiology, 2003, 18, 205–209 CrossRef PubMed.
- J. D. Aroca-Aguilar, F. Sánchez-Sánchez, S. Ghosh, M. Coca-Prados and J. Escribano, J. Biol. Chem., 2005, 280, 21043–21051 CrossRef CAS PubMed.
- T. Borrás, J. Ocul. Pharmacol. Ther., 2014, 30, 202–212 CrossRef PubMed.
- F. Sanchez-Sanchez, F. Martinez-Redondo, J. D. Aroca-Aguilar, M. Coca-Prados and J. Escribano, J. Biol. Chem., 2007, 282, 27810–27824 CrossRef CAS PubMed.
- M. F. Adam, A. Belmouden, P. Binisti, A. P. Brézin, F. Valtot, A. Béchetoille, J.-C. Dascotte, B. Copin, L. Gomez and A. Chaventré, Hum. Mol. Genet., 1997, 6, 2091–2097 CrossRef CAS PubMed.
- G. Gong, O. Kosoko-Lasaki, G. R. Haynatzki and M. R. Wilson, Hum. Mol. Genet., 2004, 13, R91–R102 CrossRef CAS PubMed.
- M. Caballero, L. L. S. Rowlette and T. Borrás, Biochim. Biophys. Acta, Mol. Basis Dis., 2000, 1502, 447–460 CrossRef CAS.
- N. Jacobson, M. Andrews, A. R. Shepard, D. Nishimura, C. Searby, J. H. Fingert, G. Hageman, R. Mullins, B. L. Davidson and Y. H. Kwon, Hum. Mol. Genet., 2001, 10, 117–125 CrossRef CAS PubMed.
- A. R. Shepard, N. Jacobson, J. C. Millar, I.-H. Pang, H. T. Steely, C. C. Searby, V. C. Sheffield, E. M. Stone and A. F. Clark, Hum. Mol. Genet., 2007, 16, 609–617 CrossRef CAS PubMed.
- A. Jain, G. Zode, R. B. Kasetti, F. A. Ran, W. Yan, T. P. Sharma, K. Bugge, C. C. Searby, J. H. Fingert and F. Zhang, Proc. Natl. Acad. Sci., 2017, 114, 11199–11204 CrossRef CAS PubMed.
- J.-D. Aroca-Aguilar, F. Sánchez-Sánchez, F. Martínez-Redondo, M. Coca-Prados and J. Escribano, Mol. Vision, 2008, 14, 2097 CAS.
- B. S. Kim, O. V. Savinova, M. V. Reedy, J. Martin, Y. Lun, L. Gan, R. S. Smith, S. I. Tomarev, S. W. M. John and R. L. Johnson, Mol. Cell. Biol., 2001, 21, 7707–7713 CrossRef CAS PubMed.
- C. M. McDowell, T. Luan, Z. Zhang, T. Putliwala, R. J. Wordinger, J. C. Millar, S. W. M. John, I.-H. Pang and A. F. Clark, Exp. Eye Res., 2012, 100, 65–72 CrossRef CAS PubMed.
- Y. Liu and D. Vollrath, Hum. Mol. Genet., 2004, 13, 1193–1204 CrossRef CAS PubMed.
- A. Suntharalingam, J. F. Abisambra, J. C. O'Leary, J. Koren, B. Zhang, M. K. Joe, L. J. Blair, S. E. Hill, U. K. Jinwal and M. Cockman, J. Biol. Chem., 2012, 287, 40661–40669 CrossRef CAS PubMed.
- M. K. Joe, S. Sohn, W. Hur, Y. Moon, Y. R. Choi and C. Kee, Biochem. Biophys. Res. Commun., 2003, 312, 592–600 CrossRef CAS PubMed.
- G. H.-F. Yam, K. Gaplovska-Kysela, C. Zuber and J. Roth, Am. J. Pathol., 2007, 170, 100–109 CrossRef CAS PubMed.
- R. R. H. Anholt and M. A. Carbone, Trends Mol. Med., 2013, 19, 586–593 CrossRef CAS PubMed.
- R. Sharma and A. Grover, Mol. Vision, 2021, 27, 480 CAS.
- R. B. Kasetti, P. Maddineni, J. C. Millar, A. F. Clark and G. S. Zode, Sci. Rep., 2017, 7, 1–14 CrossRef CAS PubMed.
- G. C. Patel, T. N. Phan, P. Maddineni, R. B. Kasetti, J. C. Millar, A. F. Clark and G. S. Zode, Am. J. Pathol., 2017, 187, 713–723 CrossRef CAS PubMed.
- R. K. Donegan, S. E. Hill, D. M. Freeman, E. Nguyen, S. D. Orwig, K. C. Turnage and R. L. Lieberman, Hum. Mol. Genet., 2015, 24, 2111–2124 CrossRef CAS PubMed.
- H. Wang, M. Li, Z. Zhang, H. Xue, X. Chen and Y. Ji, Int. J. Mol. Med., 2019, 43, 671–681 CAS.
- S. D. Orwig, C. W. Perry, L. Y. Kim, K. C. Turnage, R. Zhang, D. Vollrath, I. Schmidt-Krey and R. L. Lieberman, J. Mol. Biol., 2012, 421, 242–255 CrossRef CAS PubMed.
- S. E. Hill, R. K. Donegan and R. L. Lieberman, J. Mol. Biol., 2014, 426, 921–935 CrossRef CAS PubMed.
- D. J. E. Huard, V. M. Crowley, Y. Du, R. A. Cordova, Z. Sun, M. O. Tomlin, C. A. Dickey, J. Koren III, L. Blair and H. Fu, ACS Chem. Biol., 2018, 13, 933–941 CrossRef CAS PubMed.
- J. M. Lynch, B. Li, P. Katoli, C. Xiang, B. Leehy, N. Rangaswamy, V. Saenz-Vash, Y. K. Wang, H. Lei and T. B. Nicholson, J. Biol. Chem., 2018, 293, 20137–20156 CrossRef CAS PubMed.
- F. Chiti and C. M. Dobson, Annu. Rev. Biochem., 2017, 86, 27–68 CrossRef CAS PubMed.
- R. L. Lieberman and M. T. Ma, Acc. Chem. Res., 2021, 54, 2205–2215 CrossRef CAS PubMed.
- R. K. Donegan and R. L. Lieberman, J. Med. Chem., 2016, 59, 788–809 CrossRef CAS PubMed.
- K. Zhang, L. Zhang and R. N. Weinreb, Nat. Rev. Drug Discovery, 2012, 11, 541–559 CrossRef CAS PubMed.
- J. E. Craig, P. N. Baird, D. L. Healey, A. I. McNaught, P. J. McCartney, J. L. Rait, J. L. Dickinson, L. Roe, J. H. Fingert and E. M. Stone, Ophthalmology, 2001, 108, 1607–1620 CrossRef CAS PubMed.
- J. E. Craig, X. Han, A. Qassim, M. Hassall, J. N. Cooke Bailey, T. G. Kinzy, A. P. Khawaja, J. An, H. Marshall and P. Gharahkhani, Nat. Genet., 2020, 52, 160–166 CrossRef CAS PubMed.
- J. N. Burns, S. D. Orwig, J. L. Harris, J. D. Watkins, D. Vollrath and R. L. Lieberman, ACS Chem. Biol., 2010, 5, 477–487 CrossRef CAS PubMed.
- G. H.-F. Yam, K. Gaplovska-Kysela, C. Zuber and J. r. Roth, Invest. Ophthalmol. Visual Sci., 2007, 48, 1683–1690 CrossRef PubMed.
- G. S. Zode, M. H. Kuehn, D. Y. Nishimura, C. C. Searby, K. Mohan, S. D. Grozdanic, K. Bugge, M. G. Anderson, A. F. Clark and E. M. Stone, J. Clin. Invest., 2011, 121, 3542–3553 CrossRef CAS PubMed.
- G. S. Zode, K. E. Bugge, K. Mohan, S. D. Grozdanic, J. C. Peters, D. R. Koehn, M. G. Anderson, R. H. Kardon, E. M. Stone and V. C. Sheffield, Invest. Ophthalmol. Visual Sci., 2012, 53, 1557–1565 CrossRef CAS PubMed.
- L. K. Gavrin, R. A. Denny and E. Saiah, J. Med. Chem., 2012, 55, 10823–10843 CrossRef CAS PubMed.
- Y. S. Eisele, C. Monteiro, C. Fearns, S. E. Encalada, R. L. Wiseman, E. T. Powers and J. W. Kelly, Nat. Rev. Drug Discovery, 2015, 14, 759–780 CrossRef CAS PubMed.
- J.-C. Rochet, Expet Rev. Mol. Med., 2007, 9, 1–34 CrossRef PubMed.
- S. M. Johnson, R. L. Wiseman, Y. Sekijima, N. S. Green, S. L. Adamski-Werner and J. W. Kelly, Acc. Chem. Res., 2005, 38, 911–921 CrossRef CAS PubMed.
- V. J. McParland, N. M. Kad, A. P. Kalverda, A. Brown, P. Kirwin-Jones, M. G. Hunter, M. Sunde and S. E. Radford, Biochemistry, 2000, 39, 8735–8746 CrossRef CAS PubMed.
- M. Dumoulin, A. M. Last, A. Desmyter, K. Decanniere, D. Canet, G. Larsson, A. Spencer, D. B. Archer, J. Sasse and S. Muyldermans, Nature, 2003, 424, 783–788 CrossRef CAS PubMed.
- S. D. Orwig, P. V. Chi, Y. Du, S. E. Hill, M. A. Cavitt, A. Suntharalingam, K. C. Turnage, C. A. Dickey, S. France and H. Fu, ACS Chem. Biol., 2014, 9, 517–525 CrossRef CAS PubMed.
- B. Srinivasan, S. Tonddast-Navaei and J. Skolnick, Bioorg. Med. Chem. Lett., 2017, 27, 4133–4139 CrossRef CAS PubMed.
- M. Tang, Y. Fu, Y. Fan, M.-S. Fu, Z. Zheng and X. Xu, Trop. J. Pharm. Res., 2017, 16, 2527–2533 CrossRef CAS.
- P. J. Eswari Pandaranayaka, J. Kanagavalli, S. R. Krishnadas, P. Sundaresan and S. Krishnaswamy, World J. Microbiol. Biotechnol., 2008, 24, 903–907 CrossRef CAS.
- B.-C. Park, X. Shen, M. P. Fautsch, M. Tibudan, D. H. Johnson and B. Y. J. T. Yue, Mol. Vision, 2006, 12, 832 CAS.
- T. Arakawa, D. Ejima, K. Tsumoto, N. Obeyama, Y. Tanaka, Y. Kita and S. N. Timasheff, Biophys. Chem., 2007, 127, 1–8 CrossRef CAS PubMed.
- J.-Q. Guo, S.-Y. You, L. Li, Y.-Z. Zhang, J.-N. Huang and C.-Y. Zhang, J. Biotechnol., 2003, 102, 177–189 CrossRef CAS PubMed.
- J.-C. Zhao, Z.-D. Zhao, W. Wang and X.-M. Gao, Protein Expr. Purif., 2005, 39, 169–174 CrossRef CAS PubMed.
- S. D. Orwig and R. L. Lieberman, PLoS One, 2011, 6, e16347 CrossRef CAS PubMed.
- S.-J. Hyung, A. S. DeToma, J. R. Brender, S. Lee, S. Vivekanandan, A. Kochi, J.-S. Choi, A. Ramamoorthy, B. T. Ruotolo and M. H. Lim, Proc. Natl. Acad. Sci., 2013, 110, 3743–3748 CrossRef CAS PubMed.
- J. Bieschke, J. Russ, R. P. Friedrich, D. E. Ehrnhoefer, H. Wobst, K. Neugebauer and E. E. Wanker, Proc. Natl. Acad. Sci., 2010, 107, 7710–7715 CrossRef CAS PubMed.
- D. E. Ehrnhoefer, M. Duennwald, P. Markovic, J. L. Wacker, S. Engemann, M. Roark, J. Legleiter, J. L. Marsh, L. M. Thompson and S. Lindquist, Hum. Mol. Genet., 2006, 15, 2743–2751 CrossRef CAS PubMed.
- K. Debnath, S. Shekhar, V. Kumar, N. R. Jana and N. R. Jana, ACS Appl. Mater. Interfaces, 2016, 8, 20309–20318 CrossRef CAS PubMed.
- N. Lorenzen, S. B. Nielsen, Y. Yoshimura, B. S. Vad, C. B. Andersen, C. Betzer, J. D. Kaspersen, G. Christiansen, J. S. Pedersen and P. H. Jensen, J. Biol. Chem., 2014, 289, 21299–21310 CrossRef PubMed.
- D. E. Ehrnhoefer, J. Bieschke, A. Boeddrich, M. Herbst, L. Masino, R. Lurz, S. Engemann, A. Pastore and E. E. Wanker, Nat. Struct. Mol. Biol., 2008, 15, 558–566 CrossRef CAS PubMed.
- T. Chen, Y. Yang, S. Zhu, Y. Lu, L. Zhu, Y. Wang and X. Wang, Bioorg. Chem., 2020, 105, 104382 CrossRef CAS PubMed.
- J. Wan, M. Feng, W. Pan, X. Zheng, X. Xie, B. Hu, C. Teng, Y. Wang, Z. Liu and J. Wu, Antioxidants, 2021, 10, 1513 CrossRef CAS PubMed.
- S. Ghosh, N. K. Pandey and S. Dasgupta, Int. J. Biol. Macromol., 2013, 54, 90–98 CrossRef CAS PubMed.
- K. Martinez Pomier, R. Ahmed and G. Melacini, Molecules, 2020, 25, 3571 CrossRef PubMed.
- R. A. Laskowski and M. B. Swindells, J. Chem. Inf. Model., 2011, 51, 2778–2786 CrossRef CAS PubMed.
- E. F. Pettersen, T. D. Goddard, C. C. Huang, G. S. Couch, D. M. Greenblatt, E. C. Meng and T. E. Ferrin, J. Comput. Chem., 2004, 25, 1605–1612 CrossRef CAS PubMed.
- Y. Wang, Y. Gao, S. E. Hill, D. J. E. Huard, M. O. Tomlin, R. L. Lieberman, A. K. Paravastu and C. K. Hall, J. Phys. Chem. B, 2018, 122, 5845–5850 CrossRef CAS PubMed.
- S. M. Ulamec, D. J. Brockwell and S. E. Radford, Front. Neurosci., 2020, 1216 Search PubMed.
- K. Gade Malmos, L. M. Blancas-Mejia, B. Weber, J. Buchner, M. Ramirez-Alvarado, H. Naiki and D. Otzen, Amyloid, 2017, 24, 1–16 CrossRef CAS PubMed.
- L. Nielsen, R. Khurana, A. Coats, S. Frokjaer, J. Brange, S. Vyas, V. N. Uversky and A. L. Fink, Biochemistry, 2001, 40, 6036–6046 CrossRef CAS PubMed.
- N. Admane, A. Srivastava, S. Jamal, B. Kundu and A. Grover, ACS Chem. Neurosci., 2019, 11, 2422–2430 CrossRef PubMed.
- H. J. Wobst, A. Sharma, M. I. Diamond, E. E. Wanker and J. Bieschke, FEBS Lett., 2015, 589, 77–83 CrossRef CAS PubMed.
- E. Sironi, L. Colombo, A. Lompo, M. Messa, M. Bonanomi, M. E. Regonesi, M. Salmona and C. Airoldi, Chem.–Eur. J., 2014, 20, 13793–13800 CrossRef CAS PubMed.
- R. Ahmed, J. Huang, R. Lifshitz, K. M. Pomier and G. Melacini, J. Biol. Chem., 2022, 298(2), 101502 CrossRef CAS PubMed.
- D. Roy, D. Bhattacharyya and A. Bhunia, Nat. Prod. Commun., 2019, 14, 1934578X19849791 CAS.
- L. Stryer, J. Mol. Biol., 1965, 13, 482–495 CrossRef CAS PubMed.
- G. V. Semisotnov, N. A. Rodionova, O. I. Razgulyaev, V. N. Uversky, A. F. Gripas and R. I. Gilmanshin, Biopolymers, 1991, 31, 119–128 CrossRef CAS PubMed.
- A. L. Fink, Folding Des., 1998, 3, R9–R23 CrossRef CAS PubMed.
- X. Periole and A. E. Mark, J. Chem. Phys., 2007, 126, 01B601 CrossRef PubMed.
- R. Qi, G. Wei, B. Ma and R. Nussinov, in Peptide self-assembly, Springer, 2018, pp. 101–119 Search PubMed.
- H. R. Kalhor and M. Jabbary, J. Chem. Inf. Model., 2019, 59, 5218–5229 CrossRef CAS PubMed.
- A. Srivastava, J. Singh, S. P. Singh Yadav, P. Arya, F. Kalim, P. Rose, Ashish and B. Kundu, Biochemistry, 2018, 57, 2359–2372 CrossRef CAS PubMed.
- L. Wang, R. Zeng, X. Pang, Q. Gu and W. Tan, RSC Adv., 2015, 5, 66391–66402 RSC.
- I. Jahan and S. M. Nayeem, RSC Adv., 2020, 10, 27598–27614 RSC.
- S. E. Hill, M. S. Kwon, M. D. Martin, A. Suntharalingam, A. Hazel, C. A. Dickey, J. C. Gumbart and R. L. Lieberman, J. Biol. Chem., 2019, 294, 12717–12728 CrossRef CAS PubMed.
- V. Glide, LLC, New York, NY, 2009 Search PubMed.
- S. K. Burley, H. M. Berman, C. Christie, J. M. Duarte, Z. Feng, J. Westbrook, J. Young and C. Zardecki, Protein Sci., 2018, 27, 316–330 CrossRef CAS PubMed.
- W. Tian, C. Chen, X. Lei, J. Zhao and J. Liang, Nucleic Acids Res., 2018, 46, W363–W367 CrossRef CAS PubMed.
- S. R. LigPrep, Schrödinger, LLC, New York, NY, 2009 Search PubMed.
- A. Micsonai, F. Wien, L. Kernya, Y.-H. Lee, Y. Goto, M. Réfrégiers and J. Kardos, Proc. Natl. Acad. Sci., 2015, 112, E3095–E3103 CrossRef CAS PubMed.
- S. Kim, J. Chen, T. Cheng, A. Gindulyte, J. He, S. He, Q. Li, B. A. Shoemaker, P. A. Thiessen and B. Yu, Nucleic Acids Res., 2019, 47, D1102–D1109 CrossRef PubMed.
- A. W. Schüttelkopf and D. M. F. Van Aalten, Acta Crystallogr., Sect. D: Biol. Crystallogr., 2004, 60, 1355–1363 CrossRef PubMed.
- M. J. Abraham, T. Murtola, R. Schulz, S. Páll, J. C. Smith, B. Hess and E. Lindahl, SoftwareX, 2015, 1, 19–25 CrossRef.
- Z. Sun, A Benchmark Test on the Leapfrog Integrator and its Middle Alternative, 2021 Search PubMed.
- M. J. Harvey and G. De Fabritiis, J. Chem. Theory Comput., 2009, 5, 2371–2377 CrossRef CAS PubMed.
- Y. Wu, H. L. Tepper and G. A. Voth, J. Chem. Phys., 2006, 124, 024503 CrossRef PubMed.
- H. J. C. Berendsen, J. P. M. v. Postma, W. F. Van Gunsteren, A. DiNola and J. R. Haak, J. Chem. Phys., 1984, 81, 3684–3690 CrossRef CAS.
- W. G. Hoover, Phys. Rev. A: At., Mol., Opt. Phys., 1985, 31, 1695 CrossRef PubMed.
- S. Miyamoto and P. A. Kollman, J. Comput. Chem., 1992, 13, 952–962 CrossRef CAS.
- R. Denschlag, M. Lingenheil and P. Tavan, Chem. Phys. Lett., 2009, 473, 193–195 CrossRef CAS.
- A. Patriksson and D. van der Spoel, Phys. Chem. Chem. Phys., 2008, 10, 2073–2077 RSC.
Footnote |
| † Electronic supplementary information (ESI) available. See DOI: https://doi.org/10.1039/d2ra05061g |
| This journal is © The Royal Society of Chemistry 2022 |