 Open Access Article
Creative Commons Attribution 3.0 Unported Licence
Effect of (H2O)n (n = 0–3, 13) on the NH3 + OH reaction in the gas and liquid phases†
Yujie Zhou a,
Qi Caob,
Yu Yangb,
Dandan Ma
 a,
Quan Zhu
 cd and
Jianyi Ma
 *ad
*ad
aInstitute of Atomic and Molecular Physics, Sichuan University, Chengdu, 610065, China. E-mail: majianyi81@163.com
bReactor Operation and Application Research Sub-Institute, Nuclear Power Institute of China, Chengdu 610041, China
cSchool of Chemical Engineering, Sichuan University, Chengdu, 610065, PR China
dEngineering Research Center of Combustion and Cooling for Aerospace Power, Ministry of Education, Sichuan University, Chengdu, 610065, PR China
First published on 30th September 2022
Abstract
We studied the effect of water clusters on the NH3 + OH reaction at both the DFT and CCSD(T) levels. The calculated rate constants for the pure reaction are 2.07 × 10⁻¹³ and 1.35 × 10⁻¹³ cm3 molecule−1 s−1 in the gas and liquid phases, respectively, and the gas-phase rate constants are consistent with the corresponding experimental result (1.70 × 10⁻¹³ cm3 molecule−1 s−1), while the liquid-phase rate constants are slightly smaller than the experimental value (5.84 × 10⁻¹² cm3 molecule−1 s−1). In the gas phase, the presence of (H2O)n (n = 1–3) decreases the rate constant compared to the pure NH3 + OH reaction, and these results are in agreement with many reported H2O-catalyzed reactions. For the liquid phase reaction, compared with the case of n = 0–3, when the size of the water molecule cluster surrounding the OH radical is n = 13, the rate constant of the title reaction increases. Our study also shows that proton transfer is also a factor which accelerates the liquid phase NH3 + OH reaction.
1. Introduction
Ammonia is the third most abundant nitrogen species in the terrestrial atmosphere and plays a highly critical role in both homogeneous and nonhomogeneous atmospheric reactions. Moreover, as the main alkaline gas in the atmosphere, ammonia can neutralize the acid in the atmosphere and can be oxidized to reduce the acidity of water.1–4 Currently, ammonia can be used as a new fuel instead of traditional fuels, and its combustion does not produce carbon dioxide, the products are water and nitrogen oxides.5,6 Hydroxyl radicals are widely present in water, the atmosphere and galactic space, and they serve as an extremely powerful oxidizing agent that can easily take hydrogen atoms from other molecules to form water molecules.7–9 The reaction of ammonia with hydroxyl radicals is a key step in the combustion mechanism of fossil fuels and is extremely important in the combustion process. As a typical hydrogen absorption reaction, the reaction of ammonia with hydroxyl radicals represents a decisive step in the oxidation of ammonia; therefore, this reaction has been studied extensively.1,3,4,10–15 On the other hand, the decomposition of coolant by strong radiation in the one-loop system produces strong oxidation products, which are an important cause of corrosion of structural materials and equipment. Ammonia is added to a water-cooled nuclear reactor to prevent oxygen production from radiolysis. The first step in ammonia decomposition is to react with the hydroxyl radicals produced by water irradiation. Therefore, the title reaction is extremely important in the ammonia radiolysis reaction in an aqueous phase environment.16,17There are several studies of the NH3 + OH reaction both experimentally and theoretically. Experimentally, Perry18 determined the rate constant in the temperature range of 297–427 K and derived a rate constant of (1.64 ± 0.16) × 10−13 cm3 molecule−1 s−1 at room temperature. Silver19 then studied the rate constants in the temperature range from 294 to 1075 K, which gave the rate constants for the reaction at room temperature and extended the temperature range. Stephens20 also determined an absolute rate constant of 1.7 × 10⁻¹³ cm3 molecule−1 s−1 at room temperature by using the resonance fluorescence method. Wei-Guang Diau4 measured a rate constant of (1.47 ± 0.07) × 10−13 cm3 molecule−1 s−1 at 297 K by reaction dynamics. Hickel17 studied the reaction of hydroxyl radicals with ammonia in aqueous solutions by pulsed radiation analysis in the temperature range of 20–200 °C and measured a rate constant of 5.84 × 10⁻¹² cm3 molecule−1 s−1 at room temperature. Theoretically, both Espinosa-Garcia and Giménez1,11 performed structural optimization and frequency calculations for reactants, transition states and reaction products. Espinosa-Garcia21 also calculated rate constants in the temperature range of 200–4000 K using variational transition-state theory. Giménez1 obtained enthalpy barriers of the NH3 + OH reaction of 5.12 kcal mol−1. In addition, Monge-Palacios14 based their higher-order ab initio calculations on the established full-dimensional analytical potential energy surface for the gas-phase reaction and performed a kinetic study, where their results well reproduced the experimental values of the forward rate constants. In a recent study, Zhang22 investigated the effect of water and ammonia as catalysts on the reaction rate constant at the CCSD(T)-F12a/cc-pVDZ-F12/M06-2X/6-311+G(2d,2p) level under gas-phase conditions. In Table 1, we list some of the previous work on the NH3 + OH reaction, both experimentally and theoretically. However, the solvation effect of the NH3 + OH reaction and how to calculate the NH3 + OH liquid phase rate constant is still a problem. As OH and NH3 are typical polar molecules, the solvation free energy changes greatly in the reaction process in water, a solvent with great polarity. Therefore, the influence of the solvation effect on the reaction needs to be considered for the NH3 + OH reaction in the liquid phase. In previous studies, many scholars have studied the solvation effect by adding solvent molecules and have achieved good results.23–25 Therefore, the same idea is used in this paper to study the effect of water clusters on the NH3 + OH reaction. The difference is that the former studied the spectral behavior by adding water molecules; we not only consider the solvation effect of water clusters but also the implicit solvent model and the proton transfer behavior, so we emphasize on the kinetic behavior.
| Experimental | |
|---|---|
| Ref. 4 | The flash photolysis/laser-induced fluorescence technique was used to study the rate in 273–433 K |
| Ref. 17 | The rate constants in the range of 293–473 K were studied by pulse radiolysis method in liquid phase |
| Ref. 18 | The rate constants in the range of 297–427 K were studied by a flash photolysis-resonance fluorescence technique |
| Ref. 19 | The rate constants in the range of 294–1075 K were obtained by high temperature fast flow reactor |
| Ref. 20 | Study rate constants in 297–364 K by discharge flow technique with resonance fluorescence detection of OH |
| Theoretical | |
|---|---|
| Ref. 2 | Activation energies and rate constants in the 300–2500 K were calculated at the M06-2X/aug-ccpvqz and CCSD(T)/6-311++G(3df, 3pd) levels |
| Ref. 11 | The energy variations was calculated at the QCI/6-311+G(2df,p) level |
| Ref. 14 | Develop a full-dimensional analytical potential energy surface and calculate the rate constant in 200–200 K |
| Ref. 22 | Study the effect of the addition of single water molecules on the rate at CCSD(T)-F12a/ccpVDZ-F12//M06-2X/6-311+G(2d,2p) level |
In this work, we perform ab initio calculations for the H2O-catalyzed OH + NH3 reaction at the CCSD(T)-F12a/cc-pVDZ-F12//M06-2X/6-311+G(2d,2p) and M06-2X/6-311+G(2d,2p) levels for the gas phase and liquid phase, respectively. For each size water cluster, we further calculated the structure, reaction energy barrier and reaction rate of various conformations in gas and liquid phases. The corresponding rate constants are calculated by using transition state theory. In this case, we used the polarizable-continuum model (PCM)26–28 model from the implicit solvent model to consider the liquid-phase NH3 + OH reaction. And we calculate the solute free energy and solvation free energy together by the self-consistent solvation field.
2. Calculational method
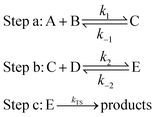
The electronic structure calculation is performed by using Gaussian 09,29 MOLPRO30 program package. The structure optimization and energy calculation of all reactants, intermediates, transition states and products are performed using density functional theory (DFT) at the M06-2X/6-311+G(2d,2p) level31,32 in the liquid phase, which uses an implicit solvent model,28,33 the implicit solvent model used in this paper is the PCM model. In the gas phase, the optimized geometries are at the M06-2X/6-311+G(2d,2p) level, and the energy calculation is at the CCSD(T)-F12a/cc-pVDZ-F12 level.34 The accuracy of the M06-2X method in the reaction of ammonia and hydroxyl radicals has been confirmed in the past.2 At the same level, the minimum energy path (MEP) is also obtained through the intrinsic reaction coordinate (IRC)35,36 theory.In the aqueous environment, water clusters with different sizes and conformations have a great probability of participating in the reaction. The processes for the formation of NH3 + OH + (H2O)n → NH2 + H2O + (H2O)n are divided into three main steps:22,37,38
For this type of reaction, the total rate constant calculation for the involvement of water clusters can be written as:22,37
| k = Keq1 × Keq2 × kTS | (1) |
The expression for the TST reaction rate constant41 for a reaction of A + B → C can be expressed as:
 | (2) |
 | (3) |
According to eqn (3), the TST equation can be changed to an equivalent thermodynamics form,
 | (4) |
| G(liquid) = Gg + Gs + 1.89 kcal mol−1 | (5) |
 | (6) |
For the liquid phase reaction, the free energy is calculated using the self-consistent reaction field inside the Gaussian. In addition, the concentration of water molecules is relatively high relative to the concentration of A(OH/NH3) in the liquid phase environment, so the concentration of A·H2O is equal to the concentration of A. Therefore, the C[H2O]·Keq1 is close to 1 in the actual calculation. In the simplified case, we approximate the value of Keq1 to 1.
3. Results and discussion
The intermediate complexes in each reaction path are indicated by “IM” followed by a number, the transition states are denoted by “TS” followed by a number, and the intermediate final complexes are indicated by “IMF” followed by a number. Species with water monomers, water dimers and water trimers are indicated by the “WM”, “WD” and “WT” suffixes, respectively. The energy path diagram in this paper uses the reactant energy as the zero point.3.1 Potential energy surfaces and rate constants for the reaction of NH3 + OH → NH2 + H2O
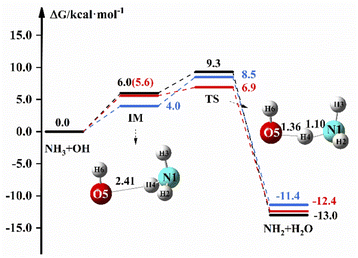
Fig. 1 shows the reaction path of NH3 + OH → NH2 + H2O in the gas and liquid phase. In Fig. 1, the free energy of IM is 6.0 kcal mol−1 and the ΔG is 9.3 kcal mol−1 in the liquid phase. In the gas phase, the free energy of TS is 8.5 kcal mol−1 at the M06-2X/6-311+G(2d,2p) level, and the free energy of IM and TS are 5.6 and 6.9 kcal mol−1, respectively, at the CCSD(T)-F12a/cc-pVDZ-F12//M06-2X/6-311+G(2d,2p) level. The relevant data (electron energy, free energy) are listed on the ESI.†Table 2 shows the rate constants both in the gas and liquid phases for the pure reaction. ΔETS is found to be 3.5 kcal mol−1 at the M06-2X/6-311+G(2d,2p) level in the gas phase, which is close to the previously reported value (3.3 kcal mol−1),2 and the rate constant is 2.07 × 10⁻¹³ cm3 molecule−1 s−1, which is in good agreement with the experimental value20 of 1.70 × 10⁻¹³ cm3 molecule−1 s−1. In the liquid phase, ΔETS is 3.7 kcal mol−1 at the M06-2X/6-311+G(2d,2p) level, and the rate constant calculated by using eqn (1) is 1.35 × 10⁻¹³ cm3 molecule−1 s−1, which is slightly less than the experimental value (5.84 × 10⁻¹² cm3 molecule−1 s−1).17 In the gas phase, the rate constant is 3.47 × 10⁻¹³ cm3 molecule−1 s−1 at the CCSD(T)-F12a/cc-pVDZ-F12//M06-2X/6-311+G(2d,2p) level, which is not different from the theoretical22 and experimental20 results. The experimental results of the NH3 + OH reaction show that the rate constant of the liquid phase is 30 times larger than the rate constant of the gas phase, which indicates that the liquid phase conditions can accelerate the reaction of NH3 with OH. Our calculations show that the NH3 + OH reaction rate constants do not differ much between gas-phase and liquid-phase conditions.
| M06-2X | CCSD(T) | Exp | |||
|---|---|---|---|---|---|
| ΔETS | k | ΔETS | k | k | |
| a Ref. 2 M06-2X/aug-cc-pVQZ.b Ref. 22 CCSD(T)-F12a/cc-pVDZ-F12.c Ref. 20 Exp.d Ref. 17 Exp; ΔETS (kcal mol−1) is the energy of the transition state relative to the intermediate complex. k is the total rate constant of the NH3 + OH reaction. | |||||
| Gas | 3.5 (3.3)a | 2.07 × 10⁻¹³ | 2.4 (3.3)b | 3.47 × 10⁻¹³ (1.03 × 10⁻¹³)b | 1.70 × 10⁻¹³c |
| Liquid | 3.7 | 1.35 × 10⁻¹³ | — | 5.84 × 10⁻¹²d | |
3.2 Potential energy surfaces and rate constants for the reaction of NH3 + OH + H2O → NH2 + H2O + H2O
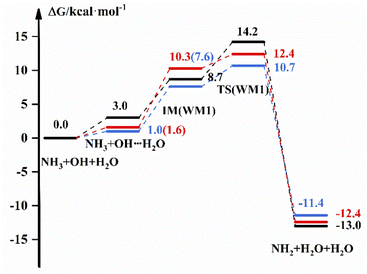
The reaction scheme for the reaction of NH3 + OH with H2O is displayed in Fig. 2, which shows the free energies of the reactants, intermediate complexes, transition states and products by different methods. The intermediate complexes exist in different conformations, and we selected three conformations to study the effect of H2O on the pure reaction. Fig. 2 shows the reaction free energy diagram for one conformation; for the other two conformations, we have listed the reaction scheme in the ESI.† Fig. 2 shows that the free energy of the bimolecular complex and IM are 3.0 and 8.7 kcal mol−1, respectively, and the ΔG is 14.2 kcal mol−1 under the implicit solvent model. In the gas-phase environment, the free energy are 1.0 kcal mol−1 and 7.6 kcal mol−1, respectively, and ΔG is 10.7 kcal mol−1, which is 3.5 kcal mol−1 smaller than the result in liquid phase conditions. After we recalculate the energy of the reactants, intermediates, transition states and products in the gas-phase environment by using high-precision calculation methods, the G of IM is 10.3 kcal mol−1, and ΔG is 12.4 kcal mol−1. For WM3, NH3 binds more readily to H2O to form a complex, and the free energy of the bimolecular complex is 2.3 kcal mol−1. For other relevant data we see the ESI.† In addition, we give the transition state structures and precursor complex structures of the corresponding reaction path in Fig. S2 and S3.† Besides, we list the hydrogen bonding bond energies42 in the precursor complexes in Table S3.† Then, we calculate the rate constant for each path, and the results are listed in Table 3.| Keq1(WM) | Keq2(WM) | kTS(WM) | k(WM) | ||
|---|---|---|---|---|---|
| a Keq1(WM) is the equilibrium constant corresponding to step a, Keq2(WM) is the equilibrium constant corresponding to step b, and kTS(WM) is the rate constant corresponding to step c, k(WM) is the total rate constant for the NH3 + OH + H2O → NH2 + H2O + H2O reaction, s and g represent the calculation result in the liquid and gas phases. | |||||
| WM1 | DFT(s) | 1 | 6.06 × 10⁻⁵ | 3.77 × 10⁻¹¹ | 2.28 × 10⁻¹⁵ |
| DFT(g) | 1.88 × 10⁻¹ | 1.47 × 10⁻⁵ | 2.08 × 10⁻⁹ | 5.75 × 10⁻¹⁵ | |
| CC(g) | 6.63 × 10⁻² | 4.30 × 10⁻⁷ | 1.02 × 10⁻⁸ | 2.91 × 10⁻¹⁶ | |
| WM2 | DFT(s) | 1 | 2.35 × 10⁻⁵ | 9.27 × 10⁻¹¹ | 2.18 × 10⁻¹⁵ |
| DFT(g) | 1.78 × 10⁻¹ | 1.34 × 10⁻⁵ | 2.44 × 10⁻⁹ | 5.83 × 10⁻¹⁵ | |
| CC(g) | 6.40 × 10⁻² | 3.82 × 10⁻⁷ | 1.26 × 10⁻⁸ | 3.09 × 10⁻¹⁶ | |
| WM3 | DFT(s) | 1 | 3.18 × 10⁻⁴ | 1.05 × 10⁻¹² | 3.35 × 10⁻¹⁶ |
| DFT(g) | 1.83 × 10⁻¹ | 4.15 × 10⁻⁴ | 2.20 × 10⁻¹¹ | 1.67 × 10⁻¹⁵ | |
| CC(g) | 9.87 × 10⁻² | 4.02 × 10⁻⁵ | 2.43 × 10⁻¹¹ | 9.64 × 10⁻¹⁷ | |
In Table 3, we list the rate constants for the participation of H2O in the NH3 + OH reaction. And in this paper, the rate constants calculated using the free energy, and we list the free energy corresponding to each part of the NH3 + OH + (H2O)n reaction in the ESI.† In real situations, the concentration of H2O is higher than the concentration of OH in the aqueous phase environment, which allows ‘step a’ to occur rapidly. From this information, we set the equilibrium constant of this part to 1 in the liquid phase, and k(WM) is the total rate constant obtained from the above. From Table 3, we observe that the addition of H2O under the implicit solvent model decreases the reaction rate constant by 2–3 orders of magnitude compared to the bare reaction rate constant of 1.35 × 10⁻¹³ cm3 molecule−1 s−1. The rate constants calculated by using the DFT method at the same level in the gas phase are 2 orders of magnitude lower than the bare reaction rate constant (2.07 × 10⁻¹³ cm3 molecule−1 s−1). Then, we further analyse the NH3 + OH + H2O reaction in the gas phase at the CCSD(T)-F12a/cc-pVDZ-F12//M06-2X/6-311+G(2d,2p) level, and the results show that the rate constant still decreases by 3–4 orders of magnitude, which is consistent with the theoretical results in the literature22 that the presence of H2O does not accelerate the NH3 + OH reaction. From Fig. S4,† the structures in the gas phase and liquid phase environments can be seen to be very different, which might result in differences in reaction rates across environments. The above results do not indicate that the liquid phase conditions promote the pure NH3 + OH reaction. In addition, the solvation effect becomes larger after the addition of H2O under the implicit solvent model. In the implicit solvent model, the solvation energy is composed mainly of the electrostatic interaction between solute and solvent, and the reactants OH, NH3 and water clusters have large polarity. In this way, the reduction in reactant energy caused by the solvation effect is greater than the reduction of reactant energy of the transition state, resulting in a reduction in the reaction rate. Of course, in the water environment, the translational and rotational free energy of reactants will increase, and the actual reaction energy barrier will decrease. Similarly, the translation and rotation of the solvent contribute to the reaction. On the other hand, the addition of water molecules to the NH3 + OH reaction results in an increase in the free energy of the reactants due to the low frequency and nonharmonic vibration43–45 modes of the water molecules. In addition to these factors, there may be other factors that can affect the rate. Considering these factors, the reaction rate will be higher than the current calculated value.
3.3 Potential energy surfaces and rate constants for the reaction of NH3 + OH + (H2O)2 → NH2 + H2O + (H2O)2
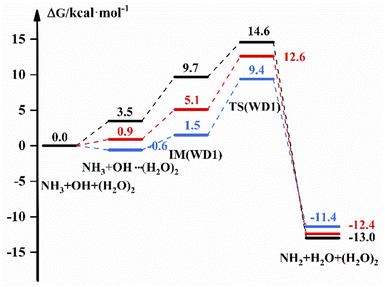
The free energy scheme for the NH3 + OH + (H2O)2 → NH2 + H2O + (H2O)2 reaction is displayed in Fig. 3. For WD1, Fig. 3 shows that the free energy of the complex formed by OH and (H2O)2 is 3.5 kcal mol−1, the G of IM is 9.7 kcal mol−1 and ΔG is 14.6 kcal mol−1 under the implicit solvent model. While in the gas phase, the free energy of the bimolecular complex is −0.6 kcal mol−1, the free energy of IM is 1.5 kcal mol−1 and ΔG is 9.4 kcal mol−1 with the DFT method. For WD2 and WD3 (Fig. S5†), (H2O)2 and NH3 are more likely to form complexes with free energies of 4.5 kcal mol−1 and 2.6 kcal mol−1 under the implicit solvent model, respectively. In addition, the corresponding energies for each part are also listed in Table S4,† and the transition state structures and precursor complex structures of the corresponding reaction path are given in Fig. S6 and S7.† Information such as electron energy and hydrogen bonding can also be obtained in the ESI.†Table 4 shows the rate constant in the different environments after the addition of (H2O)2 to the NH3 + OH reaction. In the gas phase, the presence of (H2O)2 is decreased by 1 order of magnitude compared to the pure NH3 + OH reaction rate constant (2.07 × 10⁻¹³ cm3 molecule−1 s−1) by the DFT method, and the results corrected at the CCSD(T)-F12a/cc-pVDZ-F12 level also decreased by 2–4 orders of magnitude compared to the pure reaction rate constant. Under the implicit solvent model, the reaction rate constant is reduced by 2–3 orders of magnitude compared to the rate constant of 1.35 × 10⁻¹³ cm3 molecule−1 s−1. Similarly, the structural difference between the conformations in the gas-phase and liquid-phase environments is greater with the addition of water molecules, which is also responsible for the variability of the rate constants. After adding (H2O)2 to the NH3 + OH reaction, the probability of water clusters binding to radicals increases, and the multi-water effect is also more pronounced in the liquid phase than in the gas phase.
| Keq1(WD) | Keq2(WD) | kTS(WD) | k(WD) | ||
|---|---|---|---|---|---|
| a k(WD) is the total rate constant for the NH3 + OH + (H2O)2 → NH2 + H2O + (H2O)2 reaction. | |||||
| WD1 | DFT(s) | 1 | 2.80 × 10⁻⁵ | 9.63 × 10⁻¹¹ | 2.70 × 10⁻¹⁵ |
| DFT(g) | 2.70 × 100 | 2.92 × 10⁻² | 5.67 × 10⁻¹³ | 4.47 × 10⁻¹⁴ | |
| CC(g) | 2.24 × 10⁻¹ | 7.63 × 10⁻⁴ | 1.25 × 10⁻¹² | 2.14 × 10⁻¹⁶ | |
| WD2 | DFT(s) | 1 | 3.01 × 10⁻³ | 4.99 × 10⁻¹³ | 1.50 × 10⁻¹⁵ |
| DFT(g) | 1.01 × 100 | 1.30 × 100 | 1.05 × 10⁻¹⁴ | 1.45 × 10⁻¹⁴ | |
| CC(g) | 1.91 × 10⁻¹ | 2.12 × 10⁻² | 2.23 × 10⁻¹⁴ | 9.07 × 10⁻¹⁷ | |
| WD3 | DFT(s) | 1 | 6.19 × 10⁻⁵ | 5.58 × 10⁻¹² | 3.45 × 10⁻¹⁶ |
| DFT(g) | 1.03 × 100 | 9.37 × 10⁻³ | 6.56 × 10⁻¹² | 6.36 × 10⁻¹⁴ | |
| CC(g) | 1.95 × 10⁻¹ | 9.34 × 10⁻⁴ | 1.59 × 10⁻¹¹ | 2.92 × 10⁻¹⁵ | |
3.4 Potential energy surfaces and rate constants for the reaction of NH3 + OH + (H2O)3 → NH2 + H2O + (H2O)3
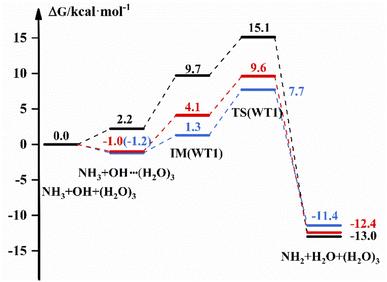
The free energy diagram for NH3 + OH + (H2O)3 are shown in Fig. 4 and S8.† From Fig. 4, the energy pathway of WT1 shows that the free energy of the bimolecular complex is 2.2 kcal mol−1, the free energy of IM is 9.7 and ΔG is 15.1 kcal mol−1 in the liquid phase. And in the gas phase, the ΔG of OH–(H2O)3 is −1.2 kcal mol−1, the free energy of IM is 1.3 kcal mol−1 and ΔG is 7.7 kcal mol−1 with the DFT method. In addition, the G of the bimolecular complex and IM are −1.0 and 4.1 kcal mol−1, respectively, and the ΔG is 9.6 kcal mol−1 at the CCSD(T)-F12a/cc-pVDZ-F12//M06-2X/6-311+G(2d,2p) level in the gas phase. And for WT3, the free energy of IM in the gas phase is 4.1 kcal mol−1 with the DFT method, which is 6.6 kcal mol−1 different from the results in the liquid phase, and the ΔG values are both smaller than those in the liquid phase. In addition, the ESI† provides structure diagrams, energies, hydrogen bonds, and other relevant data.The reaction rate constants are listed in Table 5 to compare the effect of (H2O)3 on the NH3 + OH reaction rate constants. The rate constant is (1.03 × 10⁻¹⁶ to 1.57 × 10⁻¹⁶) cm3 molecule−1 s−1 after the addition of (H2O)3 in the liquid phase, which is 3 orders of magnitude lower than the pure NH3 + OH reaction rate constant. In the gas phase, the rate constant is reduced by 1–3 orders of magnitude compared to the original reaction at the CCSD(T)-F12a/cc-pVDZ-F12//M06-2X/6-311+G(2d,2p) level.
| Keq1(WT) | Keq2(WT) | kTS(WT) | k(WT) | ||
|---|---|---|---|---|---|
| a k(WT) is the total rate constant for the NH3 + OH + (H2O)3 → NH2 + H2O + (H2O)3 reaction. | |||||
| WT1 | DFT(s) | 1 | 3.26 × 10⁻⁶ | 4.14 × 10⁻¹¹ | 1.35 × 10⁻¹⁶ |
| DFT(g) | 7.44 × 100 | 1.49 × 10⁻² | 7.59 × 10⁻¹² | 8.39 × 10⁻¹³ | |
| CC(g) | 4.96 × 100 | 1.87 × 10⁻⁴ | 3.71 × 10⁻¹¹ | 3.44 × 10⁻¹⁴ | |
| WT2 | DFT(s) | 1 | 4.15 × 10⁻⁶ | 2.49 × 10⁻¹¹ | 1.03 × 10⁻¹⁶ |
| DFT(g) | 1.18 × 10⁻³ | 8.07 × 10⁻¹ | 4.91 × 10⁻¹² | 4.69 × 10⁻¹⁵ | |
| CC(g) | 5.09 × 10⁻⁴ | 3.96 × 10⁻³ | 8.70 × 10⁻¹¹ | 1.75 × 10⁻¹⁶ | |
| WT3 | DFT(s) | 1 | 2.49 × 10⁻⁶ | 6.32 × 10⁻¹¹ | 1.57 × 10⁻¹⁶ |
| DFT(g) | 1.14 × 10⁻² | 4.23 × 10⁻² | 7.46 × 10⁻¹² | 3.60 × 10⁻¹⁵ | |
| CC(g) | 5.16 × 10⁻³ | 2.06 × 10⁻⁴ | 1.47 × 10⁻¹⁰ | 1.56 × 10⁻¹⁶ | |
From Fig. S11,† the free energy of the bimolecular complexes is lower than the free energy of reactants, indicating that ‘step a’ can occur quickly in the actual reaction. The free energies of IM and TS are higher than the free energies of reactants; therefore, it is feasible to calculate the reaction rate constant by using eqn (1).
3.5 Potential energy surfaces and rate constants in the liquid phase for the reaction of NH3 + OH + (H2O)13 → NH2 + H2O + (H2O)13
The experimental results of the reaction of NH3 with OH show that the liquid phase conditions can accelerate the reaction. In the discussion of the previous sections, the results after the involvement of (H2O)n (n = 1–3) in the NH3 + OH reaction showed that the liquid-phase environment did not promote the NH3 + OH reaction. The liquid phase environment is very complex, it is uncertain how many water clusters are involved in the reaction, in what form, and how many solvent molecules are required to achieve the solvent effect. In our calculations, since both OH and NH3 are polar molecules, the shielding effect of the first solvent shell on the reaction is significant. Therefore, we continued to increase the water clusters and did related tests for n = 5, n = 7, n = 8, etc. (the energy barriers and rate constants for the relevant reactions are shown in Table S8†). Then we found that when the water molecule was increased to 13, the dipole of a certain conformation changed and caused some effect on the rate. In the subsequent calculations, we did a study on the NH3 + OH reaction with the participation of (H2O)13, and Fig. 5 is the free energy diagram after the involvement of (H2O)13 in the NH3 + OH reaction. In Fig. 5, the free energy barrier of relative reactants for the reaction of NH3 and OH involving (H2O)13 is 9.1 kcal mol−1, which is less than the energy barrier (9.3 kcal mol−1) of the pure NH3 + OH reaction. This shows that the reaction of NH3 and OH can be promoted by the addition of (H2O)13 in the liquid phase. This is only one conformation, and there may be many more structures with the same effect as this conformation, as well as the conformation after the formation of the first solvent layer, and even the conformation of the higher solvent layers are certainly present. So we took (H2O)13 as an example to illustrate the shielding effect on the reaction rate.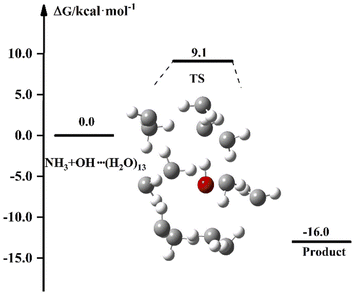 | ||
| Fig. 5 The free energy diagram for the NH3 + OH + (H2O)13 reaction at the M06-2X/6-311+G(2d,2p) level in the liquid phase. | ||
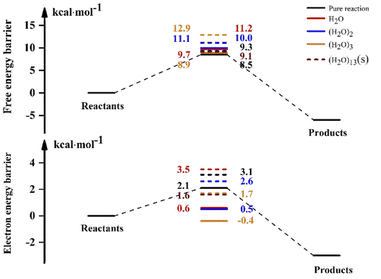
For the reaction in aqueous solution, the reactant is completely surrounded by water, and OH can be combined with aqueous clusters directly, that is, the equilibrium constant Keq1 is close to 1. In this way, the NH3 + OH reaction catalysed by water clusters in aqueous solution can be simplified to the bimolecular reaction of NH3 + OH·(H2O)n. We consider the NH3 and OH reactions involving (H2O)13 as ‘bimolecular reactions’, and for the convenience of comparison, we make the same approximation to the gas phase reaction. Then, the relative electron energy barrier, free energy barrier and reaction rate constants for the bimolecular reaction are listed in Table 6. At the same time, the corresponding reaction energy barrier diagrams are shown in Fig. 6. Here we did not calculate the total rate constant by eqn (1), but directly calculated the rate constant using the free energy barrier(ΔG′) of the transition state relative to the reactants (NH3 + OH·(H2O)n). k′ is the rate constant obtained using the above method. In Table 6, we can see that the rate constant after the addition of (H2O)n (n = 1–3) in the gas phase is smaller than the original reaction rate constant, indicating that the water clusters in the gas phase cannot accelerate the NH3 + OH reaction. In the liquid phase, the pure reaction rate constant is 3.84 × 10⁻¹⁴ cm3 molecule−1 s−1, and this result is smaller than the experimental value (5.84 × 10⁻¹² cm3 molecule−1 s−1) and the results (1.35 × 10⁻¹³ cm3 molecule−1 s−1) in Section 3.1, because the k′ calculated here is calculated directly using ΔG′ and does not consider the effect of precursor complex formation on the rate constant. In addition, the introduction of solvation electrostatic free energy will increase the energy barrier and reduce the reaction rate constant. In general, we can see from Table 6 that the rate constant of NH3 + OH·(H2O)13 in the liquid phase is 5.42 × 10⁻¹⁴ cm3 molecule−1 s−1, which is slightly larger than the rate constant (3.86 × 10⁻¹⁴ cm3 molecule−1 s−1) of the anhydrous reaction, this trend indicates that the liquid phase conditions promote the reaction of NH3 with OH.
| Gas | Liquid | |||||||
|---|---|---|---|---|---|---|---|---|
| ΔE | Δ(E + ZPE) | ΔG′ | k′ | ΔE | Δ(E + ZPE) | ΔG′ | k′ | |
| a ΔE (kcal mol−1) is the electron energy barrier relative to reactants (NH3 + OH·(H2O)n), Δ(E + ZPE) (kcal mol−1) is the electronic energy barrier including the zero-point energy, ΔG′ (kcal mol−1) is the free energy barrier relative to reactants (NH3 + OH·(H2O)n), k′ is the rate constant (cm3 molecule−1 s−1) obtained with ΔG′. | ||||||||
| Pure reaction | 2.7 | 2.1 | 8.5 | 1.49 × 10⁻¹³ | 3.5 | 3.1 | 9.3 | 3.86 × 10⁻¹⁴ |
| (H2O) | 0.1 | 0.6 | 9.7 | 2.10 × 10⁻¹⁴ | 4.2 | 3.5 | 11.2 | 1.56 × 10⁻¹⁵ |
| (H2O)2 | 0.8 | 0.5 | 10.0 | 1.13 × 10⁻¹⁴ | 3.1 | 2.6 | 11.1 | 1.84 × 10⁻¹⁵ |
| (H2O)3 | −0.4 | −0.4 | 8.9 | 7.71 × 10⁻¹⁴ | 1.3 | 1.7 | 12.9 | 8.85 × 10⁻¹⁷ |
| (H2O)13 | — | — | — | — | 1.8 | 1.6 | 9.1 | 5.42 × 10⁻¹⁴ |
Actually, the participation of water clusters in the NH3 + OH reaction considers part of the explicit solvent effect, and there may be more promotion when other explicit solvent effects are considered. Since the conformation of the explicit phase, and there will be more phenomena in the actual reactions. In addition, considering that the translational and rotational degrees of freedom of solute in solvent will be limited to a certain extent, this factor leads to a slight decrease in the free energy of the transition state compared with the free energy of the ‘bimolecular’ reactant, which increases the reaction rate. However, this factor can be considered only with the help of an explicit solvent model, which requires many calculations. The reaction rate calculated by classical solvation theory and rate theory is still available. Also, we considered the participation of different water clusters in the NH3 + OH reaction, and in principle the participation of water in the reaction would have a problem with the standard state,46–50 there would be a solvation energy of water (4.3 kcal mol−1). However, the number of water molecules is constant throughout our reaction and the corrections caused by reactants, transition states and products can cancel each other, so we did not add an additional correction factor to the free energy.
3.6 The proton transfer of the reaction of NH3 + OH → NH2 + H2O in aqueous solution
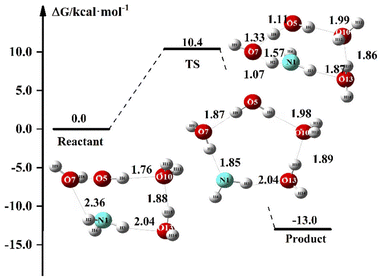
In the above discussion, NH3 can react directly with OH due to the strong oxidizing properties of OH. With the presence of numerous water molecules in aqueous solutions, OH may react with H2O. In this section, we discuss the proton transfer phenomenon of the NH3 + OH reaction in solution. Since the aqueous phase environment is very complex, we have discussed this issue using (H2O)3 as an example, and Fig. 7 shows the proton transfer energy path in the presence of (H2O)3 in the NH3 + OH reaction. Initially, NH3 is stably present in the NH3·OH·(H2O)3 complex. In the TS configuration, the strong oxidation of OH can clearly directly remove H from H2O, and at the same time, the newly formed OH will also remove H from NH3. The reaction of NH3 with OH is completed at the same time as the proton transfer.In Table 7, we list the proton transfer rate constant and energy for each part of the NH3·OH·(H2O)3 reaction. The electron energy barrier and the free energy barrier for proton transfer in this reaction are 10.0 and 10.4 kcal mol−1, respectively, and the rate constant is 2.51 × 10⁻¹⁶ cm3 molecule−1 s−1. The proton transfer process usually has a relatively significant tunneling effect,51 which will further increase the reaction rate of NH3 + OH. The NH3·OH·(H2O)3 reaction pathway is another reaction mechanism between NH3 and OH in an aqueous environment. Compared to the liquid phase rate constant (1.35 × 10⁻¹³ cm3 molecule−1 s−1) in Section 3.1, the NH3 + OH reaction under this mechanism is 3 orders of magnitude slower. This reaction pathway is an additional reaction mechanism that is a purely facilitative effect on the NH3 + OH reaction in the liquid phase and provides a new mechanism, although the rate constants in the conformation are not high. The presence of this proton transfer-like reaction mechanism in the liquid-phase environment makes the reaction of NH3 with OH in aqueous much more probable. It shows that the aqueous phase environment promotes the NH3 + OH reaction, consistent with our experimental results. Since these two reaction mechanisms are different, we cannot directly correct the previous rate constants. In general, the aqueous phase environment promotes the reaction of NH3 with OH.
| TS | Product | |
|---|---|---|
| a ΔE is the electron energy relative to the reactant, ΔG is the free energy relative to the reactant, k is the proton transfer rate constant calculated using the free energy barrier. | ||
| ΔE | 10.0 | −12.7 |
| ΔG | 10.4 | −13.5 |
| K | 2.51 × 10⁻¹⁶ | |
In a water environment, the radical reaction of NH3 + OH, a reactant with large polarity, is very complex. Based on CCSD(T) and DFT methods, the gas-phase rate of this reaction is not different from the experimental value. Under the implicit solvent model, the liquid phase rate is lower than the experimental value. The reaction itself is approximately 30 times faster in the liquid phase than in the gas phase. When we consider the participation of (H2O)n (n = 1–3) in the NH3 + OH reaction, the addition of (H2O)n (n = 1–3) decreases the rate constant by 2–3 orders of magnitude and 0–2 orders of magnitude in the liquid and gas phases at the M06-2X/6-311+G(2d,2p) level and decreases the rate constant by 1–4 orders of magnitude at the CCSD(T)-F12a/cc-pVDZ-F12//M06-2X/6-311+G(2d,2p) level in the gas phase. The involvement of (H2O)n (n = 1–3) in the reaction does not indicate that the liquid phase environment can promote the reaction of NH3 with OH. In the subsequent calculations, when n = 13, we can see that the rate constant is larger than the rate constant of the pure reaction, this trend indicates that the liquid phase conditions can accelerate the NH3 + OH reaction. In addition, the occurrence of proton transfer in solution also indicates that the liquid phase conditions can facilitate the NH3 + OH reaction. In summary, we used an implicit solvent model combined with a partially explicit solvent model to calculate the liquid-phase reaction rates. The liquid-phase reactions are very complex, so we approximated calculated the liquid-phase NH3 + OH reaction rate constants by considering the implicit solvent model, the addition of solvent molecules, and proton transfer. In the subsequent work, the calculation of the liquid-phase reaction can be further improved by using the explicit solvent model or other methods to obtain better results.
4. Conclusions
In order to consider the effect of aqueous solution on NH3 + OH reaction, we perform ab initio calculations for the water cluster-catalysed NH3 + OH reaction at the CCSD(T)-F12a/cc-pVDZ-F12//M06-2X/6-311+G(2d,2p) and M06-2X/6-311+G(2d,2p) levels for the gas phase and liquid phase, respectively. Firstly, we expect that the title reaction will show the characteristics of liquid phase reaction with the increase of the size of water clusters involved in the reaction. But the participation of (H2O)n (n = 1–3) in the NH3 + OH reaction decreases the rate constants comparing with the pure reaction. This result is contrary to the experimental result that the liquid phase reaction rate is greater than the gas phase reaction rate. When we use the implicit solvent model to calculate the NH3 + OH reaction rate, the calculated results are still different from the experimental trend. Finally, we calculated the reaction rate with water clusters in the implicit solvent model. When the size of the water cluster surrounding OH radical is small, the theoretical reaction rate is still small. When the size of water cluster reaches n = 13, the calculated reaction rate begins to approach the experimental results. From the point of view of solvation model, both OH and NH3 have large dipole moments. The implicit solvent model is easy to overestimate the solvation free energy of reactants, resulting in significantly underestimating the reaction rate. When the water cluster surrounding the dipole increases, a more reasonable solvation energy correction will be obtained, and the calculated reaction rate is more reliable. In addition, our calculations also show that the proton transfer phenomenon present in the aqueous solution is also a factor that accelerates the reaction of NH3 with OH. The liquid phase reactions in real situations are very complex. Although this paper attempts to consider the role of various conformational water clusters and solvation electrostatic interactions, many conformations and other types of solvation effects are still not considered. For similar liquid phase reactions, more calculations need to be done in subsequent work, such as considering the first solvent layer or more solvent layers. For the implicit solvent model, the solvation radius of different atoms can be adjusted to make it suitable for the reaction involving free radicals, while the reasonable adjustment of the solvation radius requires more relevant calculations.Conflicts of interest
The authors declare no conflicts of interest.Acknowledgements
The authors gratefully acknowledge financial support from the National Natural Science Foundation of China (92060101), the Sichuan Province Science Fund for Distinguished Young Scholars (2021JDJQ0011) and the Science Fund from Sichuan University (2021SCUNL104).References
- X. Giménez, M. Moreno and J. M. Lluch, Chem. Phys., 1992, 165, 41–46 CrossRef.
- M. Vahedpour, H. Douroudgari, S. Afshar and S. Asgharzade, Chem. Phys., 2018, 507, 51–69 CrossRef CAS.
- J. C. Corchado, J. Espinosa-Garcia, W.-P. Hu, I. Rossi and D. G. Truhlar, J. Phys. Chem., 1995, 99, 687–694 CrossRef CAS.
- E. W. G. Diau, T. L. Tso and Y. P. Lee, J. Phys. Chem., 1990, 94, 5261–5265 CrossRef CAS.
- X. Han, Z. Wang, M. Costa, Z. Sun, Y. He and K. Cen, Combust. Flame, 2019, 206, 214–226 CrossRef CAS.
- E. C. Okafor, Y. Naito, S. Colson, A. Ichikawa, T. Kudo, A. Hayakawa and H. Kobayashi, Combust. Flame, 2018, 187, 185–198 CrossRef CAS.
- S. Gligorovski, R. Strekowski, S. Barbati and D. Vione, Chem. Rev., 2015, 115, 13051–13092 CrossRef CAS PubMed.
- H. J. H. Fenton, J. Chem. Soc., Trans., 1894, 65, 899–910 RSC.
- F. Haber and J. J. Weiss, Proc. R. Soc. A, 1934, 147, 332–351 CAS.
- R. L. Schwartz, G. E. Davico, J. B. Kim and W. Carl Lineberger, J. Chem. Phys., 2000, 112, 4966–4973 CrossRef CAS.
- J. Corchado, F. Olivares del Valle and J. Espinosa-Garcia, J. Phys. Chem., 1993, 97, 9129–9132 CrossRef CAS.
- J. Espinosa-Garcia, J. Corchado and M. Sana, J. Chim. Phys., 1993, 90, 1181–1200 CrossRef CAS.
- G. Nyman, J. Chem. Phys., 1996, 104, 6154–6167 CrossRef CAS.
- M. Monge-Palacios, C. Rangel and J. Espinosa-Garcia, J. Chem. Phys., 2013, 138, 084305 CrossRef CAS PubMed.
- L. Huang, L. Li, W. Dong, Y. Liu and H. Hou, Environ. Sci. Technol., 2008, 42, 8070–8075 CrossRef CAS PubMed.
- S. H. Baek, H.-S. Shim, J. G. Kim and D. H. Hur, Nucl. Eng. Des., 2019, 345, 85–93 CrossRef CAS.
- B. Hickel and K. Sehested, Radiat. Phys. Chem., 1992, 39, 355–357 CrossRef CAS.
- R. A. Perry, R. Atkinson and J. N. Pitts, J. Chem. Phys., 1976, 64, 3237–3239 CrossRef CAS.
- J. A. Silver and C. E. Kolb, Chem. Phys. Lett., 1980, 75, 191–195 CrossRef CAS.
- R. D. Stephens, J. Phys. Chem., 1984, 88, 3308–3313 CrossRef CAS.
- J. Espinosa-García and J. Corchado, J. Chem. Phys., 1994, 101, 8700–8708 CrossRef.
- T. Zhang, K. Zhai, Y. Zhang, L. Geng, Z. Geng, M. Zhou, Y. Lu, X. Shao and M. Lily, Comput. Theor. Chem., 2020, 1176, 112747 CrossRef CAS.
- A. Rognoni, R. Conte and M. Ceotto, Chem. Sci., 2021, 12, 2060–2064 RSC.
- G. Schwaab, R. P. de Tudela, D. Mani, N. Pal, T. K. Roy, F. Gabas, R. Conte, L. D. Caballero, M. Ceotto and D. Marx, Phys. Rev. Lett., 2022, 128, 033001 CrossRef CAS PubMed.
- F. N. Pansini and A. J. Varandas, Chem. Phys. Lett., 2022, 139739 CrossRef CAS.
- M. P. DeMatteo, J. S. Poole, X. Shi, R. Sachdeva, P. G. Hatcher, C. M. Hadad and M. S. Platz, J. Am. Chem. Soc., 2005, 127, 7094–7109 CrossRef CAS.
- G. Pramod, K. Prasanthkumar, H. Mohan, V. Manoj, P. Manoj, C. Suresh and C. Aravindakumar, J. Phys. Chem. A, 2006, 110, 11517–11526 CrossRef CAS PubMed.
- J. Ho, A. Klamt and M. L. Coote, J. Phys. Chem. A, 2010, 114, 13442–13444 CrossRef CAS.
- G. Scalmani, V. Barone, G. A. Petersson, H. Nakatsuji, et al., Gaussian 09, Gaussian Inc., Wallington, CT, 2016 Search PubMed.
- H. Werner, P. Knowles, G. Knizia, F. Manby and M. Schütz, et al., MOLPRO, version 2010.1, A package of ab initio programs, 2010, See http://www.molpro.net Search PubMed.
- Y. Zhao and D. G. Truhlar, Theor. Chem. Acc., 2008, 120, 215–241 Search PubMed.
- Y. Zhao and D. G. Truhlar, J. Chem. Phys., 2006, 125, 194101 CrossRef PubMed.
- B. Roux and T. Simonson, Biophys. Chem., 1999, 78, 1–20 CrossRef CAS.
- T. B. Adler, G. Knizia and H.-J. Werner, J. Chem. Phys., 2007, 127, 221106 CrossRef PubMed.
- C. Gonzalez and H. B. Schlegel, J. Chem. Phys., 1989, 90, 2154–2161 CrossRef CAS.
- K. Fukui, Acc. Chem. Res., 1981, 14, 363–368 CrossRef CAS.
- T. Zhang, K. Wang, Z. Qiao, Y. Zhang, L. Geng, R. Wang, Z. Wang, C. Zhao and L. Jin, RSC Adv., 2018, 8, 37105–37116 RSC.
- J. Wu, L. G. Gao, Z. Varga, X. Xu, W. Ren and D. G. Truhlar, Angew. Chem., 2020, 132, 10918–10922 CrossRef.
- S. Kozuch and J. M. Martin, ChemPhysChem, 2011, 12, 1413–1418 CrossRef CAS PubMed.
- J. R. Murdoch, J. Chem. Educ., 1981, 58, 32 CrossRef CAS.
- H. Eyring, J. Chem. Phys., 1935, 3, 107–115 CrossRef CAS.
- S. Emamian, T. Lu, H. Kruse and H. Emamian, J. Comput. Chem., 2019, 40, 2868–2881 CrossRef CAS PubMed.
- N. Myllys, J. Elm and T. Kurten, Comput. Theor. Chem., 2016, 1098, 1–12 CrossRef CAS.
- R. Zhao, D. Gao, X. Pan, W. Xia, H. Yu, S. Yu and L. Yao, Chem. Phys. Lett., 2018, 703, 97–105 CrossRef CAS.
- Y. Shao, L. Yao, Y. Mao and J. Zhong, Chem. Phys. Lett., 2010, 501, 134–139 CrossRef CAS.
- D. Asthagiri, L. R. Pratt and H. Ashbaugh, J. Chem. Phys., 2003, 119, 2702–2708 CrossRef CAS.
- A. Ben-Naim and Y. Marcus, J. Chem. Phys., 1984, 81, 2016–2027 CrossRef CAS.
- G. Hummer, L. R. Pratt and A. E. Garcia, J. Phys. Chem., 1996, 100, 1206–1215 CrossRef CAS.
- Y. Marcus, Biophys. Chem., 1994, 51, 111–127 CrossRef CAS.
- R. L. Martin, P. J. Hay and L. R. Pratt, J. Phys. Chem. A, 1998, 102, 3565–3573 CrossRef CAS.
- P. M. Kiefer and J. T. Hynes, J. Phys. Org. Chem., 2010, 23, 632–646 CrossRef CAS.
Footnote |
| † Electronic supplementary information (ESI) available. See https://doi.org/10.1039/d2ra04931g |
| This journal is © The Royal Society of Chemistry 2022 |

