DOI:
10.1039/D2RA04671G
(Paper)
RSC Adv., 2022,
12, 27666-27678
Electronic, mechanical and piezoelectric properties of glass-like complex Na2Si1−xGexO3 (x = 0.0, 0.25, 0.50, 0.75, 1.0)
Received
26th July 2022
, Accepted 27th August 2022
First published on 28th September 2022
Abstract
Motivated by our previous work on pristine Na2SiO3, we proceeded with calculations on the structural, electronic, mechanical and piezoelectric properties of complex glass-like Na2Si1−xGexO3 (x = 0.0, 0.25, 0.50, 0.75, 1.0) by using density functional theory (DFT). Interestingly, the optimized bond lengths and bond angles of Na2SiO3 and Na2GeO3 resemble each other with high similarity. On doping we report the negative formation energy and feasibility of transition of Na2SiO3 → Na2GeO3 while the structural symmetry is preserved. Analyzing the electronic profile, we have observed a reduced band gap on increasing x = Ge concentration at Si-sites. All the systems are indirect band gap (Z–Γ) semiconductors. The studied systems have shown mechanical stabilities by satisfying the Born criteria for mechanical stability. The calculated results have shown highly anisotropic behaviour and high melting temperature, which are a signature of glass materials. The piezoelectric tensor (both direct and converse) is computed. The results thus obtained predict that the systems under investigation are potential piezoelectric materials for energy harvesting.
1 Introduction
Wide band gap semiconductor materials have attracted a great deal of attention due to the possibility of band gap engineering, either by doping with heavier elements or by making oxygen vacancy defects so as to improve their performance towards different applications and different tasks.1,2 In recent years, theoretical and experimental insight into novel silica (SiO2) based glass-like materials has become a fascinating topic among researchers due to their high mechanical as well as thermodynamical stability, low thermal conductivity and abundance in nature.3,4 Further refinements of such properties through the manufacturing processes and chemical compositions have improved their thermal, pressure and chemical resistivity, and transparency, which has made them reliable and suitable materials for different applications and feasible materials for a wide range of devices.5–13 As far as we are aware, within the surveyed literature most of the important glasses are silicate glass having high content of silica (SiO2) or quartz.14–16 As reported, silicate glasses have high technological importance in industry and in commercial applications: battery and storage systems, opto-electronic devices, and auxetic materials having high performances in the fields of bio-medicine, surgical implants and piezoelectric sensors and actuators, fireproof fabrics, optical fibres, lighting technology, and many more.17–21 The pioneering work of Randall et al.22 suggested that silicate glass structures were thought to be well understood at a local level and reported that vitreous silica probably consists of small crystals of cristobalite that were formed at very high temperatures by performing an experimental investigation using X-ray diffraction (XRD). Zachariasen et al.23 have investigated heat-treated specimens by using XRD and reported a complex silicate glass structure. The vitreous forms of silica showed the relative orientation of two oxygen tetrahedra to form a network of SiO2 characterized by an extended three dimensional network which lacked symmetry and periodicity. The structure was well delineated by the continuous random network (CRN). It was also reported that the network of vitreous silica was built up of oxygen tetrahedra that surround the silicon atom. However, in the vitreous form of silica, the relative orientation of two tetrahedra with a common corner may vary within a wide limit and oxygen to oxygen atom bond angles may also vary throughout the whole network. Thus, the glassy phases of SiO2 that consist of Si–O tetrahedra nonetheless have bond-angle disorder both in O–Si–O and Si–O–Si angles.23–26
The structural profile and the atomic arrangement of silicate glasses are well investigated by both experimental and computational methods.27–30 The most common superlative experimental set-ups employed for determination of many fingerprints of the structures were: Raman spectroscopy, extended X-ray absorption fine structure (EXAFS) spectroscopy, nuclear magnetic resonance (NMR), neutron diffraction and so on.31–40 The experimental studies mainly highlighted the structure of silicate glasses and were mostly defined by the medium range or short range order (MRO or SRO), i.e., the order over distances comparable to inter-atomic distances, and lacked long-range order (LRO) leading to more complications and challenges when examining the structural properties. In alkali-silicates such as Na2SiO3, the Na+ cations progress towards the non-bridging oxygen (NBO) making weak ionic bonds that result in the formation of sodium meta-silicate. The NBO in the structure comprises one half of the permanently broken oxygen bond due to the alkali Na+ ions that destroy the Si–O–Si bridging bonds (BO).41–43 Experimental work on sodium oxide-silica obtained from the sodium–concrete reaction (SCR) method and XRD measurement have revealed the formation of Na2SiO3 etc.44 As a matter of fact, the experimental works are limited to structural and electronic studies. In order to analyze the desired functional properties and investigate these materials at the atomic-scale, computational methods have become a major tool. Computational techniques such as reverse Monte Carlo, ab initio molecular dynamics (AIMD) based on density functional theory (DFT) and classical molecular dynamics (MD) are the most frequently employed simulation methods for such investigations.45–47 More recently, methods that include pre-available experimental data such as force enhancement atomic refinement (FEAR) have been used by Pandey et al.48 for structural modeling of amorphous Si and SiO2 using the reverse Monte Carlo approach where they acquired authentic structures.
The structure of Na2GeO3 was first determined by Ginetti49 who revealed the crystal structure of Na2GeO3 by means of radio-crystallographic study with residual factor (R) = 28%. Later refinement was carried out by Vollenkle et al.50 with R = 4.4% and the mean Ge–O distances in the Na2GeO3 chain were found to be 1.836 Å for the bridging oxygen atom and 1.713 Å for the terminal oxygen atom and an average value of 2.39 Å was calculated for the Na–O distances. A recent experimental work on the preparation of Na2GeO3 was reported by Cruickshank51 by re-growing the crystals and collected 1083 reflexions by using a Syntex diffractometer. From this work, it was observed that pristine Na2GeO3 existed in an orthorhombic crystal structure with space group Cmc21 and the mean bond lengths of Ge–O (bridging) = 1.800 Å and Ge–O (non-bridging) = 1.712 Å, and Ge–O–Ge bond angle = 124.6°. Moreover, system transformation of Li2GeO3 → Na2GeO3 and Li2SiO3 → Na2SiO3 was reported by West et al.52 where the starting compounds were reagent grade Li2CO3 and Na2CO3, and electronic grade GeO2. The mixture was then heated in an electric muffle furnace at 850 °C and the final product of the reaction was checked by using Guinier X-ray powder methods.
As far as we know, the theoretical and experimental insights into the structural and electronic properties of Na2SiO3 are well explored.53 So, in this work, the main focus of the study will be investigation of the transformation of Na2SiO3 → Na2GeO3 and the modulation of the electronic and mechanical properties by Ge doping at Si-sites using DFT.
2 Computational details
The computational simulations and calculations were performed within the framework of density functional theory (DFT) using the linear combination of Gaussian-type functions (GTF) to describe the crystal orbitals, as implemented in the CRYSTAL17 code,54 adopting the Perdew–Burke–Ernzerhof (PBE) exchange–correlation functional.55 The sodium (Na), silicon (Si) and oxygen (O) atomic centers were described by a revised triple-zeta valence plus polarization (TZVP) basis set, developed by Oliveira et al.,56 and the dopant, i.e., germanium (Ge) was described by a TZVP basis set developed by Peintinger and co-workers.57 For the structural optimization, the accuracy of the convergence criteria for the bi-electronic integrals was controlled by a set of five thresholds (10−7, 10−7, 10−7, 10−7, 10−14), and these represent the overlap and penetration for Coulomb integrals, the overlap for HF exchange integrals, and the pseudo-overlap, respectively. The energy convergency was considered when the energy difference of two consecutive thresholds was lower than 10−7 Ha, and the shrinking factor (Pack–Monkhorst and Gilat net) was set to 12 × 12 × 12.58 The structural convergence was checked on the gradient components and nuclear displacements with tolerances on their root mean square set to 0.0001 and 0.0004 a.u., respectively.
All stationary points were characterized as minima by diagonalizing the Hessian matrix with respect to atomic coordinates and unit cell parameters, and analyzing the vibrational phonon modes at the high-symmetry points of the first Brillouin zone,58 using the numerical second derivatives of the total energies estimated with the coupled perturbed Hartree–Fock/Kohn–Sham algorithm. Also, it is worth highlighting that the electronic properties extracted were obtained using the same k-point sampling employed for the diagonalization of the Fock matrix in the optimization process. The pristine sodium silicate consists of a unit cell of 12 atoms, which contains 4 sodium (Na), 2 silicon (Si) and 6 oxygen (O) atoms, which have an orthorhombic phase symmetry, and belongs to the Cmc21 space group,27,28,59 and has experimental lattice parameters a = 10.480 Å, b = 6.070 Å and c = 4.820 Å [see Table 1]. To model and study Na2Si1−xGexO3, with the concentration of Ge, x = 0, 0.25, 0.50, 0.75 and 1.0, a 2 × 1 × 1 supercell was built that contains 24 atoms. Each of the doped systems were optimized to investigate the structural, electronic, mechanical and piezoelectric properties.
Table 1 Calculated optimised lattice parameters of the Na2SiO3 unit cell (12-atoms) compared to B3LYP (Belmonte et al.28), PBE (Cuautli et al.29), LDA (Liu et al.)30 and experimental values (McDonald et al.27). Here, the relative errors are calculated with respect to the experimental data
| Parameters |
PBE-GGA (this work) |
B3LYP28 |
PBE29 |
LDA30 |
Exp.27 |
| a (Å) |
10.683 ± 1.94 |
10.568 |
10.630 |
10.446 |
10.480 |
| b (Å) |
6.172 ± 1.68 |
6.098 |
6.160 |
6.030 |
6.070 |
| c (Å) |
4.892 ± 1.49 |
4.852 |
4.880 |
4.710 |
4.820 |
| V (Å3) |
322.559 ± 5.01 |
312.681 |
319.546 |
296.680 |
306.60 |
3 Results and discussion
3.1 Structural properties and dynamical stabilities
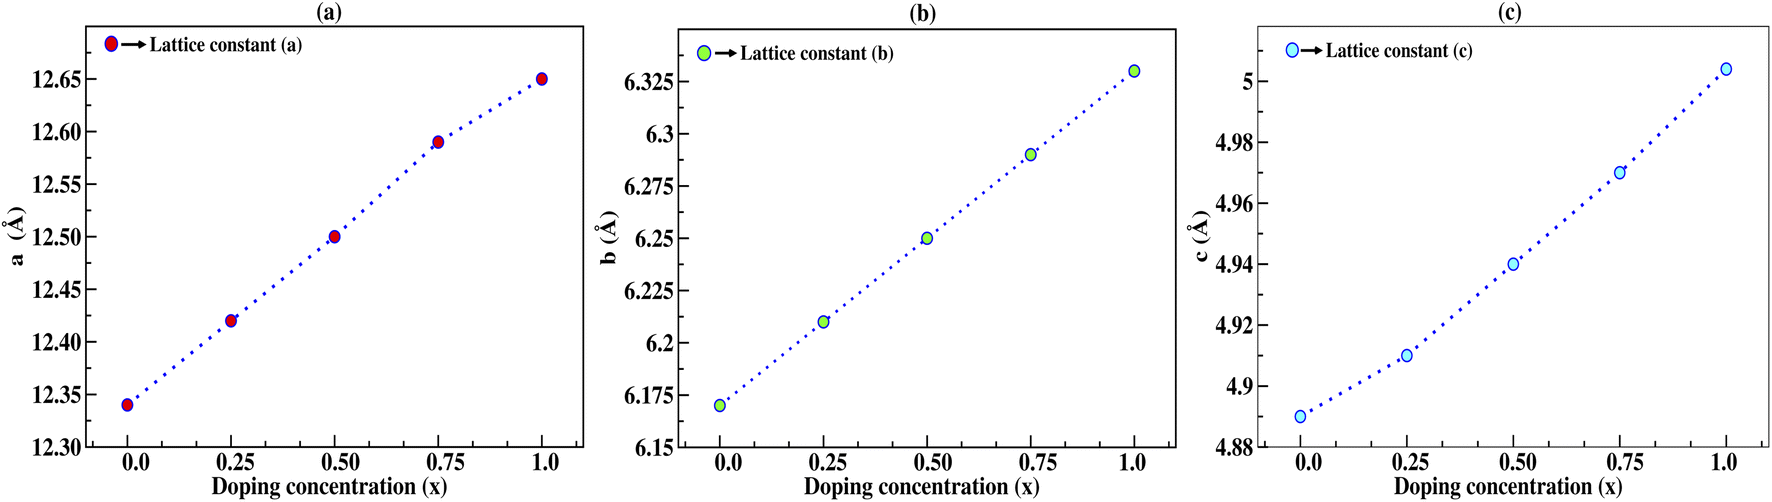
In this section, we discuss the structural properties of sodium silicate upon performing doping with germanium (Ge) on the silicon (Si) site. As previously mentioned in the Computational details section, it has to be noted that, as the constructed supercells are asymmetric supercells (i.e., supercells of 2 × 1 × 1 such that the number of atoms is 24 atoms), the optimised structures for all different percentage doping levels given as Na2Si1−xGexO3 (x = 0.0, 0.25, 0.50, 0.75, 1.0) are in the lowest possible primitive symmetry with space group P1, since the building of the supercell affects the environment of the atoms in a certain direction. Fig. 1 shows the emergence of different doped structures via the supercell method along the x-axis. It has not only lowered the symmetry to the triclinic P1 space group but also has a large effect on the lattice parameter ‘a’, while the effect on ‘b’ and ‘c’ is almost negligible (see Table 2). It is obvious that whenever doping with heavier atoms is performed on a crystal structure, the lattice parameters along all the axes should increase due to the larger atomic radius of the dopant atom (i.e., the atomic size of Ge is larger than that of Si). This study has elucidated the increase in lattice parameters with the increase in doping concentration [see Fig. 2].
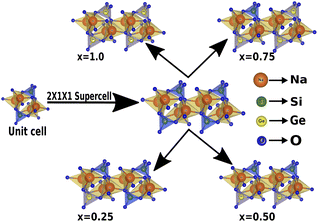 |
| | Fig. 1 Building the asymmetric supercell of 2 × 1 × 1 from the Na2SiO3 unit cell and doping the Si site with Ge. | |
Table 2 Calculated lattice parameters in Å and the change in lattice parameters of the supercell structure with 12-atoms in Å under different doping concentrations
| Doping concentration (x) |
a |
b |
c |
Δa |
Δb |
Δc |
| Unit cell |
10.683 |
6.172 |
4.892 |
0 |
0 |
0 |
| 0.0 |
12.337 |
6.168 |
4.892 |
1.654 |
−0.004 |
0 |
| 0.25 |
12.414 |
6.209 |
4.912 |
1.731 |
0.037 |
0.020 |
| 0.50 |
12.502 |
6.252 |
4.937 |
1.819 |
0.080 |
0.045 |
| 0.75 |
12.590 |
6.285 |
4.964 |
1.907 |
0.113 |
0.072 |
| 1.0 |
12.651 |
6.325 |
5.004 |
1.968 |
0.153 |
0.112 |
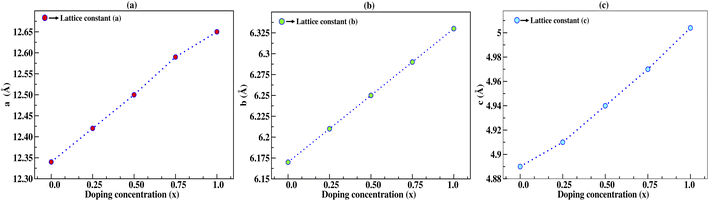 |
| | Fig. 2 Lattice constants a, b, and c in Å as a function of doping concentration (x) of germanium (Ge), where the lattice constants increase with increasing doping concentration. | |
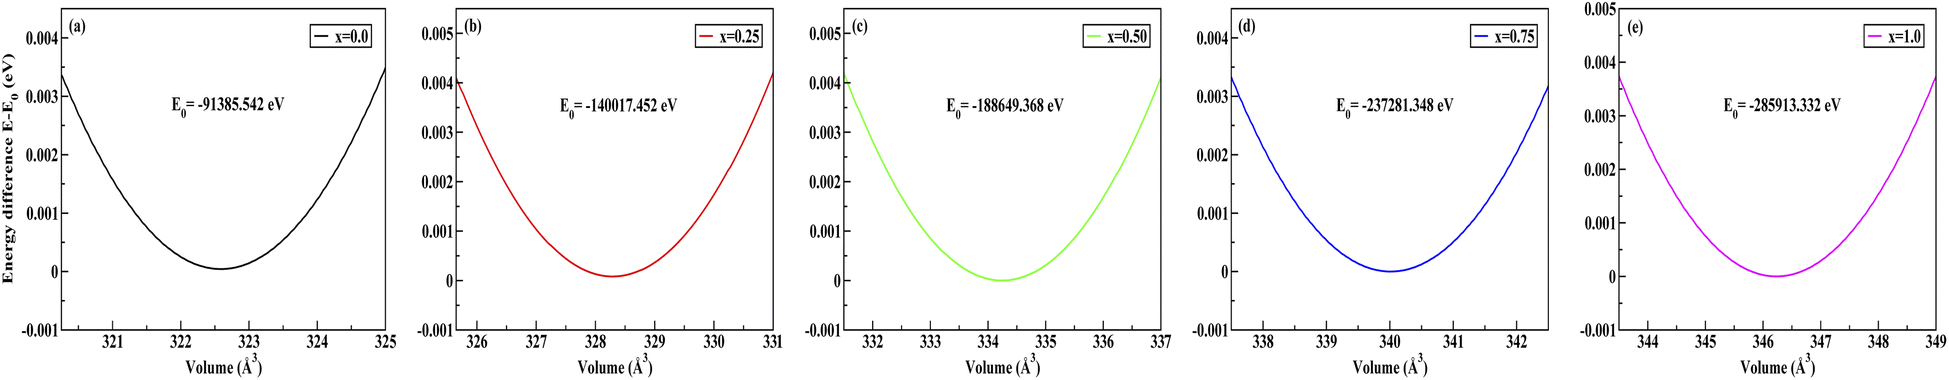
To obtain the most stable structure of all the systems we have calculated the total energy corresponding to each unit cell volume (lattice parameters). The data of total energy and unit cell volume are fitted to the Birch–Murnaghan equation of states to obtain a smooth parabolic curve as shown in Fig. 3. The Birch–Murnaghan equation60,61 is given as
| |
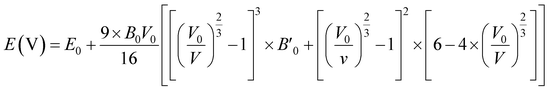 | (1) |
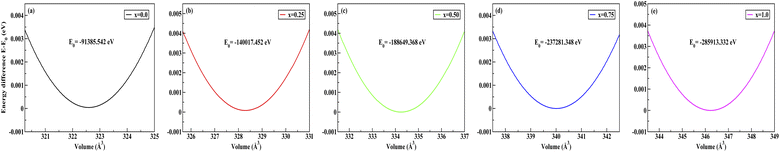 |
| | Fig. 3 Difference in energy (E − E0) eV versus volume (Å3) graphs from equation of state calculations adopting Birch–Murnaghan fitting for obtaining the most stable optimized volume at x = (a) 0.0, (b) 0.25, (c) 0.50, (d) 0.75, (e) 1.0. E0 indicates the minimum ground state energy. | |
Fitting the smooth curve from the equation of states at temperature = 0 K and pressure = 0 GPa gives the optimized lattice parameters including the cell bulk modulus. The bulk modulus (B) evaluates the magnitude of the average bond strength in the crystal. The bulk modulus decreases with the increase in doping concentration, which indicates a reduction in the average valence bond strength [see Tables 3 and 4]. The optimized result of Na2SiO3 with 12 atoms in the unit cell is in the orthorhombic Cmc21 space group and in good agreement with the previously reported results.27–29,51 The optimised lattice parameters are a = 10.683 Å, b = 6.172 Å and c = 4.892 Å, with an optimised volume of V = 322.559 Å3. The calculated lattice parameters ‘a’, ‘b’ and ‘c’ are comparable to those of the previously reported theoretical results from PBE as the exchange correlation functional,29,53 the Becke 3-parameter,28 the Lee–Yang–Parr (B3LYP) functional,30 and the experimental data obtained by McDonald et al.27
Table 3 Calculated bond lengths (in Å) and bond angles (in °) of Na2Si1−xGexO3. Here, O → bridging oxygen, O′ → non-bridging oxygen and x is the doping concentrationa
| Structural parameters |
Unit cell (12 atoms) |
x |
| 0 |
0.25 |
0.50 |
0.75 |
1.0 |
| *a and *b represent ref. 27 and 51 respectively. |
| Bond length (in Å) |
| Si–O |
1.73 |
1.73 |
1.73 |
1.74 |
1.74 |
— |
| 1.672*a |
|
|
|
|
|
| Si–O′ |
1.64 |
1.64 |
1.64 |
1.64 |
1.64 |
— |
| 1.592*a |
|
|
|
|
|
| Ge–O |
— |
— |
1.85 |
1.85 |
1.86 |
1.86 |
| |
|
|
|
|
1.80*b |
| Ge–O′ |
— |
— |
1.75 |
1.75 |
1.75 |
1.75 |
| — |
|
|
|
|
1.721*b |
| O–O |
2.68 |
|
|
|
|
|
| 2.619*a |
|
|
|
|
|
| O′–O′ |
2.81 |
|
|
|
|
|
| 2.714*a |
|
|
|
|
|
| |
| Bond angle (in °) |
| O′–Si–O′ |
117.6 |
117.6 |
117.9 |
117.7 |
117.7 |
— |
| 116.89*a |
|
|
|
|
|
| O–Si–O′ |
106.3 |
106.3 |
106.3 |
106.2 |
106.2 |
— |
| 107.07*a |
|
|
|
|
|
| O′–Ge–O′ |
— |
— |
118.5 |
118.7 |
118.5 |
118.8 |
| |
|
|
|
|
118.9*b |
| O–Ge–O′ |
— |
— |
105.1 |
105.3 |
105.2 |
105.2 |
| |
|
|
|
|
105.6*b |
Table 4 Calculated formation energies (Eform) and bulk modulus (B) for Na2Si1−xGexO3 (x = 0.0, 0.25, 0.50, 0.75, 1.0) calculated from the equation of states at T = 0 K and P = 0 GPa, and their corresponding changes with respect to x = 0.0
| x |
Eform (in eV) |
B (in GPa) |
|ΔEform| |
|ΔB| |
| 0.0 |
−2.478 |
62.26 |
0 |
0 |
| 0.25 |
−2.407 |
60.00 |
0.071 |
2.26 |
| 0.50 |
−2.336 |
58.91 |
0.142 |
3.35 |
| 0.75 |
−2.267 |
56.75 |
0.211 |
5.51 |
| 1.0 |
−2.198 |
54.87 |
0.28 |
7.39 |
For further confirmation of the structural stability we have calculated the formation energies (Eform)62 by using eqn (2) given below
| |
 | (2) |
where
z indicates the number of atoms (Na, Si, Ge, O) and
x = 0.0, 0.25, 0.50, 0.75, 1.0. The negative values of the calculated formation energies revealed the ground state structural stability of all the systems which implies the realization of experimental synthesis. The magnitude of
Eform decreases as the doping concentration increases, which indicates the instability of doped structures.
The comparative results of the optimized lattice parameters and the previously reported data are tabulated in Table 1. From Table 1, it can be seen that our calculated volume is 3.06%, 0.93%, 8.02% and 4.95% larger than those reported by Belmonte et al.,28 Cuautli et al.,29 Liu et al.30 and McDonald et al.27 respectively. The dissimilarities of volumes are due to the well-known effect of the PBE exchange–correlation in the GGA.
In the glassy phases of silica (SiO2) and germanium dioxide (GeO2) containing Na2O, the structural hallmarks are the presence of tetrahedral chains.63,64 The existence of Na2O depolymerizes the tetrahedral chain networks by breaking the Si–BO–Si and Ge–BO–Ge bonds, forming non-bridging oxygen (NBO) atoms.65,66 To understand the atomic arrangement inside the unit cells for different doping concentrations and the pristine compound (unit cell with 12 atoms), we have calculated the bond lengths and bond angles for both BO and NBO as presented in Table 3. We report the negligible deformation of bond lengths and bond angles while increasing the Ge concentration, confirming the structural similarities between Na2SiO3 and Na2GeO3. Similar findings have been reported by Cruickshank.51 From Table 3, we have noticed the larger bond lengths of X–BO as compared to X–NBO (where X = Si or Ge). This may be attributed to excess charge transfer to NBO, one of the characteristic features of glass silica. In sodium silicate and sodium germanate, the presence of electropositive cations minimized the bonding potentials, resulting in an appreciable difference in the lengths of bridging and non-bridging bonds. Also, our calculations show that the BO–BO and NBO–NBO bond lengths are consistent throughout the doping concentrations and these bond lengths are comparable to the experimental results [see Table 3].
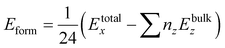
In order to probe the dynamical stability of the compounds, the phonon dispersion curves along the high symmetry Γ, X, R, Z, Y, Γ directions in the Brillouin zone (BZ) are calculated as shown in Fig. 4. Since the unit cell consists of 24 atoms for each doped system, we obtain 72 branches in the phonon dispersion curve. Clearly from Fig. 4, all the phonon modes are real which suggests the dynamical stability of the studied phases against any arbitrary finite displacement of the atoms about their mean positions.
 |
| | Fig. 4 (a–e) Phonon dispersion curves of Na2Si1−xGexO3 (x = 0.0, 0.25, 0.50, 0.75, 1.0), which show positive values for all x, indicating the materials’ dynamical stability. | |
3.2 Electronic properties
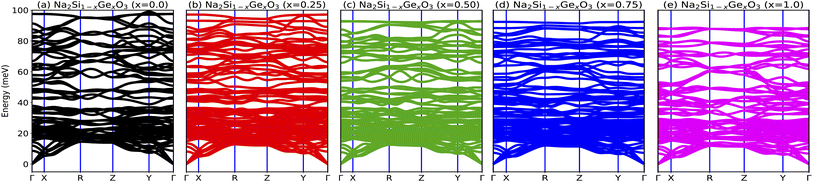
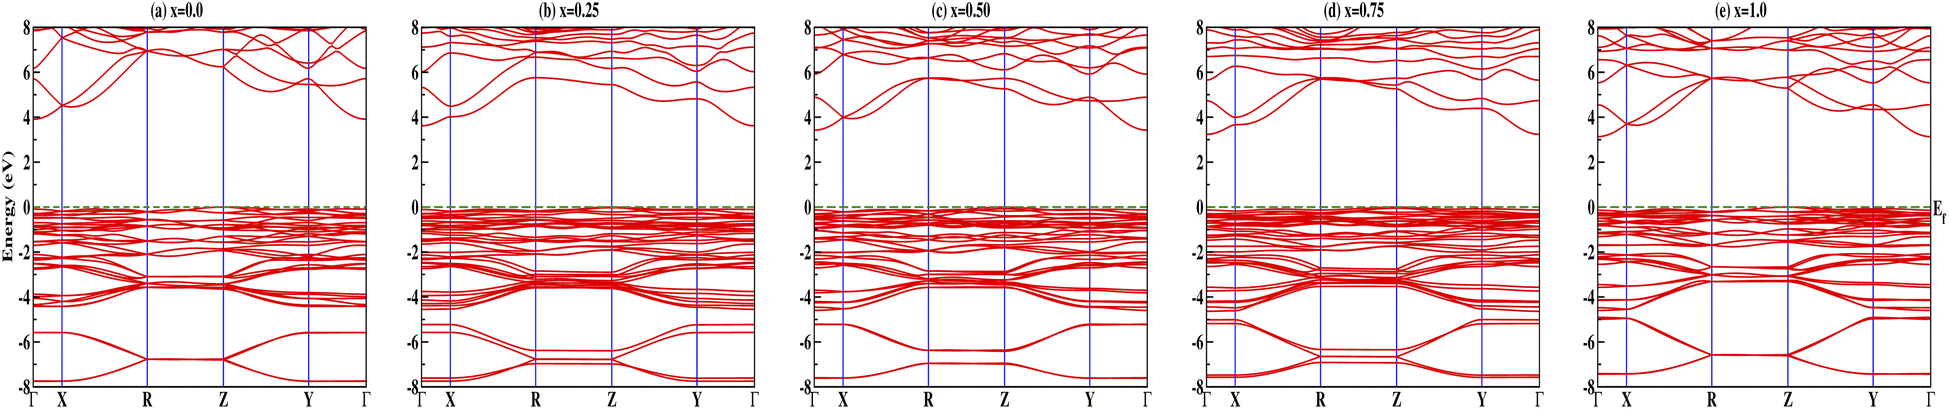
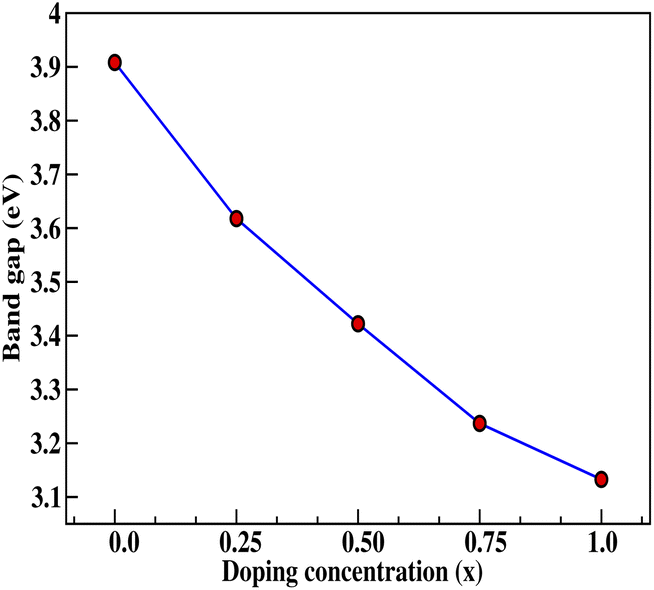
Insight into the atomic-scale interactions in any material is provided by the electronic properties. In this section, we present the detailed investigations of the electronic properties of Na2Si1−xGexO3 by calculating the band structures and the density of states (DOS) [see Fig. 5 and 6]. Our results are in good agreement with the previously reported ones.25,30,42,65,67 From Fig. 5, we can see a small dispersion at the top of the valence band regions (VB), while for the bottom of the conduction band regions (CB), the electronic bands are largely dispersed for all different doping concentrations. The top of the valence band lies close to the Fermi energy (EF), suggesting p-type semiconducting behaviour. For all concentrations, the highest energy state of the valence band is located at the Z-symmetry point while the lowest energy state of the conduction band is at the Γ-symmetry point. The presence of Z–Γ-symmetry in all doped systems indicates an indirect bandgap semiconductor. Our studies agreed well with the previously reported results of Lui et al.30 for the ab initio total-energy obtained with the local density approximation (LDA) via a preconditioned conjugate gradient algorithm. Recently, Baral et al.42 reported the electronic structure calculations of (Na2O)x(SiO2)1−x (x = 0.0, 0.1, 0.2, 0.3, 0.4, 0.5) by using the VASP code adopting the orthogonal linear combination of atomic orbitals (OLCAO) approach and reported a decrease in band gap from 5.657 eV to 2.60 eV on increasing the x value. Subedi et al.65 have reported electronic band gaps (Eg) of 3.96 and 3.82 eV for (Na2O)x(SiO2)1−x at x = 0.1 and 0.3 respectively. Our calculated indirect band gap (Z–Γ-symmetry) of Na2SiO3 is found to be 3.908 eV. However, the experimental band gap was found to be 6.0 eV for silicate glass.68 Ching et al.67 have highlighted the sensitiveness of the band gap towards the exchange parameters. The calculated Eg of Na2SiO3 were found to be 6.46 eV and 9.98 eV for  and α = 1.0 parameters, respectively. Thus the discrepancy that arises in the band gap calculation is due to the choice of different exchange parameters. Referring to Fig. 7, it is clear that with the increase in doping concentration, the Eg gradually decreases to a minimum value of Eg = 3.1327 eV. It is obvious that doping of any materials with heavier elements should reduce the band gap and enhance the mobility of electrons between the VB and CB due to the introduction of extra bands near the Fermi level. Interestingly, for even doping concentrations [see Fig. 5(a, c and e)], we have observed the last two bands of the CB intersecting along the X-symmetry while these characteristics are not visible in odd doping [see Fig. 5(b and d)]. This suggests that for even doping the last two bands of the CB are possibly contributed by the Na-s orbital.
 |
| | Fig. 5 Calculated band structures of Na2Si1−xGexO3: (a) x = 0.0, (b) x = 0.25, (c) x = 0.50, (d) x = 0.75, and (e) x = 1.0. | |
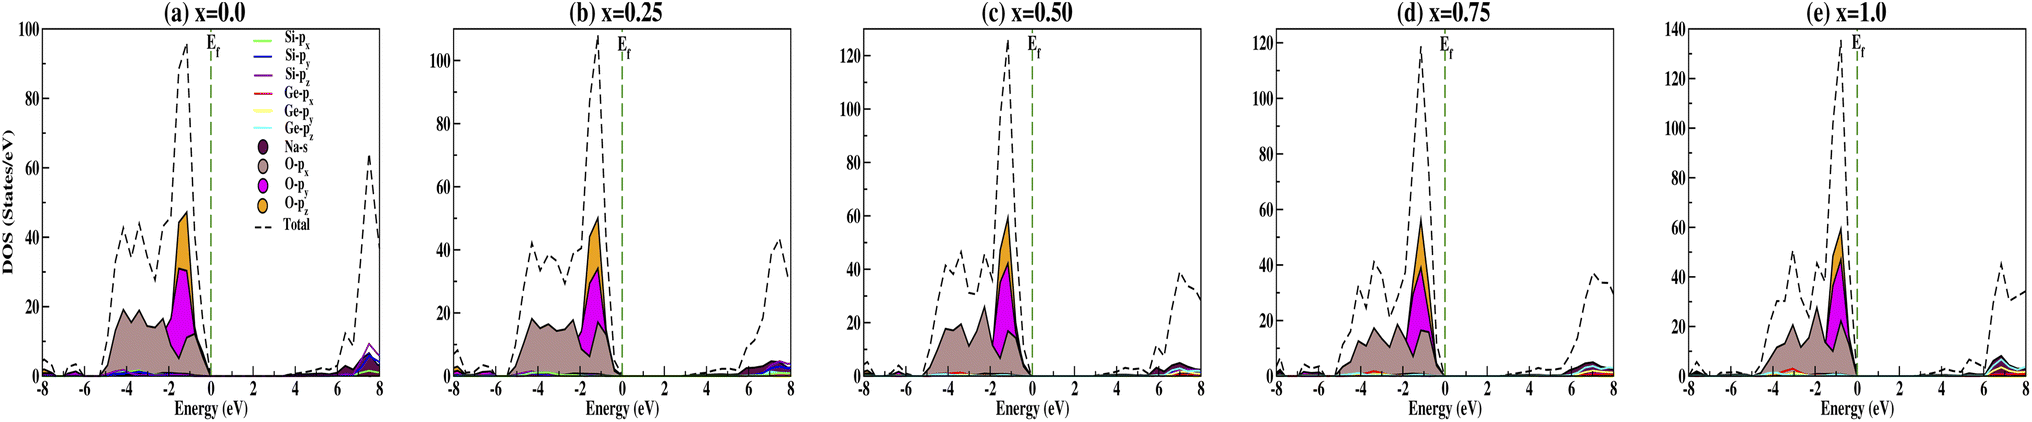
The calculated DOS gives the number of different states at a particular energy level that electrons are allowed to occupy as shown in Fig. 6. Analysis of the DOS plot indubitably reveals that the majority of energy states around the top of the VB are contributed by oxygen O-px, O-py and O-pz orbitals while the bottom of the CB is mainly contributed by the silicon Si-px, Si-py and Si-pz, and sodium Na-s orbitals for doping concentration x = 0.0 [Fig. 6(a)]. From Fig. 6(b–e), we have observed the shifting of the bottom of the conduction band towards the Fermi energy on increasing the concentration of Ge dopant. Recently, Wang et al.69 reported the band gap variation of HxMoO3, 0 < x ≤ 2 and observed a quasi-metallic property of HxMoO3. Similarly, from the PDOS plot (Fig. 6) we can see that allowed shallow states are created due to Ge dopant atoms near the conduction band minima and observe a more complex hybridization between Na-s, Si-p and Ge-p orbitals, i.e., more orbitals overlap as x increases. This results in the shifting of the conduction region towards the Fermi level and thus reduces the band gap when x increases as shown in Fig. 7. However, within the valence band region, the contributions from Na-s, Si-p and Ge-p orbitals are negligibly small compared to O-p, and as a result the dopant atoms do not have much effect in the valence band region. This enhances the semi-conducting properties of the studied compounds. The oxygen contribution in the VB region was further analyzed in terms of BO and NBO; between −5.5 and 0 eV all the oxygen orbitals O-px, O-py and O-pz split into two main regions with the BO peaks at lower energy. This reveals that the top of the VB is mainly from the NBO contribution due to its higher energy state. Referring to the relative atomic concentration of BO and NBO, the DOS intensity (states per V) of BO should be half that of NBO. From the total DOS (TDOS) calculations within −5.5 eV to 0 eV, for all concentrations the TDOS intensities near the Fermi level (i.e., the contribution from NBO) are almost double the TDOS intensities within the region of −5.5 to −3.0 eV (i.e., the contribution from BO). Ching et al.67 reported that the BO valence orbitals were at lower energy (or higher binding energy) as compared to NBO. This is consistent with the atomic structure of the compounds as the bond lengths of BO–BO are smaller in comparison with NBO–NBO (see Table 3 for O–O and O′–O′ bond lengths). This fact can be explained by on-site Coulomb repulsion; lower energy (or higher binding energy) BO valence orbitals should have lower electronic valence charge as compared to NBO. This implies that the electrostatic repulsion between BO–BO is smaller, thus resulting in a smaller separation than that of NBO–NBO.
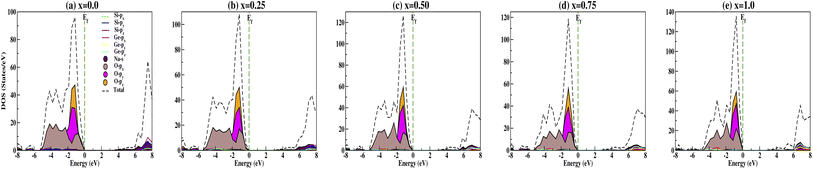 |
| | Fig. 6 Partial density of states calculated for Na2Si1−xGexO3: (a) x = 0.0, (b) x = 0.25, (c) x = 0.50, (d) x = 0.75, and (e) x = 1.0. | |
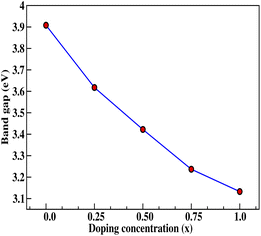 |
| | Fig. 7 Calculated band gap (in eV) versus doping concentration (x). Here, red dots indicate the corresponding band gaps at x = 0.0, 0.25, 0.50, 0.75, 1.0 for doping with Ge on Si sites. | |
3.3 Elastic and mechanical properties
To perceive whether the studied compounds meet the required stability and durability, the elastic constants play an important role to determine the strength, response of the compounds towards external stress, and applicability for practical applications. In this regard, we have calculated the elastic constants and other mechanical properties of Na2Si1−xGexO3. The calculated values at x = 0.0 are comparable to an earlier report by Belmonte et al.28 using the LCAO DFT/B3LYP functional. The elastic constant tensors Cij computed using stress–strain relations70,71 are presented in Table 5; they satisfy the necessary and sufficient Born criteria for a triclinic P1 structure,72,73 i.e., C11 > 0, C22 > 0, C33 > 0, C44 > 0, C55 > 0, C66 > 0 [C11 + C22 + C33 + 2(C12 + C13 + C23)] > 0, C33C55 − C352 > 0, C44C66 − C462 > 0 and C22 + C33 − 2C23 > 0. This indicates that the compounds under investigation are mechanically stable. The mechanical stability is further confirmed by the positive stiffness eigenvalues (λ). Herein, we have also investigated the phase velocity and polarization of seismic waves along a given propagation direction using the Christoffel determinant:74| | |
|Cijklnjnl − ρV2δik| = 0
| (3) |
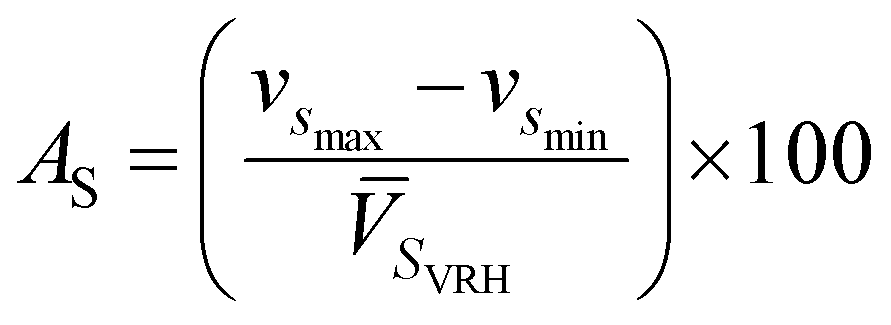
where Cijkl are elastic constant tensors, n is the unit vector normal to the surface of seismic propagation into space, ρ is the density of the crystal, V is the phase velocity of the seismic wave and δik is the Kronecker delta. From this calculation we obtain two sets of waves: a quasi-longitudinal wave (vp) and two quasi-shear waves with vsfast > vsslow. Here, vp is polarized nearly along the direction of propagation while the two latter waves are polarized almost perpendicular to the direction of propagation (see Table 6). Utilizing the elastic constant tensor and its compliance tensor (Sij), we perform a calculation of ![[V with combining macron]](https://www.rsc.org/images/entities/i_char_0056_0304.gif) PVRH and SVRH which gives the isotropic seismic velocities averaged over all propagation directions (calculated values of PVRH and SVRH are given in Table 6). The main reason for calculating such parameters is to understand the single-crystal azimuthal seismic anisotropy for longitudinal waves (AP) and shear waves (AS) given by:75
PVRH and SVRH which gives the isotropic seismic velocities averaged over all propagation directions (calculated values of PVRH and SVRH are given in Table 6). The main reason for calculating such parameters is to understand the single-crystal azimuthal seismic anisotropy for longitudinal waves (AP) and shear waves (AS) given by:75| |
 | (4) |
and| |
 | (5) |
Table 5 Calculated elastic constants Cij (in GPa units), anisotropic factors (Aan and AU) (unitless), stiffness eigenvalues (λ) (in GPa units), density of the compounds (ρ) (in g cm−3), transverse (vt), longitudinal (vl) and average (vav) velocities of sound (in km s−1), and the dimensionless Kleinman coefficient (ζ) for Na2Si1−xGexO3 (x = 0.0, 0.25, 0.50, 0.75, 1.0)
| x |
C11 |
C22 |
C33 |
C44 |
C55 |
C66 |
C12 |
C13 |
C23 |
Aan |
AU |
| 0.0 |
118.824 |
100.117 |
111.436 |
50.007 |
35.059 |
18.086 |
44.978 |
28.728 |
41.368 |
2.75 |
0.67 |
| 0.25 |
115.075 |
96.262 |
101.447 |
47.864 |
34.197 |
17.770 |
46.775 |
30.520 |
39.525 |
2.96 |
0.62 |
| 0.50 |
112.696 |
94.043 |
95.406 |
45.886 |
33.278 |
17.288 |
47.404 |
29.755 |
93.827 |
3.03 |
0.629 |
| 0.75 |
108.624 |
90.601 |
85.019 |
44.208 |
32.371 |
16.544 |
48.434 |
32.505 |
37.800 |
3.38 |
0.627 |
| 1.0 |
103.831 |
89.733 |
76.126 |
42.912 |
31.329 |
15.570 |
49.127 |
34.491 |
36.838 |
3.74 |
0.678 |
| x |
λ1 |
λ2 |
λ3 |
λ4 |
λ5 |
λ6 |
ρ |
vt |
vl |
vav |
ζ |
| 0.0 |
18.086 |
35.059 |
50.007 |
57.133 |
86.202 |
187.04 |
2.519 |
3.615 |
6.491 |
4.025 |
0.519 |
| 0.25 |
17.77 |
34.197 |
47.822 |
52.934 |
77.059 |
182.83 |
2.701 |
3.399 |
6.151 |
3.787 |
0.544 |
| 0.50 |
17.258 |
33.278 |
45.281 |
49.633 |
73.409 |
179.71 |
2.881 |
3.221 |
5.867 |
3.591 |
0.557 |
| 0.75 |
16.543 |
32.372 |
44.061 |
46.063 |
62.636 |
175.69 |
3.055 |
3.030 |
5.572 |
3.380 |
0.579 |
| 1.0 |
15.51 |
31.329 |
42.912 |
43.679 |
53.424 |
172.59 |
3.218 |
2.859 |
5.316 |
3.192 |
0.602 |
Table 6 Calculated quasi-longitudinal wave velocities (vp) and quasi-shear wave velocities (vs) (in km s−1 units). Here, the subscripts max and min indicate maximum and minimum velocities. Calculated single-crystal azimuthal seismic anisotropy for longitudinal (AP) and shear (AS) waves (in %), Gruneisen parameter (γ) (dimensionless), Pugh's ratio (k) (dimensionless) and melting temperature (Tm) (in Kelvin) for Na2Si1−xGexO3 (x = 0.0, 0.25, 0.50, 0.75, 1.0)
| x |
vpmax |
vpmin |
vsmax |
vsmin |
PVRH |
SVRH |
AP |
AS |
γ |
k |
μm |
Tm |
| 0.0 |
7.017 |
6.172 |
4.463 |
2.864 |
6.491 |
3.615 |
13.02 |
49.21 |
1.63 |
1.89 |
1.2446 |
877.626 ± 300 |
| 0.25 |
6.592 |
5.911 |
4.210 |
2.565 |
6.151 |
3.400 |
11.07 |
48.38 |
1.66 |
1.94 |
1.2652 |
851.396 ± 300 |
| 0.50 |
6.293 |
5.682 |
3.989 |
2.448 |
5.867 |
3.217 |
10.41 |
47.90 |
1.68 |
1.99 |
1.2929 |
835.197 ± 300 |
| 0.75 |
5.964 |
5.276 |
3.804 |
2.327 |
5.572 |
3.030 |
12.35 |
48.76 |
1.71 |
2.05 |
1.2994 |
807.401 ± 300 |
| 1.0 |
5.681 |
4.864 |
3.652 |
2.196 |
5.316 |
2.859 |
15.37 |
50.93 |
1.75 |
2.12 |
1.3019 |
779.682 ± 300 |
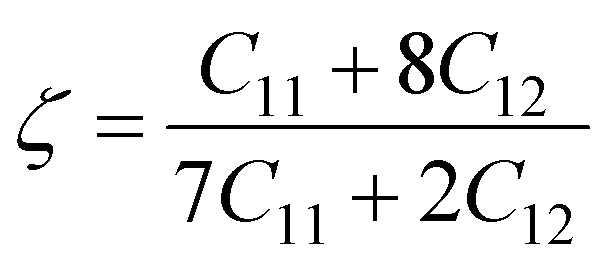
At x = 0.0, we have obtained AP = 13.02% and AS = 49.21%. These results are consistent with the results of Belmonte et al.,28 in which the AP and AS values were 15% and 51% respectively for Na2SiO3. From Table 6, our AP and AS values are relatively high for x = 0.0, 0.25, 0.50, 0.75, 1.0, indicating the anisotropic single-crystal elasticity. The highly anisotropic single-crystal elasticity behavior is also confirmed by the large values of C11, C22 and C33 as compared to the other elastic stiffness tensors. Considerably large values of C11, C22 and C33 with respect to the other elastic constant tensors also show that Na2Si1−xGexO3 are more resistant to axial compression compared to shear deformation. This is further confirmed by the fact that the bulk modulus (B) values given in Table 7 are comparatively larger than the values of shear modulus (G). For internal deformation stability, we have calculated the dimensionless Kleinman coefficient ζ (see Table 5) by employing eqn (6):76
| |
 | (6) |
Table 7 Calculated elastic moduli (Bulk modulus (B), Young's modulus (Y), and Shear modulus (G) all in GPa units) and Poisson's ratio (ν) (unitless) for Na2Si1−xGexO3 (x = 0.0, 0.25, 0.50, 0.75, 1.0). Here, the subscripts V, R and H represent Voigt, Reuss and Hill assumptions respectively
| x |
BV |
BR |
BH |
YV |
YR |
YH |
GV |
GR |
GH |
νV |
νR |
νH |
| 0.0 |
62.281 |
62.202 |
62.241 |
88.40 |
79.454 |
83.968 |
34.984 |
30.865 |
32.925 |
0.26344 |
0.28711 |
0.27516 |
| 0.25 |
60.714 |
60.402 |
60.558 |
83.88 |
75.882 |
79.912 |
33.03 |
29.398 |
31.214 |
0.26974 |
0.29062 |
0.28007 |
| 0.50 |
59.569 |
59.078 |
59.324 |
80.617 |
72.839 |
76.756 |
31.628 |
28.134 |
29.881 |
0.27444 |
0.29451 |
0.28436 |
| 0.75 |
57.969 |
56.92 |
57.444 |
76.012 |
68.679 |
72.366 |
29.658 |
26.438 |
28.048 |
0.28146 |
0.29890 |
0.29004 |
| 1.0 |
56.734 |
55.001 |
55.867 |
71.91 |
64.463 |
68.203 |
27.899 |
24.705 |
26.302 |
0.28875 |
0.30466 |
0.29653 |
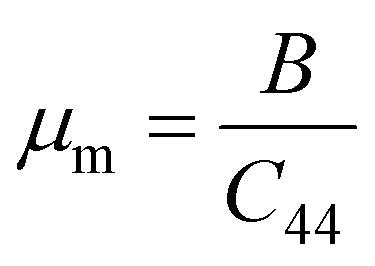
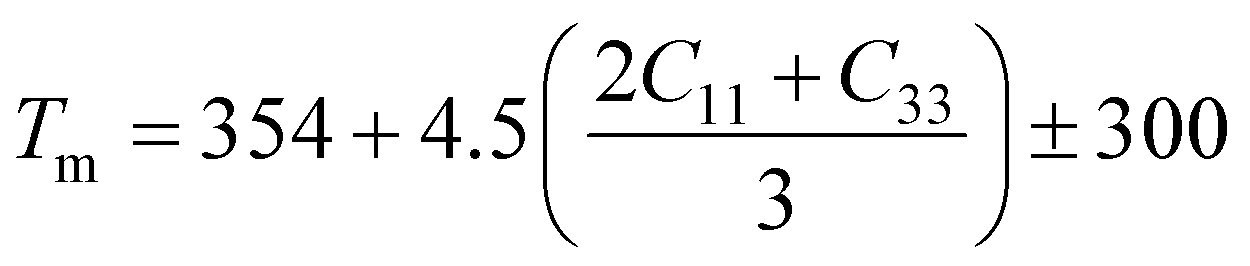
A Kleinman coefficient in the range of 0 ≤ ζ ≤ 1 determines the stability of the compounds against stretching and bending. ζ closer to 0 indicates a negligible contribution of bond bending to resist external stress. From the calculated results, it has been observed that the mechanical strength of the studied compounds was mostly governed by bond stretching or contracting rather than bending of bonds. For machinability purposes and practical applicability, we have performed the calculation of the machinability index μm, which indicates the feasibility of machinery applications, cutting forces, plasticity and lubricating properties, and the melting temperature Tm (see Table 6). The formulae adopted for μm and Tm calculations are:77,78
| |
 | (7) |
| |
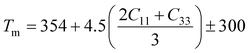 | (8) |
The calculated μm are all in an acceptable range for machinability, lower feed forces, mediocre lubricating properties and high strain value. The calculated Tm at x = 0.0 is comparable to the experimental melting temperature (Tm = 810 °C) of sodium orthosilicate (2Na2O·SiO2) estimated by Meshalkin et al.79 where the investigation was performed at near-liquidus phase equilibria in 33–58.5 mol% SiO2.
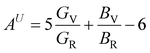
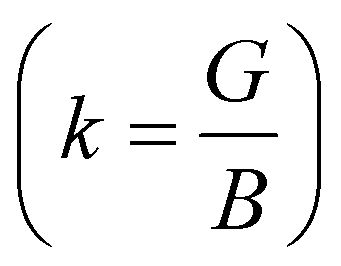
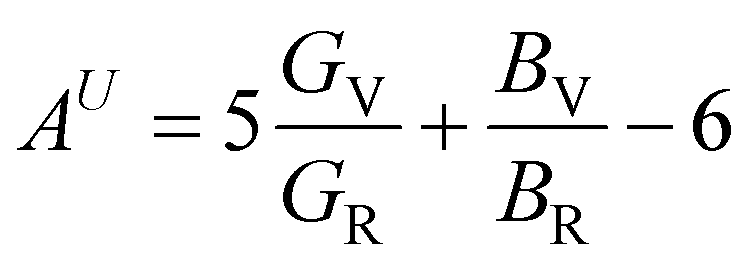
In Table 7, we have reported the calculated elastic moduli and Poisson's ratio for different x values which are all estimated in terms of the Voigt80 (uniform strain assumption), Reuss81 (uniform stress assumption) and Hill assumptions.82 When the x value increases, the elastic moduli decrease while the Poisson's ratio increases, suggesting that the systems being studied are under tensile deformation rather than compressive. The increasing Poisson's ratio with x indicates the ductile nature, further confirmed by the increase in Pugh ratio  (see Table 6). The critical value for the transition from ductile materials to brittle ones is 1.75 (i.e., k > 1.75 indicates a ductile material). It is well known that in crystallography the isotropy or anisotropy of a material plays an important role. Making use of the elastic stiffness tensors and elastic moduli, we have calculated the two anisotropic factors Aan and AU (see Table 5) given by:83
| |
 | (9) |
| |
 | (10) |
Here,
Aan and
AU represent the elastic anisotropy and the strength of the anisotropy of the materials, respectively. The calculated
Aan for all values of
x are greater than 1, indicating the compounds are elastically anisotropic. For isotropic materials
Aan = 1. The deviation of
AU from zero corresponds to the strength of the anisotropy of the materials. The maximum deviation of
AU from zero is observed at
x = 0.0 and 1.0; this reveals that Na
2SiO
3 and Na
2GeO
3 are highly anisotropic materials which seems to be the generic feature of glass materials.
84
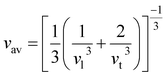
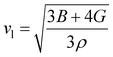
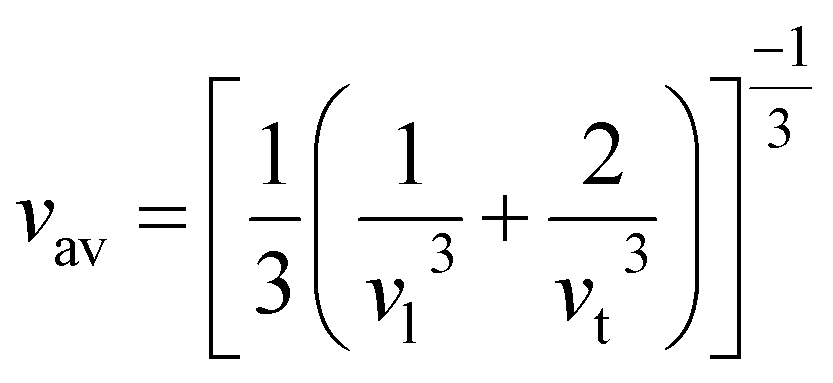
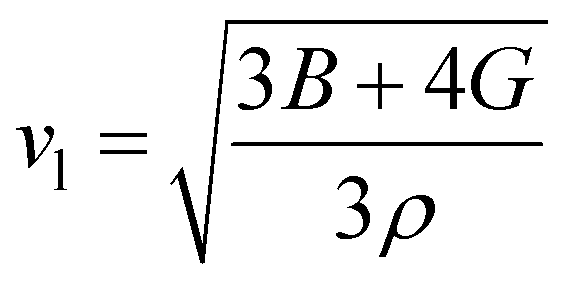
One of the main concerns for elastic property calculation is figuring out the average sound velocity vav determined by the transverse (vt) and longitudinal (vl) velocities and the Gruneisen parameter (γ). Considering the elastic moduli, density of the compound and Poisson's ratio we perform such calculations:85
| |
 | (11) |
where
and

| |
 | (12) |
where
ν is the Poisson's ratio.
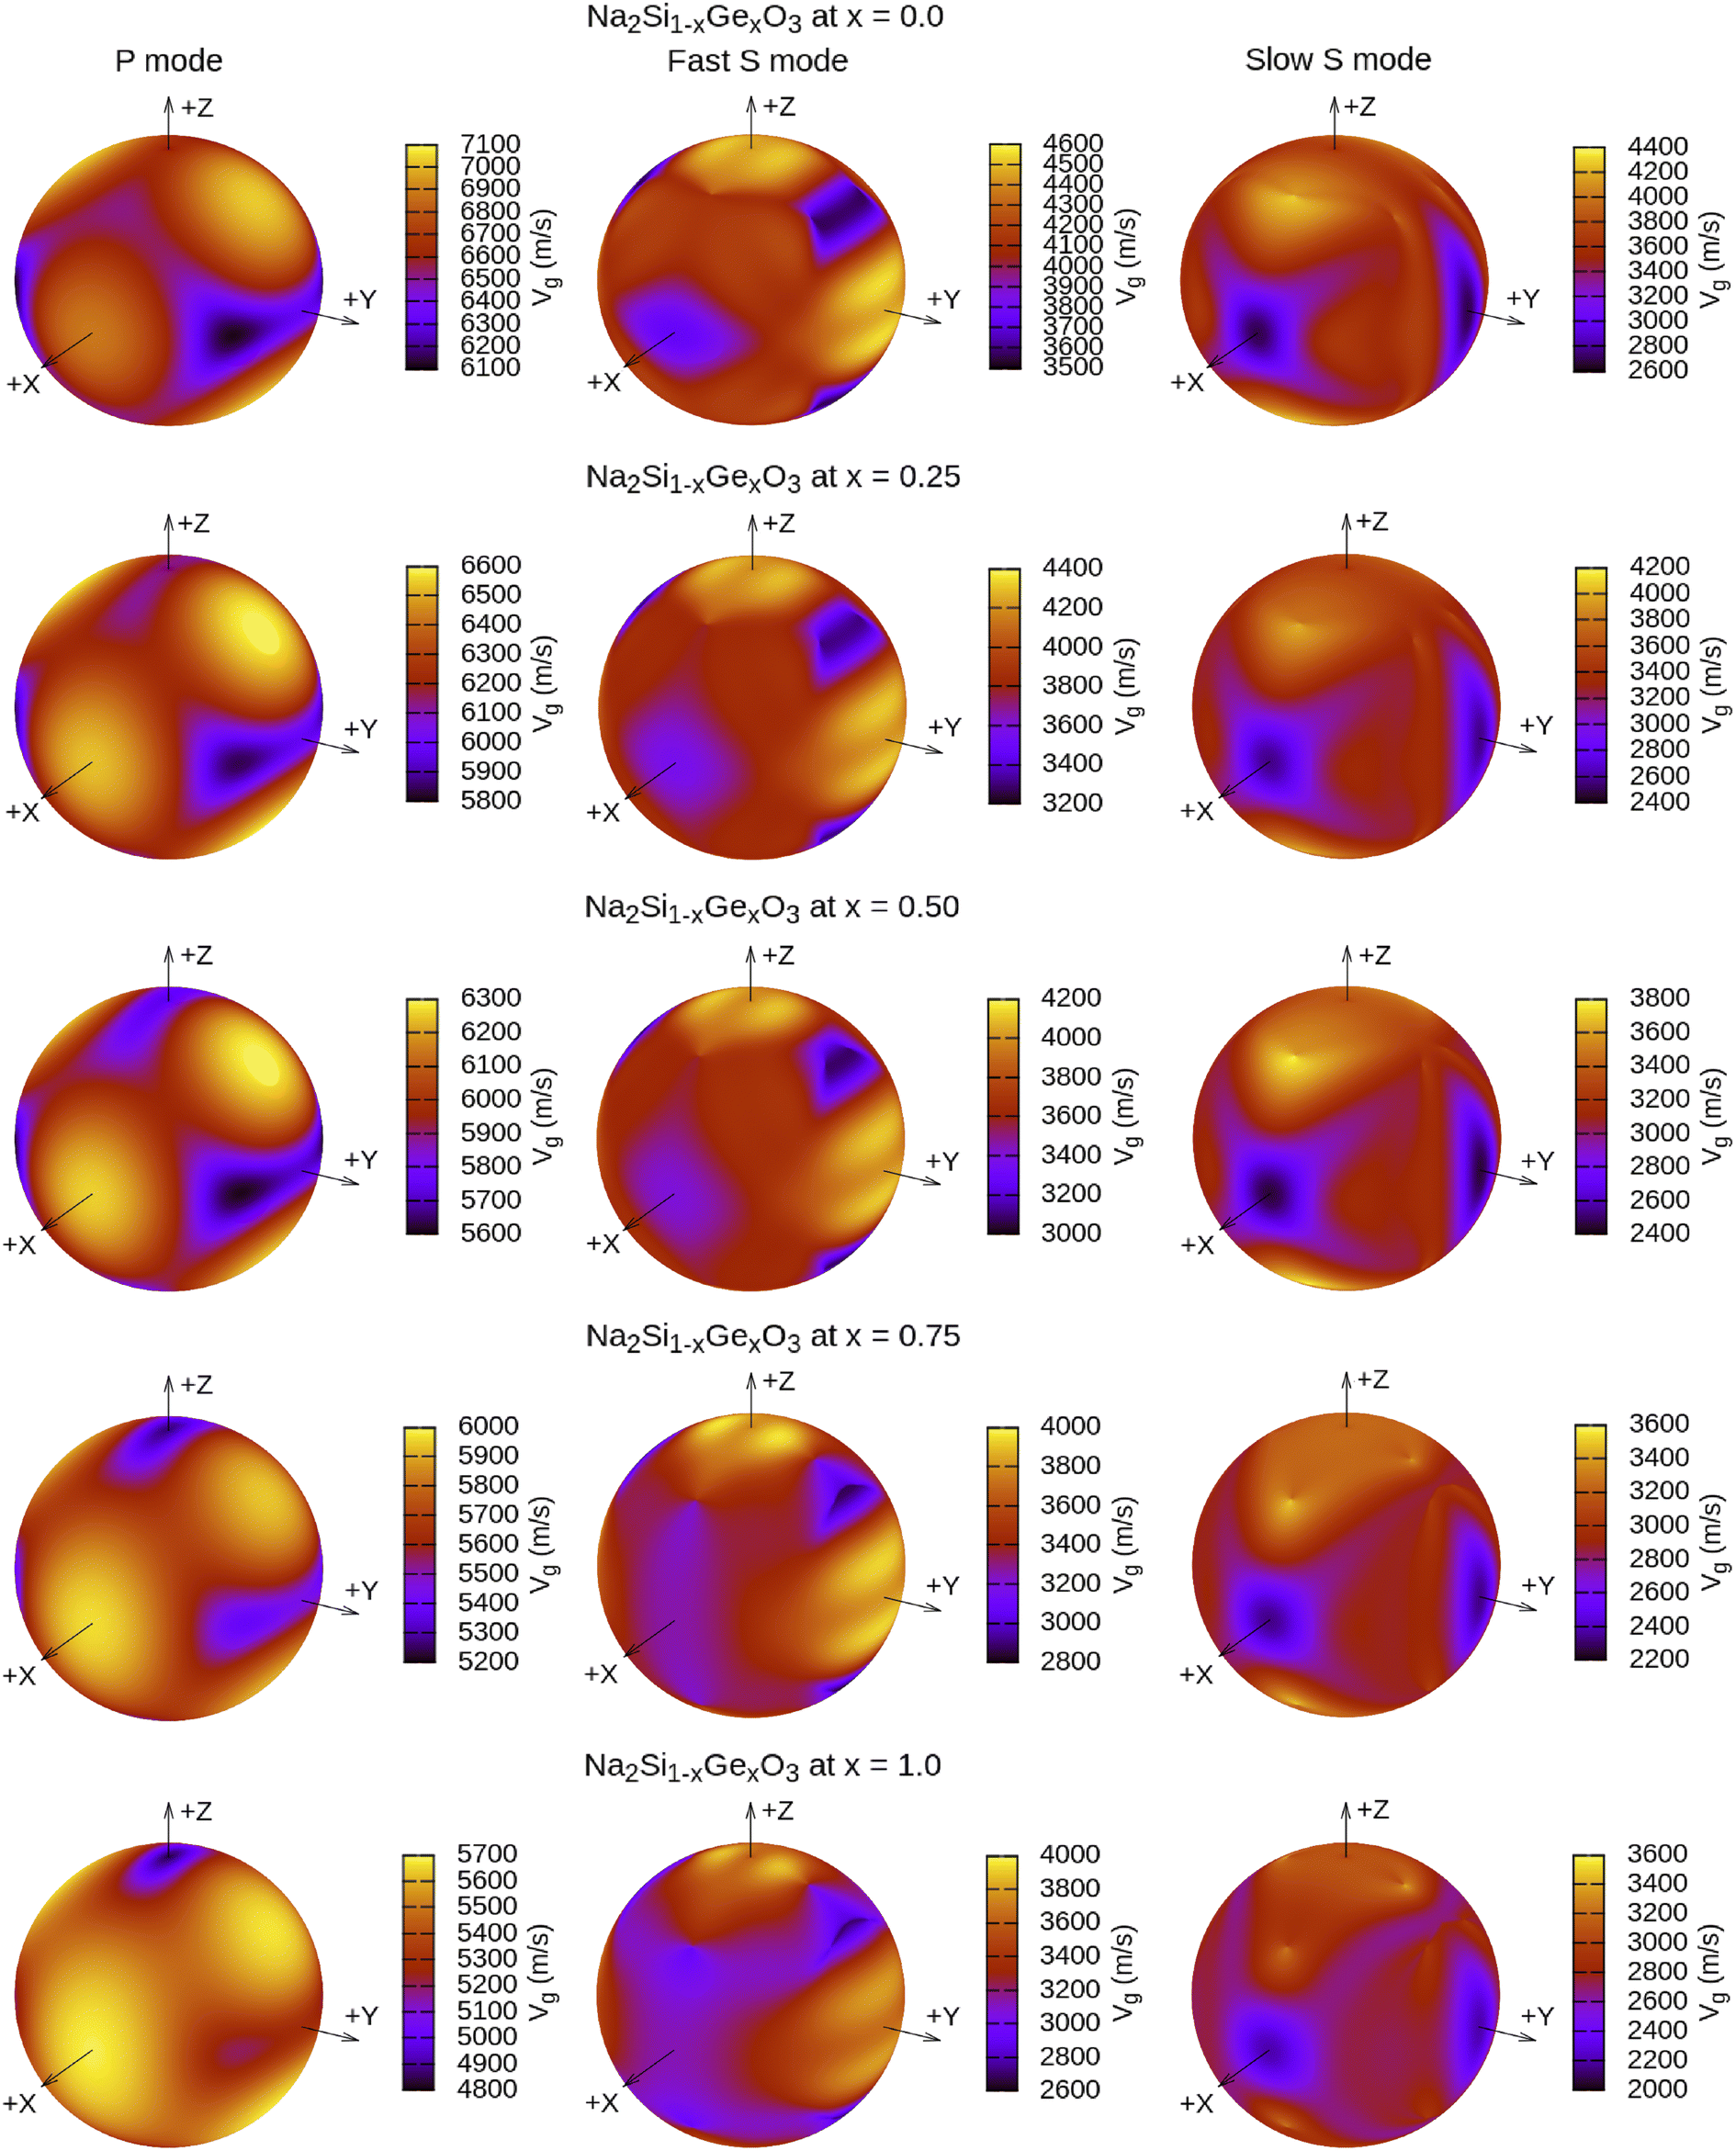
The calculated vt, vl and vav are given in Table 5. The obtained values show that vt, vl and vav are reduced when x increases. The calculated Gruneisen parameters (γ) [see Table 6] describe the vibrational properties which are affected by the change in crystal volume as x increases. The acoustic wave evaluator in solid media (AWESOME)86 analyzes the phase and group velocities of the compounds (see Fig. 8). It is clear that the seismic velocities estimated by the Christoffel equation are direction dependent. Fig. 8 shows the group velocity of Na2Si1−xGexO3 as a function of the propagation direction. In this study, we have calculated the group velocities of p-mode, fast s-mode and slow s-mode waves under different doping concentration (x). In p-waves or compressional waves, the vibrations of atoms are in the direction of wave propagation and as a result p-waves travel faster as compared to s-waves or shear waves where atoms oscillate perpendicular to the direction of propagation. The main difference between these two waves is that p-waves cause the studied materials to compress and expand along the direction of propagation, while the s-waves have greater amplitude and produce vertical and horizontal vibration, and as a result s-waves are more destructive to the mechanical stability. At x = 0.0, for p-mode the maximum velocity (vpmax) is 7017 m s−1 along [1 1 0] and the minimum velocity (vpmin) is 6127 m s−1 along [0 1 1]. This implies that the compound being investigated is more dense along [0 1 1], while along the [1 1 0] direction, the density is a minimum for x = 0.0. From Table 6, we can observe that vpmax decreases with x, this shows that when the concentration of Ge atoms increases, the compound being investigated has higher density. And the directions for higher and lower density regions are presented in Fig. 8. For the two s-mode seismic waves, vsfast and vsslow, the maximum velocities are along [0 1 0] and [0 0 1] respectively, while the minimum velocities are along [0 1 1] and [0 1 0] respectively. Clearly, from the equation vp = vgΨ, where Ψ is the power flow angle, we can find that the distinction between fast and slow s-modes is due to the phase velocity and therefore, referring to Fig. 8, we observed that for different x values the velocity of the fast s-mode is always higher than that of the slow s-mode.
 |
| | Fig. 8 3-Dimensional plot of group velocity as a function of propagation direction for the p-mode and two s-mode (fast and slow) waves obtained from the Christoffel determinant for Na2Si1−xGexO3 (x = 0.0, 0.25, 0.50, 0.75, 1.0). Here, vg are in m s−1 units. | |
3.4 Piezoelectric properties
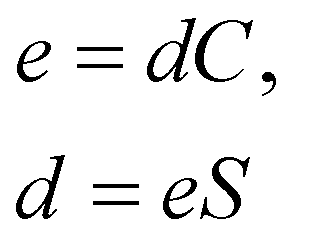
Piezoelectric properties have attracted tremendous research interest due to the green method of energy conversion. Piezoelectric materials are future energy materials that can be practically implemented in actuators, sensors, medical tools for monitoring heartbeats and breathing, and many more.87–90 Piezoelectric properties of a material emerge as a result of applied mechanical stress that gives rise to atomic scale polarization. The direct ‘e’ and converse ‘d’ piezoelectric tensors measure the variation of polarization ‘P’ induced by strain (η) and the η generated by an external electric field (E) at constant electric field and stress, respectively.
At constant field,
At constant stress,
This calculation is based on computing the intensity of polarization induced by strain. Cartesian polarization components are expressible in terms of strain tensors, given by:
| |
 | (15) |
Here,
i =
x,
y,
z;
ν = 1, 2, 3, 4, 5, 6 (1 =
xx, 2 =
yy, 3 =
zz, 4 =
yz, 5 =
xz, and 6 =
xy);
η is the strain tensor; and
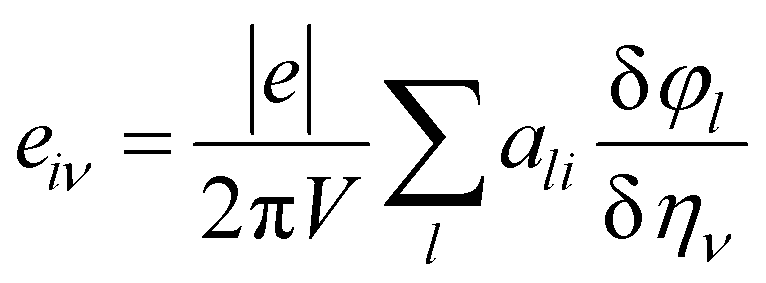
E is the induced electric field. In this calculation, the Berry phase (BP) approach is adopted in which direct piezoelectric constants are given in terms of numerical first derivatives of the BP
φl with respect to strain.
91–94| |
 | (16) |
where
ali is the
ith Cartesian component of the
lth direct lattice basis vector
al. The derivative

is computed numerically by applying finite strains to the crystal lattice. The direct and converse piezoelectric tensors are closely related; the relationship between the tensors is given by:
| |
 | (17) |
where
C is the fourth-rank elastic tensor of energy second derivatives with respect to pairs of deformations and
S =
C−1 is the fourth-rank compliance tensor.
The main aim of calculating the piezoelectric properties is to obtain the direct and converse piezoelectric response of the studied compounds, and compare these results with commonly used and standard piezoelectric materials such as quartz (SiO2). The strain (η) along different directions results in the disruption of the structure which will patently distort the negative cloud of electrons surrounding the positive nuclei. This small separation leads to an electric field between them, and as such polarization is developed which can be manipulated to give novel piezoelectric properties. In Tables 8 and 9, we report the direct and converse piezoelectric response for Na2Si1−xGexO3. Tarumi et al.95 found experimentally that for α-quartz (α-SiO2), the piezoelectric constant was largest along the x-axis due to strain ηxx with a value e11 = 0.15 C m−2 at room temperature, and at 5 K, the reported piezoelectric constant was 0.07 C m−2. From these calculations, it was clarified that the studied compounds had a better response towards piezoelectricity as compared to SiO2. For each case (i.e., at x = 0.0, 0.25, 0.50, 0.75, 1.0), the maximum piezoelectric responses induced are along the z-axis by strain ηyy, i.e., for piezoelectric constant e32. The calculated direct piezoelectric constant first increases with doping concentration x, and is a maximum at x = 0.50 with e32 = 0.308 C m−2 which then decreases. Moreover, we can observe a noticeable piezoelectric response along the y-axis induced by strain ηyz (i.e., e24) and also along the z-axis again but induced by strain ηxx (i.e., e31). Considering how doping concentration affects the piezoelectric constant, the maximum piezoelectric response possible at x = 0.50 will be due to the equilibrium concentration between Ge and Si. This suggests that the piezoelectric properties of the studied compounds are significantly affected by the motion of both Si and Ge atoms. However, the overall piezoelectric response was better for Na2GeO3 than for Na2SiO3. Computed converse piezoelectric constants or piezoelectric strain constants (diν) that describe the situation where strain develops under an applied electric field are the result of coupling of the direct piezoelectric and compliance constants. The maximum values obtained at d32 for different doping concentrations are the result of softening of the C32 elastic constants upon relaxation. The reported d32 values increase with x with the highest value of 9.039 pm V−1 at x = 1.0. In conclusion, we can say that the calculated piezoelectric constants for Na2Si1−xGexO3 are fairly low in comparison to some ferroelectric materials such as SrTiO3 with I4cm space group that shows a piezoelectric response of e33 = 8.82 C m−2.96 Therefore, to utilize Na2Si1−xGexO3 for practical and efficient piezoelectric devices, more rigorous research so as to further enhance its piezoelectric responses is vital. From the surveyed literature, we have found that utilizing low dimensional (LD) materials for piezoelectric materials could enhance the piezoelectric response compared to their bulk forms.97 Recently, Wang et al.98 reported the piezoelectric response for 2-D SnS2 nanosheets with thickness of ∼4 nm and pointed out that the piezoelectric responses reduce with an increase in the thickness of the nanosheets. They obtained an effective out-of-plane piezoelectric response of 2 ± 0.22 pm V−1. This value is comparable to our calculated converse piezoelectric constant d24 where our observed values are within the range of 2.4 to 3 pm V−1.
Table 8 Direct piezoelectric constants of Na2Si1−xGexO3 (x = 0.0, 0.25, 0.50, 0.75, 1.0) (in C m−2 units)
| x |
e15 |
e16 |
e21 |
e22 |
e23 |
e24 |
e31 |
e32 |
e33 |
e34 |
| 0.0 |
0.103 |
0.001 |
— |
0.003 |
−0.001 |
0.145 |
0.140 |
0.221 |
−0.582 |
— |
| 0.25 |
— |
0.008 |
0.015 |
−0.011 |
−0.010 |
0.132 |
0.156 |
0.262 |
−0.715 |
0.006 |
| 0.50 |
— |
0.015 |
0.029 |
−0.017 |
−0.015 |
0.134 |
0.123 |
0.308 |
−0.768 |
0.028 |
| 0.75 |
— |
0.006 |
0.023 |
−0.014 |
−0.006 |
0.127 |
0.192 |
0.290 |
−0.909 |
0.012 |
| 1.0 |
— |
— |
— |
— |
— |
0.104 |
0.182 |
0.287 |
−1.015 |
— |
Table 9 Converse piezoelectric constants of Na2Si1−xGexO3 (x = 0.0, 0.25, 0.50, 0.75, 1.0) (in pm V−1 units)
| x |
d15 |
d16 |
d21 |
d22 |
d23 |
d24 |
d31 |
d32 |
d33 |
d34 |
| 0.0 |
2.930 |
0.043 |
−0.014 |
0.048 |
−0.020 |
2.905 |
1.161 |
4.688 |
−7.263 |
0.003 |
| 0.25 |
— |
— |
0.230 |
−0.175 |
−0.110 |
2.757 |
1.514 |
6.032 |
−9.855 |
0.267 |
| 0.50 |
— |
— |
0.443 |
−0.280 |
−0.229 |
2.916 |
0.894 |
7.747 |
−11.587 |
1.214 |
| 0.75 |
— |
— |
0.380 |
−0.307 |
−0.105 |
2.872 |
2.734 |
8.150 |
−15.369 |
0.593 |
| 1.0 |
— |
— |
— |
— |
— |
2.416 |
3.955 |
9.039 |
−19.494 |
−0.002 |
4 Conclusions
In summary, we have studied the structural, electronic, mechanical and piezoelectric properties of complex glass-like Na2Si1−xGexO3 by using DFT calculations. We have shown that the structural and the electronic properties of the studied compounds are mostly defined by the presence of silicon and germanium. Also, doping with heavier elements tuned the wide band gap to a medium one. Our calculations of phonon dispersion curves, formation energy and elastic tensor constants revealed that the transformation of Na2SiO3 → Na2GeO3 is practically possible by preserving dynamical as well as mechanical stability. The calculated machinability index and melting temperature have shown that the compounds under investigation are at an acceptable machinability level and can be utilised in a high temperature range. We observe maximum piezoelectric responses along the z-axis, i.e., e32, for all structures and these values are higher than that of the standard piezoelectric material SiO2. However, our observed maximum direct piezoelectric constant e32 = 0.308 C m−2 at x = 0.50 seems to be low as compared to the ferroelectric material SrTiO3. So, for practical application of Na2Si1−xGexO3 as a piezoelectric component in devices, we need rigorous research to enhance the efficiency.
Conflicts of interest
The authors declare no conflicts of interest.
Acknowledgements
D. P. Rai acknowledges Govt. of India, Ministry of Science and Technology, Department of Science & Technology (International Bilateral Cooperation Division) for supporting the Indo–Uzbek joint project via Sanction No. INT/UZBEK/P-02. G. Abdurakhmanov acknowledges the Government of Uzbekistan and Ministry of Innovative Development for supporting the Uzbekistan–India joint grant Uzb-Ind-20221-78. G. S. L. Fabris thanks the Coordenação de Aperfeiçoamento de Pessoal de Nível Superior – Brasil (CAPES) – Finance Code 001 – (grant no. 88887.467334/2019-00). J. R. Sambrano thanks the CNPq (National Council for Scientific and Technological Development) (307213/2021-8) and FAPESP (São Paulo Research Foundation) (2019/08928-9, 2022/03959-6, 2013/07296-2). The computational facilities were supported by resources supplied by the Molecular Simulations Laboratory (São Paulo State University, Bauru, Brazil) and Physical Sciences Research Center (PSRC), Pachhunga University College, Mizoram University, Aizawl-796001, India.
References
- J. Y. Tsao, S. Chowdhury, M. A. Hollis, D. Jena, N. M. Johnson, K. A. Jones, R. J. Kaplar, S. Rajan, C. G. Van de Walle, E. Bellotti, C. L. Chua, R. Collazo, M. E. Coltrin, J. A. Cooper, K. R. Evans, S. Graham, T. A. Grotjohn, E. R. Heller, M. Higashiwaki, M. S. Islam, P. W. Juodawlkis, M. A. Khan, A. D. Koehler, J. H. Leach, U. K. Mishra, R. J. Nemanich, R. C. N. Pilawa-Podgurski, J. B. Shealy, Z. Sitar, M. J. Tadjer, A. F. Witulski, M. Wraback and J. A. Simmons, Adv. Electron. Mater., 2018, 4, 1600501 CrossRef.
- R. Woods-Robinson, Y. Han, H. Zhang, T. Ablekim, I. Khan, K. A. Persson and A. Zakutayev, Chem. Rev., 2020, 120, 4007–4055 CrossRef CAS PubMed.
- L.-g. Liu, Geophys. Res. Lett., 1987, 14, 1079–1082 CrossRef CAS.
- J. M. D. Coey, Mössbauer Spectroscopy Applied to Inorganic Chemistry, Springer US, Boston, MA, 1984, pp. 443–509 Search PubMed.
- L. Zhu, Y. R. Zeng, J. Wen, L. Li and T. M. Cheng, Electrochim. Acta, 2018, 292, 190–198 CrossRef CAS.
- Y. Ren, Y. Zhang, Y. Gu and Q. Zeng, Prog. Org. Coat., 2017, 112, 225–233 CrossRef CAS.
- M. Lancry, E. Régnier and B. Poumellec, Prog. Mater. Sci., 2012, 57, 63–94 CrossRef CAS.
- S. Kaya, M. Cresswell and A. R. Boccaccini, Mater. Sci. Eng., C, 2018, 83, 99–107 CrossRef CAS.
- E. Borsella, E. Cattaruzza, G. De Marchi, F. Gonella, G. Mattei, P. Mazzoldi, A. Quaranta, G. Battaglin and R. Polloni, J. Non-Cryst. Solids, 1999, 245, 122–128 CrossRef CAS.
- J. O. Bockris, J. D. Mackenzie and J. A. Kitchener, Trans. Faraday Soc., 1955, 51, 1734 RSC.
- C. A. Faick and A. N. Finn, J. Am. Ceram. Soc., 1931, 14, 518–528 CrossRef CAS.
- L. Shartsis, S. Spinner and W. Capps, J. Am. Ceram. Soc., 1952, 35, 155–160 CrossRef CAS.
- T. Uchino, M. Iwasaki, T. Sakka and Y. Ogata, J. Phys. Chem., 1991, 95, 5455–5462 CrossRef CAS.
- Y. Kowada and D. Ellis, Adv. Quantum Chem., Academic Press, 1998, vol. 29, pp. 233–251 Search PubMed.
- A. K. Varshneya and J. C. Mauro, Fundamentals of Inorganic Glasses, Elsevier, 2019, pp. 1–18 Search PubMed.
- G. Agrawal, Nonlinear Fiber Optics, Elsevier, 2013, pp. 457–496 Search PubMed.
- Application of Silica Glasses in Practice, ed. I. Fanderlik, Elsevier, 1991, vol. 11, pp. 271–300 Search PubMed.
- C. Li, C. Liu, W. Wang, Z. Mutlu, J. Bell, K. Ahmed, R. Ye, M. Ozkan and C. S. Ozkan, Sci. Rep., 2017, 7, 917 CrossRef PubMed.
- L. Granados, R. Morena, N. Takamure, T. Suga, S. Huang, D. R. McKenzie and A. Ho-Baillie, Mater. Today, 2021, 47, 131–155 CrossRef CAS.
- M. Mir, M. N. Ali, J. Sami and U. Ansari, Adv. Mater. Sci. Eng., 2014, 2014, 1–17 CrossRef.
- R. Morrell, Comprehensive Composite Materials, Elsevier, 2000, pp. 1–24 Search PubMed.
- J. T. Randall, H. P. Rooksby and B. S. Cooper, Z. Kristallogr. - Cryst. Mater., 1930, 75, 196–214 CrossRef.
- W. H. Zachariasen, J. Am. Chem. Soc., 1932, 54, 3841–3851 CrossRef CAS.
- I. Farnan, Nature, 1997, 390, 14–15 CrossRef CAS.
- K. Baral, A. Li and W.-Y. Ching, J. Phys. Chem. A, 2017, 121, 7697–7708 CrossRef CAS.
- P. Richet, B. O. Mysen and D. Andrault, Phys. Chem. Miner., 1996, 23, 157–172 CrossRef CAS.
- W. S. McDonald and D. W. J. Cruickshank, Acta Crystallogr., 1967, 22, 37–43 CrossRef CAS.
- D. Belmonte, C. Gatti, G. Ottonello, P. Richet and M. V. Zuccolini, J. Phys. Chem. A, 2016, 120, 8881–8895 CrossRef CAS.
- C. Cuautli, I. Romero-Ibarra, J. Vazquez-Arenas and M. Galvan, Fuel, 2021, 298, 120840 CrossRef CAS.
- F. Liu, S. Garofalini, R. King-Smith and D. Vanderbilt, Chem. Phys. Lett., 1993, 215, 401–404 CrossRef CAS.
- G. Greaves, J. Non-Cryst. Solids, 1985, 71, 203–217 CrossRef CAS.
- Y. Cao, A. N. Cormack, A. G. Clare, B. Bachra, A. C. Wright, R. N. Sinclair and A. C. Hannon, J. Non-Cryst. Solids, 1994, 177, 317–323 CrossRef CAS.
- D. W. Matson, S. K. Sharma and J. A. Philpotts, J. Non-Cryst. Solids, 1983, 58, 323–352 CrossRef CAS.
- H. Maekawa, T. Maekawa, K. Kawamura and T. Yokokawa, J. Non-Cryst. Solids, 1991, 127, 53–64 CrossRef CAS.
- G. N. Greaves, S. J. Gurman, C. R. A. Catlow, A. V. Chadwick, S. Houde-Walter, C. M. B. Henderson and B. R. Dobson, Philos. Mag. A, 1991, 64, 1059–1072 CrossRef CAS.
- M. G. Mortuza, R. Dupree and D. Holland, J. Non-Cryst. Solids, 2001, 281, 108–116 CrossRef CAS.
- L. Olivier, X. Yuan, A. N. Cormack and C. Jäger, J. Non-Cryst. Solids, 2001, 53–66 CrossRef CAS.
- A. Meyer, J. Horbach, W. Kob, F. Kargl and H. Schober, Phys. Rev. Lett., 2004, 93, 027801 CrossRef CAS PubMed.
- B. Gee and H. Eckert, J. Phys. Chem., 1996, 100, 3705–3712 CrossRef CAS.
- G. N. Greaves, A. Fontaine, P. Lagarde, D. Raoux and S. J. Gurman, Nature, 1981, 293, 611–616 CrossRef CAS.
- Y. Foucaud, M. Badawi, L. O. Filippov, O. Barres, I. V. Filippova and S. Lebègue, Chem. Sci., 2019, 10, 9928–9940 RSC.
- K. Baral and W. Y. Ching, J. Appl. Phys., 2017, 121, 245103 CrossRef.
- K. Baral, A. Li and W.-Y. Ching, J. Phys. Chem. A, 2017, 121, 7697–7708 CrossRef CAS PubMed.
- S. Kikuchi, N. Koga, H. Seino and S. Ohno, J. Nucl. Sci. Technol., 2016, 53, 682–691 CrossRef CAS.
- A. Bunde, M. Ingram, P. Maass and K. Ngai, J. Non-Cryst. Solids, 1991, 131–133, 1109–1112 CrossRef CAS.
- R. L. McGreevy and L. Pusztai, Mol. Simul., 1988, 1, 359–367 CrossRef.
- S. Ispas, M. Benoit, P. Jund and R. Jullien, Phys. Rev. B: Condens. Matter Mater. Phys., 2001, 64, 214206 CrossRef.
- A. Pandey, P. Biswas and D. A. Drabold, Phys. Rev. B: Condens. Matter Mater. Phys., 2015, 92, 155205 CrossRef.
- Y. Ginetti, Bull. Soc. Chim. Belg., 2010, 63, 460–469 CrossRef.
- H. Vllenkle, A. Wittmann and H. Nowotny, Monatsh. Chem., 1971, 102, 964–970 CrossRef.
- D. W. J. Cruickshank, A. Kálmán and J. S. Stephens, Acta Crystallogr., Sect. B: Struct. Crystallogr. Cryst. Chem., 1978, 34, 1333–1334 CrossRef.
- A. R. West and A. J. Blake, J. Mater. Sci., 1976, 11, 801–808 CrossRef CAS.
- R. Zosiamliana, Lalrinkima, B. Chettri, G. Abdurakhmanov, M. P. Ghimire and D. P. Rai, RSC Adv., 2022, 12, 12453–12462 RSC.
- R. Dovesi, A. Erba, R. Orlando, C. M. Zicovich-Wilson, B. Civalleri, L. Maschio, M. Rérat, S. Casassa, J. Baima, S. Salustro and B. Kirtman, Wiley Interdiscip. Rev. Comput. Mol. Sci., 2018, 8, e1360 CrossRef.
- J. P. Perdew, K. Burke and M. Ernzerhof, Phys. Rev. Lett., 1997, 78, 1396 CrossRef CAS.
- D. Vilela Oliveira, J. Laun, M. F. Peintinger and T. Bredow, J. Comput. Chem., 2019, 40, 2364–2376 CrossRef CAS PubMed.
- M. F. Peintinger, D. V. Oliveira and T. Bredow, J. Comput. Chem., 2013, 34, 451–459 CrossRef CAS.
- H. J. Monkhorst and J. D. Pack, Phys. Rev. B: Solid State, 1976, 13, 5188–5192 CrossRef.
- A. Grund and M. Pizy, Acta Crystallogr., 1952, 5, 837–840 CrossRef CAS.
- F. D. Murnaghan, Am. J. Math., 1937, 59, 235 CrossRef.
- F. Birch, Phys. Rev., 1947, 71, 809–824 CrossRef CAS.
- D. Kalita, M. Ram, N. Limbu, R. Kalita and A. Saxena, J. Solid State Chem., 2022, 310, 122999 CrossRef CAS.
- P. Vashishta, R. K. Kalia, J. P. Rino and I. Ebbsjö, Phys. Rev. B: Condens. Matter Mater. Phys., 1990, 41, 12197–12209 CrossRef CAS PubMed.
- J. Sarnthein, A. Pasquarello and R. Car, Phys. Rev. Lett., 1995, 74, 4682–4685 CrossRef CAS PubMed.
- K. N. Subedi, V. Botu and D. A. Drabold, Phys. Rev. B, 2021, 103, 134202 CrossRef CAS.
- R. Greegor, F. Lytle, J. Kortright and A. Fischer-Colbrie, J. Non-Cryst. Solids, 1987, 89, 311–325 CrossRef CAS.
- W. Y. Ching, R. A. Murray, D. J. Lam and B. W. Veal, Phys. Rev. B: Condens. Matter Mater. Phys., 1983, 28, 4724–4735 CrossRef CAS.
- G. H. Sigel, Treatise on Materials Science and Technology, Academic press, INC, 1977, vol. 12, pp. 5–89 Search PubMed.
- Y. Wang, A. Zavabeti, F. Haque, B. Y. Zhang, Q. Yao, L. Chen, D. Chen, Y. Hu, N. Pillai, Y. Liu, K. A. Messalea, C. Yang, B. Jia, D. M. Cahill, Y. Li, C. F. McConville, J. Z. Ou, L. Kong, X. Wen and W. Yang, Mater. Today, 2022, 55, 21–28 CrossRef CAS.
- W. Perger, J. Criswell, B. Civalleri and R. Dovesi, Comput. Phys. Commun., 2009, 180, 1753–1759 CrossRef CAS.
- A. Erba, A. Mahmoud, R. Orlando and R. Dovesi, Phys. Chem. Miner., 2014, 41, 151–160 CrossRef CAS.
- F. Mouhat and F.-X. Coudert, Phys. Rev. B: Condens. Matter Mater. Phys., 2014, 90, 224104 CrossRef.
- Q. Guo, K. C. Lau and R. Pandey, J. Phys. Chem. C, 2019, 123, 4674–4681 CrossRef CAS.
- C. Acoustics and M. J. P. Musgrave, Geophys. J. R. Astron. Soc., 1971, 24, 207–211 Search PubMed.
- W.-Y. Zhou, Z. Ren, J. S. Zhang, B. Chen, M. Hao, T. Ohuchi, L. Miyagi, D. Zhang, E. E. Alp, B. Lavina and B. Schmandt, Earth Planet. Sci. Lett., 2021, 565, 116955 CrossRef CAS.
- L. Kleinman, Phys. Rev., 1962, 128, 2614–2621 CrossRef CAS.
- M. Fine, L. Brown and H. Marcus, Scr. Metall., 1984, 18, 951–956 CrossRef CAS.
- H. Zhang, Y. Tang, X. Zhong, Y. Zhang, H. Song, J. Wang and Q. Wang, Mater. Res. Express, 2019, 6, 056507 CrossRef CAS.
- A. Meshalkin and A. Kaplun, Russ. J. Inorg. Chem., 2003, 48, 1567–1569 Search PubMed.
- W. Voigt, Lehrbuch der Kristallphysik, References – Scientific Research Publishing, Teubner Verlag, Leipzig, 1928 Search PubMed.
- A. Reuss, J. Appl. Math. Mech., 1929, 9, 49–58 CAS.
- R. Hill, Proc. Phys. Soc., London, Sect. A, 1952, 65, 349–354 CrossRef.
- J. P. Watt and L. Peselnick, J. Appl. Phys., 1980, 51, 1525–1531 CrossRef CAS.
- A. Gujral, L. Yu and M. Ediger, Curr. Opin. Solid State Mater. Sci., 2018, 22, 49–57 CrossRef CAS.
- A. C. Holt and M. Ross, Phys. Rev. B: Condens. Matter Mater. Phys., 1970, 1, 2700–2705 CrossRef.
- D. Muñoz-Santiburcio, A. Hernández-Laguna and J. I. Soto, Comput. Phys. Commun., 2015, 192, 272–277 CrossRef.
- D. Damjanovic and R. E. Newnham, J. Intell. Mater. Syst. Struct., 1992, 3, 190–208 CrossRef.
- E. Aksel and J. L. Jones, Advances in lead-free piezoelectric materials for sensors and actuators, 2010 Search PubMed.
- M. T. Chorsi, E. J. Curry, H. T. Chorsi, R. Das, J. Baroody, P. K. Purohit, H. Ilies and T. D. Nguyen, Adv. Mater., 2019, 31, 1802084 CrossRef PubMed.
- A. Zaszczyńska, A. Gradys and P. Sajkiewicz, Polymers, 2020, 12, 2754 CrossRef PubMed.
- Y. Noel, C. M. Zicovich-Wilson, B. Civalleri, P. D'Arco and R. Dovesi, Phys. Rev. B: Condens. Matter Mater. Phys., 2001, 65, 014111 CrossRef.
- R. Resta, Rev. Mod. Phys., 1994, 66, 899–915 CrossRef CAS.
- R. D. King-Smith and D. Vanderbilt, Phys. Rev. B: Condens. Matter Mater. Phys., 1993, 47, 1651–1654 CrossRef CAS.
- D. Vanderbilt, J. Phys. Chem. Solids, 2000, 61, 147–151 CrossRef CAS.
- R. Tarumi, K. Nakamura, H. Ogi and M. Hirao, J. Appl. Phys., 2007, 102, 113508 CrossRef.
- A. Erba, K. E. El-Kelany, M. Ferrero, I. Baraille and M. Rérat, Phys. Rev. B: Condens. Matter Mater. Phys., 2013, 88, 035102 CrossRef.
- Y. Wang, X. Guo, L. H. Li, J. Zhang, G. K. Li, A. Zavabeti and Y. Li, ACS Appl. Nano Mater., 2022 DOI:10.1021/acsanm.2c01871.
- Y. Wang, L.-M. Vu, T. Lu, C. Xu, Y. Liu, J. Z. Ou and Y. Li, ACS Appl. Mater. Interfaces, 2020, 12, 51662–51668 CrossRef CAS PubMed.
|
| This journal is © The Royal Society of Chemistry 2022 |
Click here to see how this site uses Cookies. View our privacy policy here. 
 Open Access Article
 This Open Access Article is licensed under a Creative Commons Attribution-Non Commercial 3.0 Unported Licence
 d,
J. R. Sambrano
d,
J. R. Sambrano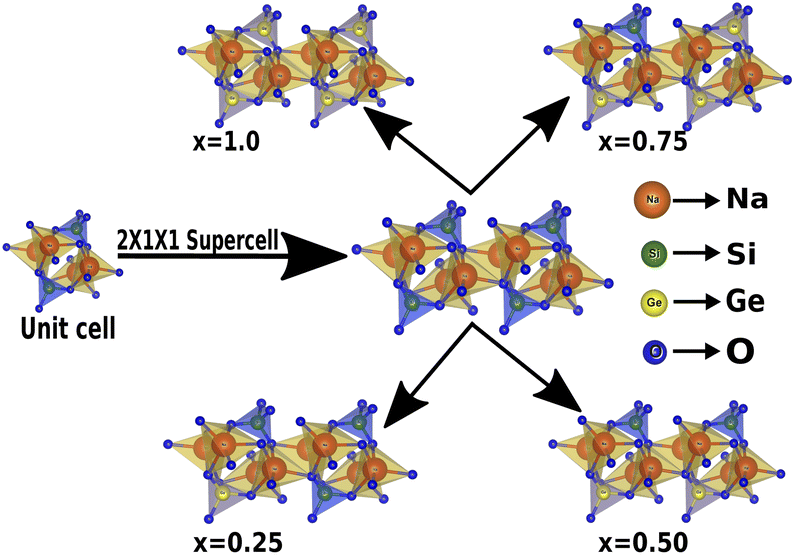


 and α = 1.0 parameters, respectively. Thus the discrepancy that arises in the band gap calculation is due to the choice of different exchange parameters. Referring to Fig. 7, it is clear that with the increase in doping concentration, the Eg gradually decreases to a minimum value of Eg = 3.1327 eV. It is obvious that doping of any materials with heavier elements should reduce the band gap and enhance the mobility of electrons between the VB and CB due to the introduction of extra bands near the Fermi level. Interestingly, for even doping concentrations [see Fig. 5(a, c and e)], we have observed the last two bands of the CB intersecting along the X-symmetry while these characteristics are not visible in odd doping [see Fig. 5(b and d)]. This suggests that for even doping the last two bands of the CB are possibly contributed by the Na-s orbital.

 (see Table 6). The critical value for the transition from ductile materials to brittle ones is 1.75 (i.e., k > 1.75 indicates a ductile material). It is well known that in crystallography the isotropy or anisotropy of a material plays an important role. Making use of the elastic stiffness tensors and elastic moduli, we have calculated the two anisotropic factors Aan and AU (see Table 5) given by:83
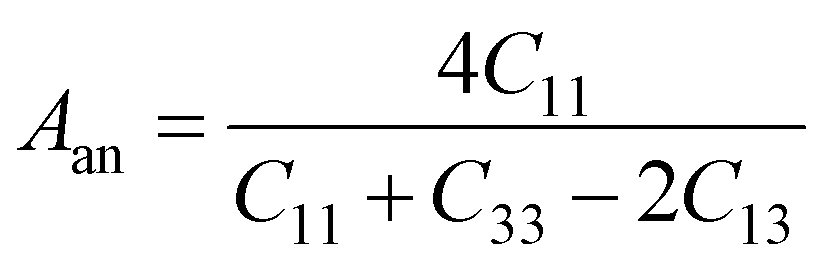
 and
and 

 is computed numerically by applying finite strains to the crystal lattice. The direct and converse piezoelectric tensors are closely related; the relationship between the tensors is given by: