 Open Access Article
New bio-based polyester with excellent spinning performance: poly(tetrahydrofuran dimethanol-co-ethylene terephthalate)
Yu-long Chen a,
Yue-song Mua,
Ze-jian He*a,
Xin-ming Pub,
Dong-qi Wanga,
Mi Zhou
 *a and
Li-ping Yang
 *b
*b
aCollege of Materials Science and Engineering, Zhejiang University of Technology, Hangzhou 310014, P. R. China. E-mail: zhoumi@zjut.edu.cn; hezejian@zjut.edu.cn
bWankai New Material Co., Ltd., Haining, 314415 China. E-mail: ostrich@mail.ustc.edu.cn
First published on 14th October 2022
Abstract
With the excessive consumption of fossil energy, technologies that transform bio-based resources into materials have received more and more attention from researchers in recent decades. In this paper, a series of poly(ethylene 2,5-tetrahydrofuran dimethyl terephthalate; PEFTs) with different components were synthesized from 2,5-tetrahydrofuran dimethanol (THFDM), terephthalic acid (TPA), and ethylene glycol (EG). Their chemical structures and compositions were determined by FTIR, 1H NMR, and 13C NMR. With the increase in THFDM content, the crystallization, Tm, and tensile strength of PEFTs gradually decrease because the introduced THFDM breaks the order of molecular chains, while the thermal stability and Tg remain stable. PEFTs seem to present a significant shear thinning phenomenon, which was indicated by the rheological test. Electrospinning technology was used to explore the spinnability of PEFT; it was found that PEFTs have better spinning performance than PET. In addition, due to the good hydrophobicity and porosity of PEFT nanofiber films, they have potential application value in the manufacture of hydrophobic nanofiber and filter films.
Introduction
With the excessive consumption of fossil energy and the negative impact of its exploitation on the environment, much attention is being paid to the study of renewable energy sources. Polyethylene terephthalate (PET) is the most widely used thermoplastic resin because of its excellent heat resistance, toughness, and electrical insulation. Although PET can be partially recycled, it is still one of the major sources of polymer waste.In contrast, bio-based materials are a sustainable resource because of their abundant reserves and low prices. Tapping renewable biological resources to prepare novel platform compounds is an important solution to the current energy crisis.1–4 5-Hydroxymethylfurfural (HMF) is an important platform compound that can be converted to a range of important bio-based materials, including 5-hydroxymethyl-2-furan carboxylic acid (HMFCA), 2,5-furandicarboxylic acid (FDCA), and 2,5-tetrahydrofuran dimethanol (THFDM), among others. Considering its important role as a biomass-derived intermediate, it has been regarded as one of the “highest value-added chemicals from biomass” for more than a decade5–10 Over the past decade of research, due to its similar chemical structure to TPA, FDCA seems to be the most desirable alternative. In addition, compared with PET, poly(ethylene 2,5-furandicarboxylate) (PEF) has higher heat resistance, better tensile strength, and excellent gas barrier properties.11–14
However, the elongation at the break of PEF is only about 5%, which greatly limits its application in certain fields. Therefore, it has become a focal point for researchers to find proper modifications of PEF by physical and chemical methods to obtain polyesters with excellent properties.15–21 Based on the results of current studies, by the introduction of flexible chain segments or linear monomers in PEF, the toughness of FDCA-based polyesters can be improved, but their heat resistance is reduced.22,23 However, the introduction of short branched chains and cyclic monomers can significantly improve the rigidity of polyesters.24,25 Xie et al. reported the copolymerization of poly(tetramethylene glycol) (PEMG) with different molecular weights on PEF, which was achieved by adjusting the content of PEMG.26 Wang et al. introduced a third monomer, 1,4-cyclohexanediol (CHDM), in PEF, which can provide better rigidity to the polyester due to its cyclic structure and non-planarity.27,28
THFDM is a non-planar five-membered cyclic tertiary diol formed by the homogeneous catalytic hydrogenation of HMF, but little research has been done on THFDM so far. Jin et al. copolymerized THFDM with PET and found that the higher oxygen atom content in THFDM made the polyester less thermally stable with better processability and higher transparency.29 However, there is still almost no research on the processing of this copolyester. In this paper (Scheme 1), a two-step method was used to copolymerize with THFDM, TPA, and EG as the monomers of copolymerization and C16H36TiO4 (TBT) as the catalyst. Copolymers with THFDM contents of 5%, 15%, 25%, and 35% were obtained, labeled as PEFT-5, PEFT-15, PEFT-25, and PEFT-35, and their chemical structures were verified. Their crystalline properties have also been intensively studied. In this paper, PET and PEFT nanofiber films were prepared by electrostatic spinning techniques and have been used as ideal substitutes for PET in terms of hydrophobic nanofiber materials.
Experiment
Materials
TPA (99%), EG (99%), and TBT (99%) were provided by Wankai New Material Company Limited (Haining, China). Chloroform (CHCl3) (99%) was purchased from Shanghai Titan Company. Trifluoroacetic Acid (TFA) (99%) and deuterated chloroform were obtained from Sarn Chemical Technologies Company. All the chemicals were used without further purification.Synthesis of PET and PEFTs copolyesters
As shown in Scheme 1, PET and PEFTs copolymers were synthesized by a two-stage melt polycondensation method using TPA, EG, and THFDM as raw materials, and the molar ratio of (EG + THFDM)/TPA was fixed at 1.5. In the first stage of the esterification reaction, TPA, EG, THFDM, and TBT (0.1 mol% based on TPA) were added to a 1 L reaction tank equipped with a mechanical stirrer. The temperature was raised to 260 °C with stirring, and the pressure in the kettle was controlled to reach 200–400 kPa. After reacting for 3 h, the pressure was released, and the esterified water was removed. In the second stage of the esterification reaction, the temperature was raised to 280 °C, and the vacuum was gradually drawn to 5–10 Pa. After 4 hours of reaction, N2 was passed through the system, and the reaction system was returned to atmospheric pressure to obtain the target product.Characterization
Intrinsic viscosities ([η]) of PEFT samples in a mixed solvent of phenol and 1,1,2,2-tetrachloroethane (60/40, w/w) were measured with a Ubbelohde viscometer at 30 °C.Carboxyl end-group concentration [COOH] was calculated according to eqn (1) as follows:
| [COOH] = (V − V0)c × 1000/m | (1) |
CIE color was measured according to Commission Internationale de L'Eclairage 1976 L*a*b* standard by a color-view color difference meter manufactured by BYK Gardener.
The sample was obtained via direct esterification at a high temperature to free the diethylene glycol with methanol. The content of diethylene glycol in the filtrate was then determined by gas chromatography.
The chemical structure of the samples was characterized by a Fourier transform infrared (KBr-FTIR) spectrophotometer (Thermo Fisher Scientific, Nicolet-6700, USA). The scanning range was 400 cm−1 to 4000 cm−1, and each sample was scanned 32 times with a resolution of 2 cm−1.
1H NMR spectra of samples in deuterium generation of chloroform were conducted with a Bruker Avance 500 MHz spectrometer with 16 scans at ambient temperature. 13C NMR spectra of samples in deuterium generation of chloroform were conducted with the same instrument with 1024 scans at ambient temperature. Tetramethylsilane (TMS) was used as an internal standard and chemical shift reference.
Thermal characteristics of the samples were recorded by a differential scanning calorimeter (SERIES 2000, Mettler-Swiss DSC). Measurements were performed under a nitrogen atmosphere with 5 mg of the sample placed in an alumina pan. Measurement was carried out as follows: the sample was heated from 25 °C to 300 °C at the rate of 20 °C min−1; it was then held for 10 min to eliminate the thermal history. Samples were cooled to 25 °C at 20 °C min−1 and heated again to 300 °C at 20 °C min−1.
Thermogravimetric Analysis (TGA) of PET and PEFTs was measured by heating from 25 to 800 °C with a heating rate of 20 °C min−1 in a dry nitrogen atmosphere, and the flow rate was 50 mL min−1. The equipment used was a thermal analyzer (TA Q5000IR, USA).
Rheological properties of the polyesters were investigated at 260 °C by using a capillary rheological equipped with a capillary die (D = 1.3 mm, L/D = 30) (Rosand RH7; BOHLIN Germany). The samples should be dried for 24 h before the experiment.
Dynamic rheological performance measurements were measured by an advanced extended rheometer (MCR302 Anton Paar). A parallel plate with a diameter of 25 mm was used to measure the shear rheological properties of the samples in oscillating mode. The complex viscosity (μ*), storage modulus (G′), and loss modulus (G′′) were recorded at a temperature of 270 °C as a function of angular frequency α. The rotor model was PP25; the gap value was 0.8 mm; the test frequency range was 10−1–102 rad s−1. The whole process was protected by nitrogen gas to avoid thermal oxidation and degradation during the test.
The electrospinning machine (SS2535H, Beijing, China) was used to prepare the copolyester films. TFA was used to dissolve PET and PEFTs. A TFA clear solution with a concentration of 16% was prepared by stirring at room temperature for 2 h. The solution was stored in a 5 mL syringe with a 0.5 mm diameter needle (type: 21G). The solution advance rate was maintained at 0.1 mm min−1. The aluminum foil was used as a receiver under a DC voltage of 10 kV, and the distance between the needle tip and the collector was 15 cm.
The co-polyester surface morphology was qualitatively evaluated by field emission scanning electron microscopy (SEM). Before imaging, a thin layer of platinum was sprayed on the sample surface, thus improving contrast and avoiding charge accumulation.
The water contact angle (WCA) of the fiber membrane was measured using an OCA30 Micro contact angle analyzer (Dataphysics, Germany), and the profile of the water droplet on the membrane was recorded for analysis.
Test of porosity (ε): a certain area of fiber membrane was cut, and the mass was measured to be m1. It was fully soaked in ethanol, and then the mass after soaking was weighed to be m2. Given that the density of ethanol is ρ1, the volume of ethanol (holes in the fiber membrane) can be obtained. In addition, a certain quantity of the bulk sample was taken, and after determining that there was no bubble inside, it was immersed in ethanol. The rise in liquid volume is the volume of the sample, and the density formula was used to obtain the density of sample ρ2. Each sample was tested five times and the test results were averaged. ε can be obtained from eqn (2):
 | (2) |
Wide angle X-ray diffraction (WAXD) patterns of the polyesters were recorded by using an X-ray diffractometer (D/max-Ultima IV, Japan) with CuKα radiation (1.542 A). The WAXD spectra were obtained by scanning in a 2θ range from 5° to 45° at a scanning rate of 5° min−1 and a step size of 0.02°. The working voltage was 40 kV while the current was 20 mA.
The tensile properties of polyester films were characterized with a universal testing machine (INSTRON 5966, USA) at room temperature. The samples were dissolved in a mixed solution of CHCl3-TFA with a volume ratio of 4![[thin space (1/6-em)]](https://www.rsc.org/images/entities/char_2009.gif) :
:![[thin space (1/6-em)]](https://www.rsc.org/images/entities/char_2009.gif) 1 at a concentration of 9%. The slide was placed in the oven at a constant temperature of 70 °C for preheating. When the temperature was constant, the slide was immersed in the solution and quickly removed. The slide was kept in the oven at a constant temperature until the solvent was volatilized and the film was removed. The film was soaked in water to separate the film from the slide. The thickness of the film was measured to be 10 μm by SEM.42 A 500 N load cell was used to test the samples at a rate of 10 mm min−1. Each kind of sample was measured at least five times.
1 at a concentration of 9%. The slide was placed in the oven at a constant temperature of 70 °C for preheating. When the temperature was constant, the slide was immersed in the solution and quickly removed. The slide was kept in the oven at a constant temperature until the solvent was volatilized and the film was removed. The film was soaked in water to separate the film from the slide. The thickness of the film was measured to be 10 μm by SEM.42 A 500 N load cell was used to test the samples at a rate of 10 mm min−1. Each kind of sample was measured at least five times.
Results and discussion
The chemical structure and composition of PEFTs
The chemical structure determination of PET and PEFTs was the priority. Fig. 1(a) shows the FTIR spectra of PET and PEFTs. It can be observed that the absorption peaks near 2800 cm−1 are attributed to methylene (–CH2–), and those around 1400 cm−1 are attributed to carbon–carbon double bond (C![[double bond, length as m-dash]](https://www.rsc.org/images/entities/char_e001.gif) C). The peaks of carbonyl (C
C). The peaks of carbonyl (C![[double bond, length as m-dash]](https://www.rsc.org/images/entities/char_e001.gif) O) and carbon–oxygen bond (–C–O–) are observed at around 1700 cm−1 and 1100 cm−1, respectively. Furthermore, the absorption peak intensities of the methylene (–CH2–) group and carbon–oxygen bond (–C–O–) gradually increased as the THFDM content increased, indicating that the copolyesters were successfully synthesized. The absorption peak at 3000–3500 cm−1 is the residual H2O in the KBr powder. To further determine the structure of the copolyesters, 13C NMR spectra were recorded. Fig. 1(b) shows the assignment of different carbon atoms on PEFT-35. Due to the inductive effect, the carbon on the benzene ring is split into multiple peaks. In conclusion, it can be easily seen that the signals of different carbon atoms are easily assigned and the chemical structure of PEFT is determined well.
O) and carbon–oxygen bond (–C–O–) are observed at around 1700 cm−1 and 1100 cm−1, respectively. Furthermore, the absorption peak intensities of the methylene (–CH2–) group and carbon–oxygen bond (–C–O–) gradually increased as the THFDM content increased, indicating that the copolyesters were successfully synthesized. The absorption peak at 3000–3500 cm−1 is the residual H2O in the KBr powder. To further determine the structure of the copolyesters, 13C NMR spectra were recorded. Fig. 1(b) shows the assignment of different carbon atoms on PEFT-35. Due to the inductive effect, the carbon on the benzene ring is split into multiple peaks. In conclusion, it can be easily seen that the signals of different carbon atoms are easily assigned and the chemical structure of PEFT is determined well.
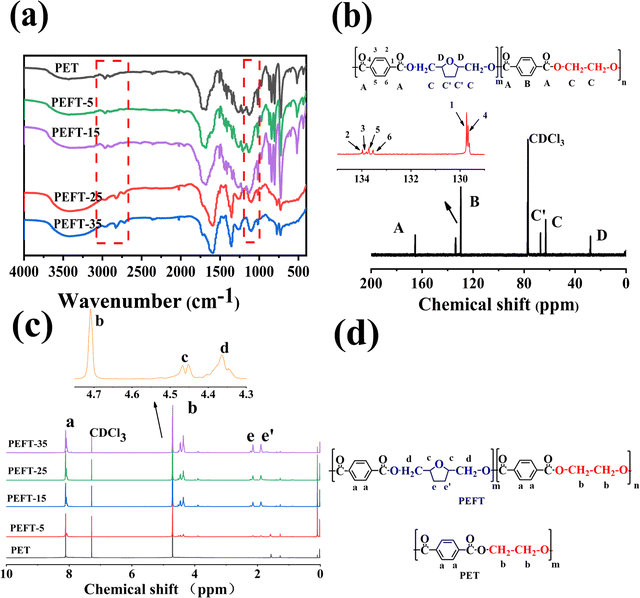 | ||
| Fig. 1 (a): KBr-FTIR spectra of PET and PEFTs, (b): 13C NMR of PEFT-15, (c): 1H NMR of PET and PEFTs, (d): chemical structure of PET and PEFT. | ||
1H NMR spectra of PET and PEFTs are also shown in Fig. 1(c). As shown in Fig. 1(c) and (d), the characteristic resonance peaks at 8 ppm are attributed to the aryl (Ph-H). The composition of the PEFTs is determined by the ratio of the peak areas of the aryl (Ph-H) (a) and methylene (C–CH2–C) (e and e′). As shown in Table 1, the content of THFDM in the copolymers matched with the corresponding THFDM![[thin space (1/6-em)]](https://www.rsc.org/images/entities/char_2009.gif) :
:![[thin space (1/6-em)]](https://www.rsc.org/images/entities/char_2009.gif) TPA feed ratio, which demonstrates the successful synthesis of the copolymers. Additionally, the peaks at 4.3–4.5 ppm are attributed to methylene (–CH2–O) (d) and methine (–CH<) (c), respectively. It is noteworthy that there is no corresponding position on the molecular chain which matched the peaks at 1.5–2.0 ppm. Therefore, we speculate that there may be some residual TBT after the synthesis process.
TPA feed ratio, which demonstrates the successful synthesis of the copolymers. Additionally, the peaks at 4.3–4.5 ppm are attributed to methylene (–CH2–O) (d) and methine (–CH<) (c), respectively. It is noteworthy that there is no corresponding position on the molecular chain which matched the peaks at 1.5–2.0 ppm. Therefore, we speculate that there may be some residual TBT after the synthesis process.
| Sample | THFDM/TPA in feedinga | THFDM/TPA in copolyestersb | [η]c dL g−1 | –COOHd mmol Kg−1 | DEGe % | Colorf | ||
|---|---|---|---|---|---|---|---|---|
| L | a | b | ||||||
| a The ratio of A and B in the cast and copolymer is calculated as a molar ratio.b Mole fraction of THFDM in the polyesters as determined by integration of 1H NMR spectra.c Intrinsic viscosity (dL g−1) obtained in phenol tetrachloroethane mixture (60/40, w/w) at 30 °C.d [COOH] was calculated by the following formula: [COOH] = (V − V0)c × 1000/m.e Content of DEG detected by methanol ester exchange method.f After the sample was crushed, the color of the sample was tested by automatic colorimetry. | ||||||||
| PET | 0/100 | 0/100 | 0.670 | 23.1 | 3.95 | 68.4 | −1.3 | 12.4 |
| PEFT-5 | 5/100 | 7/100 | 0.668 | 25.1 | 3.18 | 63.1 | 0.8 | 14.0 |
| PEFT-15 | 15/100 | 9/100 | 0.672 | 24.6 | 1.98 | 60.8 | 0.2 | 17.5 |
| PEFT-25 | 25/100 | 22/100 | 0.702 | 23.0 | 1.35 | 38.1 | 5.1 | 13.7 |
| PEFT-35 | 35/100 | 37/100 | 0.689 | 20.7 | 0.89 | 52.7 | 3.7 | 20.1 |
For polyesters, the [COOH] content, DEG content, and the data of color value are listed in Table 1. Additionally, it can be observed that the [η] number varies between 0.63–0.7, and the [COOH] content varies between 20–25, indicating that there are no significant differences among the molecular weight of all samples. All the samples are up to par with the standard bottle-grade PET. DEG content and color value are two important indicators in the PET production process. The introduction of ether bonds from DEG destroys the regularity of the molecular chain, which leads to poor crystallinity and heat resistance. The thermal degradation of polyester and the pigmented ethylene and gel produced by thermal degradation are among the reasons for the increase in “b” value. In this study, with an increase in the THFDM content, the “b” value of copolyester showed an overall upward trend. This is because the reactivity of THFDM is lower than that of EG, which increases the reaction time and temperature; the resulting oligomers,43,44 colored ethylene and gel, work together to increase the “b” value.
Thermal performance analysis
The thermal stability of PET and PEFTs was tested by TGA in an N2 atmosphere, and the TGA data are summarized in Table 2. Compared with PET, the temperature at 5% loss of mass of PEFT (Td5%) is around 380 °C, exhibiting a slight dependence on composition. The temperature at which the mass loss is the fastest (Tdmax) and residual mass at 600 °C (W600) showed a gradual decrease. This may be because the polymer chains contain a large number of ether bonds, which are unstable and more likely to be decomposed at high temperatures. Fig. 2(a and b) shows the DSC curves of PET and PEFTs, and the related data are listed in Table 2. The melting temperature (Tm), melting enthalpy (ΔHm), cold crystallization temperature (Tcc), and cold crystallization enthalpy (ΔHcc) were obtained from the second heating scans. The crystallization temperature (Tc) and enthalpy (ΔHc) were obtained from the cooling scans. It is worth noting that with the increase in THFDM content, both Tc and ΔHc of PEFTs showed a downward trend, and there was no crystallization peak when the THFDM content was greater than 5%. This may be attributed to the fact that PEFTs are random copolymers, and the introduction of THFDM destroys the order of molecular chains. The Tcc of all samples showed a similar trend, but PET showed no cold crystallization which may be because the PET used in this study had higher crystallinity. From the secondary heating scan curve, it was found that with the increase in THFDM content, the Tm and ΔHm of PEFTs decreased gradually. There is no melting peak when the THFDM content is greater than 15% because the introduction of THFDM disrupts the molecular chain structure and the PEFTs become completely amorphous polymers when the copolymerization content exceeds 15%. However, as shown in Table 2, the Tg of PEFTs was only slightly decreased, and this phenomenon has been reported in previous work.29 It is due to the equilibrium between the cyclic rigid structure of THFDM and the effect of ether bonds on Tg.| Sample | DSC | TGA | ||||||||
|---|---|---|---|---|---|---|---|---|---|---|
| Cooling scan | Second heating scan | |||||||||
| Tc (°C) | ΔHc (J g−1) | Tg (°C) | Tcc (°C) | ΔHcc (J g−1) | Tm (°C) | ΔHm (J g−1) | Td5% (°C) | Tdmax (°C) | W600 (%) | |
| PET | 181.63 | 40.63 | 76.76 | — | — | 243.06 | 40.41 | 383 | 450 | 11.62 |
| PEFT-5 | 153.73 | 31.45 | 75.12 | 150.19 | 11.54 | 230.93 | 31.45 | 383 | 448 | 11.20 |
| PEFT-15 | — | — | 74.19 | — | — | 208.34 | — | 384 | 447 | 10.78 |
| PEFT-25 | — | — | 72.98 | — | — | — | — | 377 | 441 | 10.02 |
| PEFT-35 | — | — | 72.33 | — | — | — | — | 382 | 438 | 6.90 |
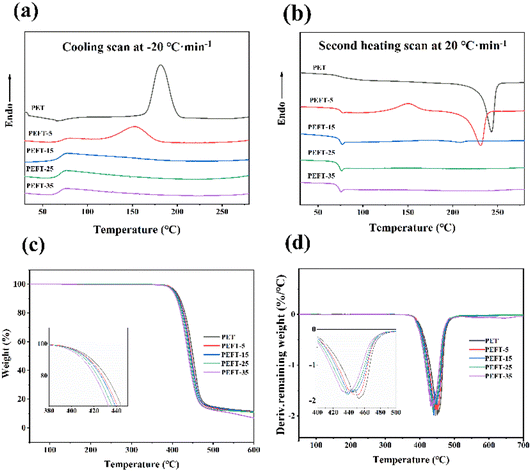 | ||
| Fig. 2 DSC, TGA, and DTG curves of samples: (a) cooling scan at 20 °C min−1, (b) second heating scan at 20 °C min−1, (c) TGA curves of samples, (d) DTG curves of samples. | ||
Rheological properties investigation
The relationship between apparent shear viscosity (ηa) and apparent shear rate (γa) of PET and PEFTs at 250 °C is shown in Fig. 3(a). It can be observed that both PET and PEFTs exhibit typical non-Newtonian fluid behavior, i.e., the apparent viscosity decreases with increasing shear rate. It can be explained that when the shear rate increases, the entanglement points on the molecular chains are disentangled. At the same time, the molecular chains are oriented under shear stress, decreasing the resistance of the entangled macromolecular chains. The apparent viscosity is reduced under the combined action of these two factors. In addition, it is not difficult to observe the decrease in apparent viscosity with increasing THFDM content, which is attributed to the instability of the ether bond, where the entanglement points provided by O can be opened more easily. The dynamic viscosity of the samples was measured at 250 °C to explore the effect of the addition of THFDM on the rheological properties of PET. Fig. 3(b) reports the relationship between the complex viscosity (η*) and the angular frequency (ω).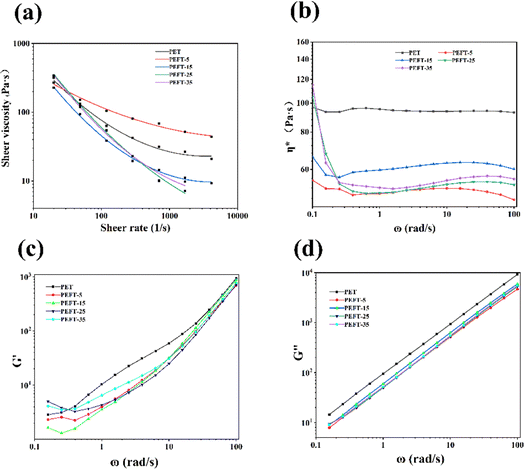 | ||
| Fig. 3 The apparent shear viscosity (a); complex viscosity (b); storage modulus, G′ (c); loss modulus, G′′ (d) of samples versus frequency. | ||
A decrease in η* with increasing shear frequency can be observed over the whole frequency range, which is typical of polymer shear thinning phenomena. In particular, the variation range of η* becomes progressively larger as the THFDM copolymer content increases. For example, when the shear rate increases to 100 rad s−1, η* decreases from 55.2 Pa s to 47.5 Pa s for PEFT-5 and 114.1 Pa s to 55.7 Pa s for PEFT-35. This is due to the stronger electronegativity in THFDM creating more entanglement sites in PEFT, which are more easily disentangled when the shear rate increases.
The storage modulus (G′) and loss modulus (G′′) versus angular frequency are shown in Fig. 3(c and d). It can be found that G′ and G′′ of PET are greater than those of PEFTs because PEFTs have a smaller complex viscosity than PET. It is worth noting that at angular frequencies of less than 0.3 rad s−1, the G′ of PEFT-25 and PEFT-35 is greater than that of PET, while that of PEFT-5 and PEFT-15 is lesser because the viscosity of the polymer dominates at this point, and the interactions between molecular chains increase with an increase in viscosity. While the angular frequency is greater than 0.4 rad s−1, the introduction of THFDM disrupts the orderliness of the molecular chains and increases the mobility of the chains. In addition, the variation in G′ is much greater than G′′, which shows that the viscosity of the polyester dominates as the sheer frequency increases.
Crystal structure and mechanical properties
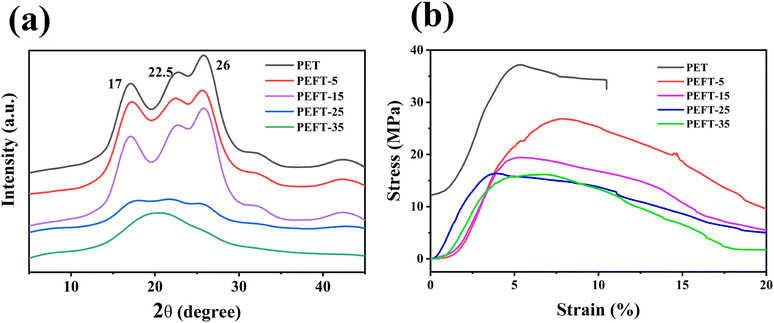
It is well known that the crystal structure of PEF is strongly influenced by the experimental conditions. Two different crystal structures, α-type and α′-type, are obtained at high (Tc ≥ 170 °C) and low crystallization temperatures (Tc ≤ 170 °C), respectively.28 Besides, the β-type crystals can be formed by solvent induction. In this work, the samples were dissolved in TFA solution and their XRD patterns were recorded at room temperature after TFA was evaporated. Fig. 4(a) shows that PET exhibits strong diffraction peaks at 17°, 22.5°, and 26° after treatment. It can be observed that the diffraction peaks of PEFT-5 and PEFT-15 are almost unchanged, indicating that THFDM does not change the crystal structure of PET. Moreover, PEFT-25 exhibits weak diffraction peaks and PEFT-35 has almost no diffraction peaks. This may be because the molecular chain orderliness has been disrupted more severely in PEFT-25 and PEFT-35, which makes rearrangement more difficult.It can be seen from Fig. 4(b) that PET films have an obvious brittle fracture, but all PEFT films have no obvious fracture point, and the tensile stress of PEFT films gradually decreases with the increase of THFDM content. From the results of TFA-induced crystallization, it can also be seen that with the increase in THFDM content, molecular chain rearrangement becomes more and more difficult. This is also due to the increased destruction of molecular chain structure by THFDM, which makes PEFT films exhibit soft and weak inverse characteristics.
Co-polyesters film morphology and wettability
Polyester nanofibers have been widely used in protective textiles, filtration, biomedicine (tissue engineering, drug delivery, etc.), chemical sensors, wound dressings, nanocatalysis, etc. because of their extremely high specific surface area and multi-vacant structure.30–38 Electrostatic spinning is regarded as an important and promising way to produce nanofibers.39 Most of the research on PET electrospinning used a mixed solvent of TFA and CH2Cl2. During the spinning process, the volatilization of CH2Cl2 is unavoidable, resulting in a honeycomb-like rough structure on the fiber surface, and an inevitable decrease in the strength of the fibers.40,41 Therefore, this study only uses TFA as a solvent to make the surface of the fibers smoother. The SEM images of nanofibers with different copolymer compositions are shown in Fig. 5. PET nanofibers and the copolyester nanofibers with lower fractions (PEFT-5, PEFT-15) show larger bead size and irregular diameter distribution. With an increase in THFDM copolymer content, the nanofibers gradually became uniform in diameter with fewer beads. In general, with THFDM content increasing, the copolyesters exhibited better spinnability, more uniform diameter, and fewer bead numbers. If the concentration of the spinning solution is low or the stirring is not uniform, the intertwining forces between the polymer chains become weak and are not enough to resist the electrostatic repulsion during the spinning process, and thus, they would break after a short stretch. Under the action of surface tension, the liquid stream would rapidly shrink into spherical droplets or beads. In the case of equal concentrations, we believe that the spinning solution is not uniform. TFA has better solubility for PEFT and can obtain a more uniform spinning solution.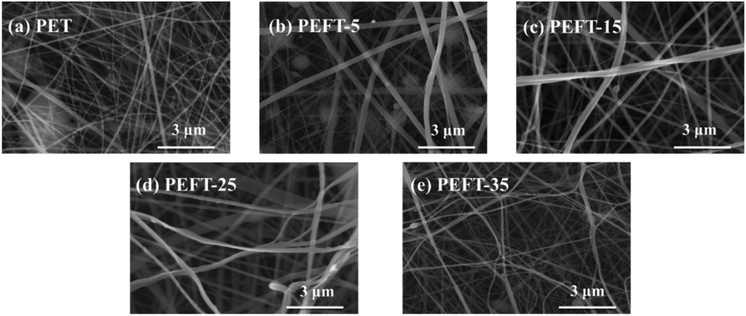 | ||
| Fig. 5 SEM images for PET and PEFTs nanofiber which are produced by electrospinning at different ratios of PEFTs: (a) pure PET, (b) PEFT-5, (c) PEFT-15, (d) PEFT-25, (e) PEFT-35. | ||
It is worth noting that, unlike previous studies, the enhancement of polarity can lead to a decrease in WCA.29 As shown in Fig. 6, as compared to the polyester films of PEFT-25 and PEFT-35 obtained by the coating method, the nanofiber films have higher hydrophobicity. Mainly attributed to the high specific surface area of the nanofiber membrane surface, which makes the surface tension of water stronger, and water droplets cannot penetrate the fiber membrane.
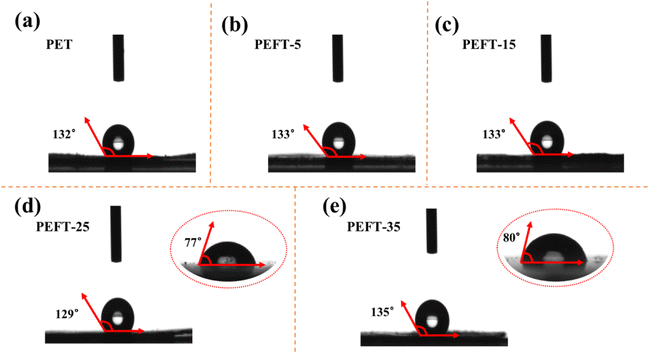 | ||
| Fig. 6 Water contact angle of sample nanofibrous membrane (a–e) as well as water contact angle of PEFT-25 (d) and PEFT-35 (e) films. | ||
Porosity
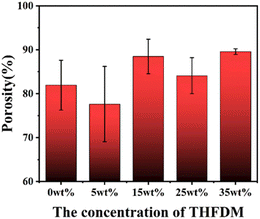
Generally, the higher the porosity, the larger the specific surface area and the better the permeability of the nanofiber membrane, which increases the deposition probability of the tiny particles suspended in the air on the surface of the fiber membrane. As can be seen from Fig. 7, the porosity of PEFTs is higher than that of PET in general, and the porosity of PEFT-35 is about 10% higher than that of PET in particular. This is also due to the more uniform morphology and less beading of PEFT fiber membranes.Conclusion
In this paper, THFDM extracted from HMF was randomly copolymerized into PET as a third monomer. The structure of the copolyester was determined by FTIR, 1H NMR, and 13C NMR. The thermal and rheological properties of the copolyester differed significantly from those of PET due to the disruption of the ordering of the molecular chain and the effect of ether bonding by THFDM. In addition, the spinnability of the PEFT copolyester gradually increased with an increase in the THFDM copolymerization content, which was attributed to the disruption of the crystallinity of PET by THFDM. It is worth mentioning that PEFT nanofibers maintained ultra-high hydrophobicity as compared to PET. We believe that PEFTs have potential applications in hydrophobic fiber materials.Conflicts of interest
There are no conflicts of interest to declare.Acknowledgements
The authors gratefully acknowledge the fund support of China Zhejiang Wankai New Materials Co., Ltd. (No. 2021C01062).References
- S. Park, S. Thanakkasaranee, H. Shin, Y. Lee, G. Tak and J. Seo, Polymers, 2021, 13, 728 CrossRef CAS PubMed.
- V. Siracusa and I. Blanco, Polymers, 2020, 12, 1641 CrossRef CAS PubMed.
- G. Q. Wang, Y. Liang, M. Jiang, Q. Zhang, R. Wang, H. H. Wang and G. Y. Zhou, Polym. Degrad. Stab., 2019, 168, 108942 CrossRef CAS.
- J. L. Zhou, Q. Q. Zhu, W. N. Pan, H. G. Xiang, Z. X. Hu and M. F. Zhu, Macromol. Rapid Commun., 2021, 42, 2000498 CrossRef CAS PubMed.
- L. Z. Zhou, L. B. Wu, P. K. Qin and B. G. Li, Polym. Degrad. Stab., 2021, 187, 109546 CrossRef CAS.
- A. Cadu, K. Sekine, J. Mormul, D. M. Ohlmann, T. Schaub and A. S. K. Hashmi, Green Chem., 2018, 20, 3386–3393 RSC.
- M. Sajid, X. B. Zhao and D. H. Liu, Green Chem., 2018, 20, 5427–5453 RSC.
- X. H. Chadderdon, D. J. Chadderdon, T. Pfennig, B. H. Shanks and W. Li, Green Chem., 2019, 21, 6210–6219 RSC.
- B. Zhu, C. Chen, L. Huai, Z. Zhou, L. Wang and J. Zhang, Appl. Catal., B, 2021, 297, 120396 CrossRef CAS.
- S. Krawielitzki, Chimia, 2020, 74, 776–778 CrossRef CAS PubMed.
- S. Y. Jia, X. J. He and Z. W. Xu, RSC Adv., 2017, 7, 392221–392227 Search PubMed.
- M. Soccio, D. E. Martinez-Tong, G. Guidotti, B. Robles-Hernandez, A. Munari, N. Lotti and A. Alegria, Polymers, 2020, 12, 1355 CrossRef CAS PubMed.
- Y. Yang, A. P. Tian, Y. J. Fang, J. G. Wang and J. Zhu, Chin. J. Polym. Sci., 2020, 38, 1099–1106 CrossRef CAS.
- W. Zhang, Q. Wang, G. Wang and S. Liu, E-Polymers, 2021, 22, 1–11 CrossRef.
- K. J. Luo, Y. Wang, J. R. Yu, J. Zhu and Z. M. Hu, RSC Adv., 2016, 6, 87013–87020 RSC.
- M. Hernández-López, Z. N. Correa-Pacheco, S. Bautista-Baños, L. Zavaleta-Avejar, J. J. Benítez-Jiménez, M. A. Sabino-Gutiérrez and P. Ortega-Gudiño, Mater. Chem. Phys., 2019, 234, 345–353 CrossRef.
- H. Hu, R. Y. Zhang, L. Shi, W. B. Ying, J. G. Wang and J. Zhu, Ind. Eng. Chem. Res., 2018, 57, 11020–11030 CrossRef CAS.
- S. Kuciel and K. Mazur, PCM, 2019, 634, 012009 CAS.
- G. Q. Wang, J. Y. Yu, M. Jiang, R. Wang, Y. Liang and G. Y. Zhou, Polym. Test., 2020, 91, 106771 CrossRef CAS.
- J. G. Wang, X. Q. Liu, Z. Jia, Y. Liu, L. Y. Sun and J. Zhu, J. Polym. Sci., Part A: Polym. Chem., 2017, 55, 3298–3307 CrossRef CAS.
- X. S. Wang, Q. Y. Wang, S. Y. Liu, T. Sun and G. Y. Wang, Polym. Test., 2020, 81, 106284 CrossRef CAS.
- G. Z. Papageorgiou, D. G. Papageorgiou, Z. Terzopoulou and D. N. Bikiaris, Eur. Polym. J., 2016, 83, 202–229 CrossRef CAS.
- G. Q. Wang, M. Jiang, Q. Zhang, R. Wang and G. Y. Zhou, Polym. Degrad. Stab., 2017, 144, 121–127 CrossRef CAS.
- R. Quintana, A. m. de Ilarduya, A. Alla and S. Muñoz-Guerra, J. Polym. Sci., Part A: Polym. Chem., 2011, 49, 2252–2260 CrossRef CAS.
- T. Kim, J. M. Koo, M. H. Ryu, H. Jeon, S. M. Kim, S. A. Park, D. X. Oh, J. Park and S. Y. Hwang, Polymer, 2017, 132, 122–132 CrossRef CAS.
- H. Y. Xie, L. B. Wu, B. G. Li and P. Dubois, Polymer, 2018, 155, 89–98 CrossRef CAS.
- J. G. Wang, X. Q. Liu, Y. J. Zhang, F. Liu and J. Zhu, Polymer, 2016, 103, 1–8 CrossRef CAS.
- J. G. Wang, X. Q. Liu, Z. Jia, L. Y. Sun, Y. J. Zhang and J. Zhu, Polymer, 2018, 137, 173–185 CrossRef CAS.
- C. H. Jin, F. H. Ma, C. Li, Z. Tu, H. N. Wang and Z. Y. Wei, Eur. Polym. J., 2021, 161, 110832 CrossRef CAS.
- A. Arslan, M. Simsek, S. D. Aldemir, N. M. Kazaroglu and M. Gumusderelioglu, J. Biomater. Sci., Polym. Ed., 2014, 25, 999–1012 CrossRef CAS PubMed.
- A. Greiner and J. H. Wendorff, Angew. Chem., Int. Ed. Engl., 2007, 46, 5670–5703 CrossRef CAS PubMed.
- Z. M. Huang, Y. Z. Zhang, M. Kotaki and S. Ramakrishna, Compos. Sci. Technol., 2003, 63, 2223–2253 CrossRef CAS.
- I. Shepa, E. Mudra and J. Dusza, Mater, 2021, 21, 100543 CAS.
- P. Wang, W. Huang, Y. Zhang, J. Lin and P. Chen, J. Appl. Polym. Sci., 2020, 58, 320–329 CrossRef CAS.
- S. Megelski, J. Stephens, D. B. Chase and J. F. Rabolt, Macromolecules, 2002, 30, 8456–8466 CrossRef.
- S. Jalali, M. Montazer and R. M. A. Malek, Fibers Polym., 2018, 19, 2088–2096 CrossRef CAS.
- S. Jalali, M. Montazer and M. M. Rad, Carbohydr, 2021, 251, 117125 CrossRef CAS PubMed.
- A. Abbas, I. A. Said, M. A. Mohamed, S. A. Yasin, Z. A. Ali and I. H. Ahmed, IOP Conf. Ser.: Mater. Sci. Eng., 2018, 454, 012130 Search PubMed.
- L. Chen, R. E. O. Pelton and T. M. Smith, J. Cleaner Prod., 2016, 137, 667–676 CrossRef CAS.
- X. Yang, X. N. Wang, Y. Z. Du, Y. X. Zhang and Q. F. Wei, J. Textil. Res., 2012, 303, 1–5 CrossRef.
- M. Bognitzki, W. Czado, T. Frese, A. Schaper, M. Hellwig, M. Steinhart, A. Greiner and J. H. Wendorff, Adv. Mater., 2001, 13, 70 CrossRef CAS.
- H. M. Li and D. Y. Shen, Acta Polym. Sin., 1992, 1, 100–102 Search PubMed.
- M. Hoppe, P. De Voogt and R. Franz, Food Addit. Contam., Part A, 2018, 35, 2244–2255 CrossRef CAS PubMed.
- S. Ubeda, M. Aznar and C. Nerin, Anal. Bioanal. Chem., 2018, 410, 2377–2384 CrossRef CAS PubMed.
| This journal is © The Royal Society of Chemistry 2022 |


