 Open Access Article
Cardiac glycosides from Digitalis lanata and their cytotoxic activities†
Hong-Ying Yanga,
Ya-Xiong Chenab,
Shangwen Luoa,
Yi-Lin Heac,
Wei-Jiao Fenga,
Yue Suna,
Jian-Jun Chen*a and
Kun Gao *a
*a
aState Key Laboratory of Applied Organic Chemistry, College of Chemistry and Chemical Engineering, Lanzhou University, 222 Tianshui South Road, Chengguan District, Lanzhou, Gansu 730000, People's Republic of China. E-mail: chenjj@lzu.edu.cn; npchem@lzu.edu.cn
bKey Laboratory of Space Radiobiology of Gansu Province & CAS Key Laboratory of Heavy Ion Radiation Biology and Medicine, Institute of Modern Physics, Chinese Academy of Sciences, Lanzhou 730000, Gansu, China
cResearch Institute, Lanzhou Jiaotong University, Lanzhou 730070, People's Republic of China
First published on 16th August 2022
Abstract
Cardiac glycosides (CGs) are good candidates as drug leads in the treatment of cancer because of their structural diversities and potent biological activities. In this study, fifteen CGs including three new ones (1–3) were isolated from Digitalis lanata Ehrh. Their structures were elucidated by HRESIMS, NMR spectroscopic methods, including homonuclear and heteronuclear coupling constant analysis, and acid-catalyzed hydrolysis and derivatization analysis of the sugar chain. The cytotoxic activities of these CGs were evaluated against three human cancer cell lines (A549, HeLa and MCF-7 cell lines), and all of them showed strong activities at nanomolar scale. The flow cytometric analysis indicated that compound 1 induced cell cycle arrest in the G2/M phase. Transcriptome analysis revealed a panel of possible targets for compound 1. RT-PCR and western blot experiments showed that 1 significantly inhibited the expression of vasohibin-2 (VASH2). Moreover, compound 1 restrained angiogenesis in a concentration-dependent manner in the chick embryo chorioallantoic membrane (CAM) model.
Introduction
Natural products are an important source for drug discovery. Drugs directly obtained or indirectly derived from natural products play a significant role in cancer chemotherapy.1 Cardiac Glycosides (CGs) are a class of steroid-like compounds from a diverse group of plants, including Strophanthus, Digitalis, Nerium, and animals.2,3 CGs have traditionally been used to treat congestive heart failure and arrhythmias, for their specific inhibitory effect on the Na+/K+-ATPase pump, an ion pump present on almost all eukaryotic cell membranes.4 Recently, the remarkable anticancer effects of CGs have drawn academic attention to their applications in cancer chemotherapy.5 An increasing number of research studies revealed that CGs exhibited selective anti-proliferative and pro-apoptosis effects against various human cancer cell lines, such as cervical, lymphoma, lung, colon, breast, prostate, melanoma, pancreas, and liver cancer cell lines.6,7 In addition, several CGs have been evaluated in clinical trials as anticancer drugs.8–11The anticancer activity mechanisms of CGs have been studied to include apoptosis,12 autophagy,13 anoikis,14 immunogenic cell death15 and cell cycle arrest.16 These findings provided insights into developing CGs as novel anticancer therapeutics.
In our ongoing research to discover more bioactive CG molecules as lead compounds,16 a series of CGs including three new ones were isolated from Digitalis lanata Ehrh., an herb of Digitalis genus (Plantaginaceae).17 Their structures were unambiguously elucidated by extensive spectral data and chemical transformation. The cytotoxic activities and structure–activity relationship (SAR) were evaluated. Flow cytometric analysis indicated that compound 1 caused significant cell cycle arrest. The possible molecular target of 1 was investigated by transcriptomic analysis, RT-PCR, and western blot. Furthermore, the concentration-dependent antiangiogenic activity of compound 1 was also evaluated on the CAM model. These findings provide new insights for the development of CGs into anti-tumor lead compounds.
Results and discussion
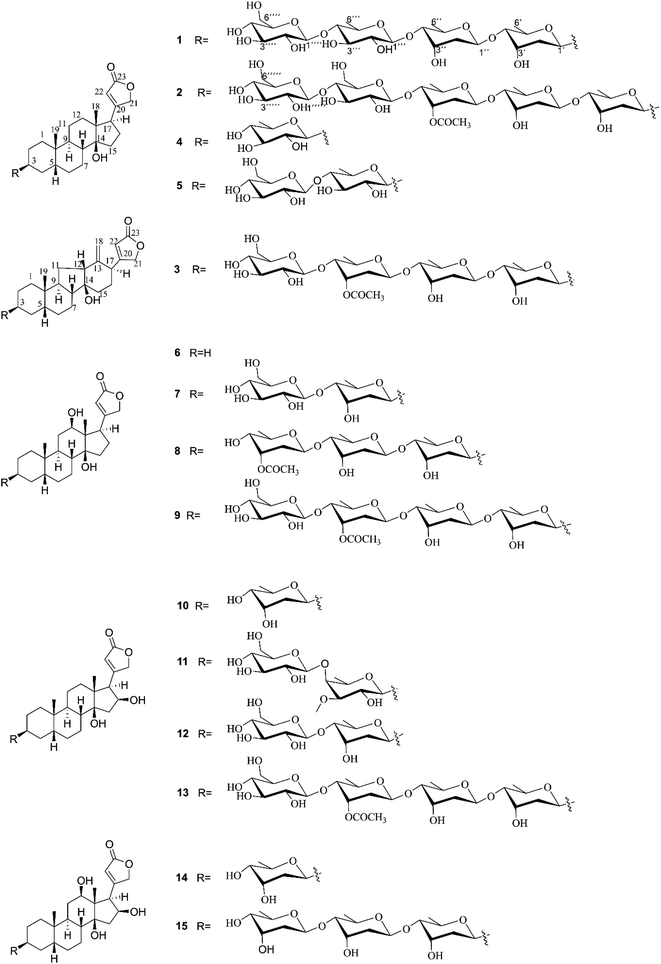
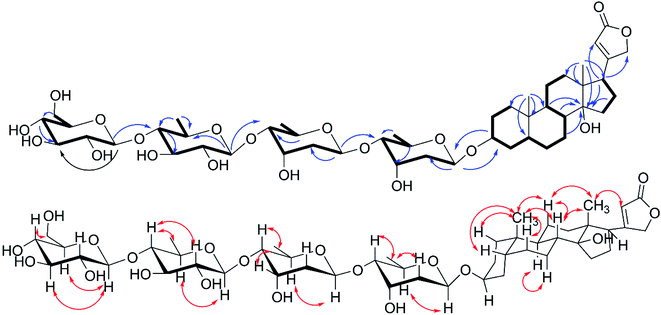
Air-dried and powdered leaves of D. lanata were macerated in MeOH at room temperature to afford the MeOH crude extract, which was subsequently suspended in water and successively partitioned with petroleum ether, EtOAc, and n-BuOH, yielding petroleum ether-, EtOAc-, and n-BuOH-soluble fractions, respectively. According to the monitored results of Kedde's reagent on thin-layer chromatography, the EtOAc-soluble fraction was shown to contain more CGs. Thus, the EtOAc-soluble fraction was prioritized to be further subjected to consecutive separations to afford 15 CGs, including three new compounds 1–3 and 12 known congeners 4–15 (Fig. 1).Compound 1 was isolated as amorphous powder, its molecular formula was determined to be C47H74O19 with eleven hydrogen deficiency as deduced from the sodium adduct ion at m/z 965.4720 [M + Na]+ (calcd for C47H74O19Na, 965.4717) in HRESIMS/MS and the 13C NMR data (Table 1). The 1H NMR signals of two methyl groups at δH 0.88 (s, H3-18) and 0.95 (s, H3-19), an α,β-unsaturated-γ-lactone moiety characteristic resonances at δH 4.91 (dd, J = 18.5, 1.4 Hz H2-21a), 5.05 (dd, J = 18.5, 1.4 Hz H2-21b), and 5.89 (br s, H-22) as well as 13C NMR signals of δC 177.0 (C-23), 178.0 (C-20), and 117.8 (C-22) showed characteristics of a CG.18 The 1H–1H COSY cross-peaks of H2-1/H2-2/H-3/H2-4/H-5/H2-6/H2-7/H-8/H-9/H2-11/H2-12, and H2-15/H2-16/H-17 in combined with the key HMBC correlations (Fig. 2) from H3-19 to C-1/C-5/C-9/C-10, H3-18 to C-12/C-13/C-14/C-17, and H-8, H-9, H-17, H-16 to C-14 verified the cardenolide steroidal tetracyclic skeleton being oxygen-bearing at C-3 (δC 73.1) and C-14 (δC 86.2) and a methyl group at C-10 and C-13, respectively. The attachment of an α,β-unsaturated-γ-lactone ring moiety at C-17 was deduced based on the HMBC cross peaks of H-17 to C-21 and C-22. What mentioned above indicated seven hydrogen deficiency, remained four ones in combination with the molecular weight and additional analysis of 1H NMR and 13C NMR of four characteristic anomeric signals at δH 4.35 (d, J = 7.8 Hz), δC 104.9; δH 4.38 (d, J = 7.8 Hz), δC 104.8; δH 4.89 (dd, J = 9.7, 1.9 Hz), δC 96.5; and δH 4.93 (dd, J = 9.7, 1.8 Hz), δC 100.1 indicated 1 was a CG with four glycosyl moieties. The four glycosyl were assigned as digitoxopyranosyl, digitoxopyranoyl, quinovopyranosyl, and glucopyranosyl, respectively, based on 1H NMR and 13C NMR data and four spin coupling systems of H-1′/H-2′/H-3′/H-4′/H-5′/H-6′, H-1′′/H-2′′/H-3′′/H-4′′/H-5′′/H-6′′, H-1′′′/H-2′′′/H-3′′′/H-4′′′/H-5′′′/H-6′′′, and H-1′′′′/H-2′′′′/H-3′′′′/H-4′′′′/H-5′′′′/H-6′′′′ in 1H–1H COSY spectrum, and HMBC correlations from H-1′ to C-2′, H-6′ to C-4′, H-5′ to C-3′; H-1′′ to C-2′′, H-5′′ to C-4′′; H-1′′′ to C-5′′′, H-4′′′ to C-3′′′, H-6′′′ to C-5′′′ and C-4′′′ and from H-1′′′′ to C-3′′′′, H-4′′′′ to C-3′′′′, and H-6′′′′ to C-4′′′′. In addition, the HMBC correlations of H-1′′/C-4′, H-1′′′/C-4′′ and H-1′′′′/C-4′′′ validated the glycosyl linkages of 4′ → 1′′, 4′′ → 1′′′, and 4′′′ → 1′′′′. The tetrasaccharide chain was linked to C-3 by key HMBC correlations of H-1′/C-3 and H-3/C-1′.
| No. | δC type | δH a, multi. (J in Hz) | No. | δC type | δH a, multi. (J in Hz) |
|---|---|---|---|---|---|
| a “m” means overlapped or multipet with other signals. | |||||
| 1 | 30.7 CH2 | 1.46, m | 1′α | 96.5 CH | 4.89, dd (9.7, 1.9) |
| 2α | 27.3 CH2 | 1.64, m | 2′α | 38.5 CH2 | 1.77, m |
| 2β | 1.64, m | 2′β | 2.05, dd (9.7, 2.8) | ||
| 3α | 73.1 CH | 4.02, br s | 3′β | 68.2 CH | 4.25, dd (3.0, 2.8) |
| 4α | 31.1 CH2 | 1.81, m | 4′β | 83.3 CH | 3.24, dd (9.6, 3.0) |
| 4β | 1.46, m | ||||
| 5β | 37.6 CH | 1.65, m | 5′α | 69.2 CH | 3.80, dq (9.6, 6.2) |
| 6α | 27.6 CH2 | 1.26, m | 6′β | 18.5 CH3 | 1.22, d (6.2) |
| 6β | 1.87, m | ||||
| 7α | 22.1 CH2 | 1.27, m | 1′′α | 100.1 CH | 4.93, dd (9.7, 1.8) |
| 7β | 1.77, m | ||||
| 8β | 42.4 CH | 1.63, m | 2′′α | 38.4 CH2 | 1.73, m |
| 2′′β | 1.98, dd (9.7, 2.1) | ||||
| 9α | 36.6 CH | 1.69, m | 3′′β | 68.0 CH | 4.23, dd (3.0, 2.8) |
| 10 | 36.1 C | 4′′β | 83.5 CH | 3.28, dd (9.6, 2.8) | |
| 11α | 22.3 CH2 | 1.43, m | 5′′α | 69.4 CH | 3.92, dq (9.6, 6.2) |
| 11β | 1.23, m | ||||
| 12 | 40.8 CH2 | 1.48, m | 6′′β | 18.4 CH3 | 1.22, d (6.2) |
| 13 | 50.8 C | 1′′′α | 104.9 CH | 4.35, d (7.8) | |
| 14 | 86.2 C | 2′′′β | 74.5 CH | 3.31, dd (9.3, 7.8) | |
| 15α | 33.3 CH2 | 2.15, m | 3′′′α | 75.7 CH | 3.46, dd (9.3, 9.0) |
| 15β | 1.73, m | ||||
| 16α | 27.8 CH2 | 2.17, m | 4′′′β | 86.4 CH | 3.18, dd (9.5, 9.0) |
| 16β | 1.88, m | ||||
| 17α | 51.9 CH | 2.83, m | 5′′′α | 71.8 CH | 3.50, dq (9.5, 6.2) |
| 18β | 16.4 CH3 | 0.88, s | 6′′′β | 18.1 CH3 | 1.37, d (6.2) |
| 19β | 24.2 CH3 | 0.95, s | 1′′′′α | 104.8 CH | 4.38, d (7.8) |
| 20 | 178.0 C | 2′′′′β | 74.7 CH | 3.25, dd (7.8, 7.8) | |
| 21a | 75.1 CH2 | 5.05, dd (18.5, 1.5) | 3′′′′α | 77.5 CH | 3.38, dd (9.0, 7.8) |
| 21b | 4.91, dd (18.5, 1.5) | ||||
| 22 | 117.7 CH | 5.89, br s | 4′′′′β | 71.1 CH | 3.32, m |
| 23 | 177.0 C | 5′′′′α | 77.8 CH | 3.35, m | |
| 6′′′′a | 62.2 CH2 | 3.92, dq (10.2, 6.5) | |||
| 6′′′′b | 3.66, dt (10.2, 7.0) | ||||
The cis-, trans- and cis-fused A/B, B/C and C/D tetracyclic skeleton was determined by the NOESY correlations of H3-19 to H-1β, H-5, H-6β, H-8, H-11β, H-11β to H-8 and H3-18 and H-7α to H-9 (Fig. 2). The NOESY correlations of H-8/H3-18/H-22 indicated an α-orientation of H-17. The small coupling constant of H-3 (br s) suggested H-3 should be equatorially α-bonded. Together, these analyses permitted full assignment of the signals in aglycone of 1 as those corresponding to digitoxigenin.19
All of the four sugar moieties were β-glycosides, which were supported by the relatively large homonuclear 3JH–H values of the anomeric protons of 9.7 Hz (H-1′-H-2′β), 9.7 Hz (H-1′′-H-2′′β), 7.8 Hz (H-1′′′-H-2′′′β), and 7.8 Hz (H-1′′′′-H-2′′′′β) (Table 1) and heteronuclear 1JC–H values of 160.3 Hz (C-1′-H-1′), 160.3 Hz (C-1′′-H-1′′), 160.0 Hz (C-1′′′-H-1′′′), and 160.0 Hz (C-1′′′′-H-1′′′′) (see the ESI Fig. S4†).20 Moreover, the glycosyl groups in compound 1 were verified as D-digitoxopyranosyl, D-quinovopyranosyl and D-glucopyranosyl by acid-catalyzed hydrolysis and derivatization (see the ESI Fig. S25 and S26A†). Therefore, compound 1 was assigned as digitoxigenin 3-O-β-D-glucopyranosyl-(1 → 4)-β-D-quinovopyranosyl-(1 → 4)-β-D-digitoxopyranosyl-(1 → 4)-β-D-digitoxopyranoside.
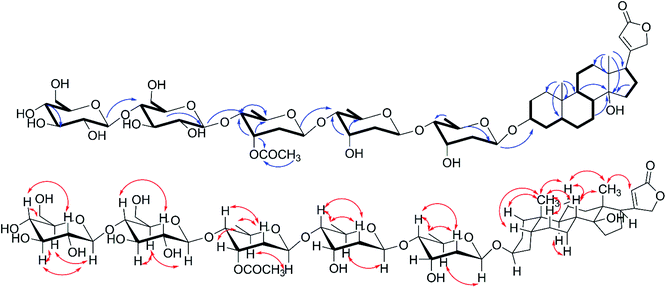
The molecular formula, C55H86O24 of compound 2 was unequivocally deduced by the HRESIMS sodium adduct ion peak at m/z 1153.5343 [M + Na]+ (calcd for C55H86O24Na 1153.5401) and the 13C NMR data (Table 2). Compound 2 contained two singlet methyl signals at δH 0.75 (s, H3-18) and 0.85 (s, H3-19), a group of mutually coupled oxymethylene ABq peaks at δH 4.88 and 4.96 (each d, 17.7 Hz, H2-21), and an unsaturated methine hydrogen signal at δH 5.90 (br s, H-22) in 1H NMR spectrum (Table 2), which indicated compound 2 possessed same aglycone portion with 1 combining with detailed analysis of 2D NMR (Fig. 3). Five signals of anomeric protons and carbons at δH 4.23 (d, J = 7.8 Hz), δC 103.2; δH 4.30 (d, J = 7.8 Hz), δC 103.9; δH 4.76 (d, J = 8.4 Hz, 2H), δC 95.3, 98.6; and δH 4.81 (d, J = 9.7 Hz), δC 98.9 were showed in 1H NMR and 13C NMR, and three of which were assigned to be deoxy sugar moieties as confirmed by the doublet methyl signals at δH 1.09 (d, J = 6.0 Hz, 6H), and 1.24 (d, J = 6.0 Hz, 3H). The five glycosyl were assigned as two digitoxopyranosyls, one (3′-O-acetyl)-digitoxopyranosyl, and two glucopyranosyls based on 1D and 2D analysis. Further acid-catalyzed hydrolysis and derivatization analyses (see the ESI Fig. S25 and S26B†) deduced all digitoxopyranosyls and glucopyranosyls as D-configuration. Detailed 2D NMR analysis suggested the sugar moieties of 2 were identical to those of 9 except for one more β-D-glucopyranosyl, which was determined to be 1′′′′′ → 4′′′′ connection based on the HMBC correlations of H-1′′′′′/C-4′′′′ and downfield signal of C-4′′ (69.7 in 9 and 80.8 in 2). The structure of compound 2 was thereby established as digitoxigenin 3-O-β-D-glucopyranosyl-(1 → 4)-β-D-glucopyranosyl-(1 → 4)-β-D-(3′-O-acetyl)-digitoxopyranosyl-(1 → 4)-β-D-digitoxopyranosyl-(1 → 4)-β-D-digitoxopyranoside.
| No. | δC type | δH c, multi. (J in Hz) | No. | δC type | δH c, multi. (J in Hz) |
|---|---|---|---|---|---|
| 1α | 30.1 CH2 | 1.29, m | 6′β | 18.0 CH3 | 1.09, d (5.9) |
| 1β | 1.36, m | ||||
| 2α | 26.4 CH2 | 1.49, m | 1′′α | 98.9 CH | 4.81, d (9.7) |
| 2β | 2.02, m | ||||
| 3α | 72.1 CH | 3.90, br s | 2′′α | 37.8 CH2 | 1.86, m |
| 2′′β | 1.59, m | ||||
| 4α | 29.6 CH2 | 1.72, m | 3′′β | 66.2 CH | 4.08, m |
| 4β | 1.31, m | ||||
| 5β | 36.3 CH | 1.51, m | 4′′β | 81.5 CH | 3.18, m |
| 6α | 26.5 CH2 | 1.16, m | 5′′α | 67.5 CH | 3.73, m |
| 6β | 1.76, m | ||||
| 7α | 21.1 CH2 | 1.09, m | 6′′β | 18.0 CH3 | 1.09, d (5.9) |
| 7β | 1.73, m | ||||
| 8β | 40.9 CH | 1.45, m | 1′′′α | 98.6 CH | 4.76, d (8.4) |
| 9α | 34.8 CH | 1.59, m | 2′′′α | 35.4 CH2 | 1.95, m |
| 2′′′β | 1.75, m | ||||
| 10 | 34.8 C | 3′′′β | 70.1 CH | 5.24, d (2.7) | |
| 11α | 20.8 CH2 | 1.31, m | 4′′′β | 79.2 CH | 3.33, m |
| 11β | 1.01, m | ||||
| 12 | 39.0 CH2 | 1.38, m | 5′′′α | 68.7 CH | 3.82, dd (9.2, 6.0) |
| 13 | 49.4 C | 6′′′β | 18.0 CH3 | 1.24, (6.0) | |
| 14 | 83.8 C | 3′′′-OC![[O with combining low line]](https://www.rsc.org/images/entities/char_004f_0332.gif) CH3 CH3 |
170.1 C | ||
| 15α | 32.2 CH2 | 2.03, m | 3′′′-OCO![[C with combining low line]](https://www.rsc.org/images/entities/char_0043_0332.gif) H3 H3 |
21.3 CH3 | 2.03, s |
| 15β | 1.59, m | ||||
| 16α | 26.4 CH2 | 2.03, m | 1′′′′α | 103.9 CH | 4.30, d (7.8) |
| 16β | 1.76, m | ||||
| 17α | 50.2 CH | 2.73, m | 2′′′′β | 73.1 CH | 2.98, dd (8.0, 7.8) |
| 18β | 15.7 CH3 | 0.76, s | 3′′′′α | 74.7 CH | 3.27, m |
| 19β | 23.7 CH3 | 0.85, s | 4′′′′β | 80.8 CH | 3.26, m |
| 20 | 176.4 C | 5′′′′α | 74.9 CH | 3.97, m | |
| 21a | 73.2 CH2 | 4.96, d (17.7) | 6′′′′a | 60.8 CH2 | 3.55, m |
| 21b | 4.88, d (17.7) | 6′′′′b | 3.69, m | ||
| 22 | 116.2 CH | 5.90, s | 1′′′′′α | 103.2 CH | 4.23, d (7.8) |
| 23 | 173.9 C | 2′′′′′β | 73.2 CH | 2.98, dd (7.8, 7.8) | |
| 1′α | 95.3 CH | 4.76, d (8.4) | 3′′′′′α | 76.4 CH | 3.15, m |
| 2′α | 38.4 CH2 | 1.77, m | 4′′′′′β | 69.9 CH | 3.04, m |
| 2′β | 1.46, m | ||||
| 3′β | 66.3 CH | 4.05, br s | 5′′′′′α | 76.8 CH | 3.19, m |
| 4′β | 81.9 CH | 3.13, d (7.9) | 6′′′′′a | 61.0 CH2 | 3.69, m |
| 5′α | 67.5 CH | 3.67, m | 6′′′′′a | 3.39, m |
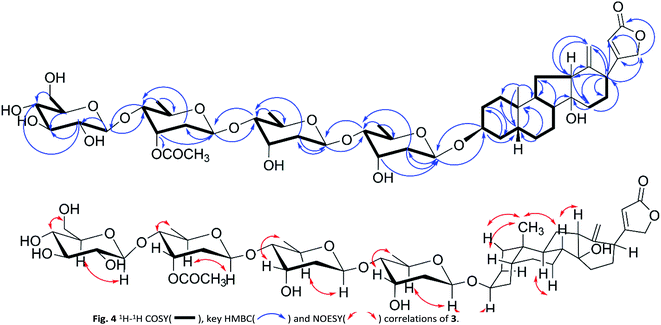
Compound 3 was isolated as a white solid. The HRESIMS ion peak at m/z 989.4725 [M + Na]+ was consistent with a molecular composition of C49H74O19 (calcd for C49H74O19Na 989.4717). The 1H NMR spectrum (Table 3) showed characteristic signals of a singlet methyl at δH 0.85 (s), a mutually coupled oxymethylene at δH 4.61 and 4.68 (each d, J = 17.7 Hz), and an unsaturated methine at δH 5.91 (br s), suggesting 3 to be also a cardenolide. However, the absence of signal of H3-18 and the presence of two terminal double bond protons at δH 5.10 (s, H-18a) and 4.94 (s, H-18b) indicated a discrepant aglycone skeleton. The fused A and B rings remained as those of compound 2 as deduced from 1H–1H COSY cross peaks (Fig. 4) of H2-1/H2-2/H-3/H2-4/H-5/H2-6/H2-7/H-8/H-9 and HMBC correlations from H-19 to C-1/C-5/C-9/C-10. The 1H–1H COSY spectrum showed H-8/H-9/H-11/H-12 and H-15/H-16/H-17 correlations together with HMBC long-range correlations from H-8, H2-15 to C-14, and H3-18 to C-12/C-13/C-17 indicated 5/6 membered fused C and D rings being replaced by a hydroxyl group at C-14 and a terminal double bond at C-13, which permitted the assignment of the aglycone portion in 3 as thevetiogenin.21 A detailed 2D NMR analysis and acid-catalyzing hydrolysis (see the ESI Fig. S25 and S26C†) assigned the glycosyl groups in 3 were two D-digitoxopyranosyls, one D-(3′-O-acetyl)-digitoxopyranosyl, and one D-glucopyranosyl, whose β-configurations were determined based on large homonuclear 3JH–H values of anomeric protons of 9.4 Hz (H-1′-H-2′β), 9.6 Hz (H-1′′-H-2′′β), 9.6 Hz (H-1′′′-H-2′′′β), and 7.6 Hz (H-1′′′′-H-2′′′′β) (Table 3) and heteronuclear 1JC–H values of 160.7 Hz (C-1′-H-1′), 163.2 Hz (C-1′′-H-1′′), 162.4 Hz (C-1′′′-H-1′′′), and 162.6 Hz (C-1′′′′-H-1′′′′) (see the ESI Fig. S20†). These glycosyl were linked in the same order as 9, which was confirmed by the HMBC correlations from H-1′′ to C-4′, H-1′′′ to C-4′′, and 1′′′′ to C-4′′′ and validated the linkages of 4′ → 1′′, 4′′′ → 1′′′, and 4′′′ → 1′′′′. The acetyl group (δH 2.08, δC 21.2, 171.3) linked at 3′′′ was also confirmed according to the downfield signal of H-3′′′ (δH 5.52, br s) and HMBC correction of H-3′′′ to carbonyl (δC 171.3). The glycosidic linkage of 3 → 1′ was deduced by the HMBC cross-peaks of H-1′/C-3 and H-3/C-1′. These observations permitted the assignment of 3 as thevetiogenin 3-O-β-D-glucopyranosyl-(1 → 4)-β-D-(3′-O-acetyl)-digitoxopyranosyl-(1 → 4)-β-D-digitoxopyranosyl-(1 → 4)-β-D-digitoxopyranoside, which was the first example of C-nor-D-homo-cardenolide21 from D. lanata.
| No. | δC type | δH c, multi. (J in Hz) | No. | δC type | δH c, multi. (J in Hz) |
|---|---|---|---|---|---|
| 1 | 31.6 CH2 | 1.56, m | 3′β | 66.6 CH | 4.21, m |
| 2α | 26.7 CH2 | 1.66, m | 4′β | 82.5 CH | 3.16, m |
| 2β | 1.70, m | ||||
| 3α | 72.8 CH | 3.96, br s | 5′α | 68.1 CH | 3.79, m |
| 4α | 30.2 CH2 | 1.65, m | 6′β | 18.0 CH3 | 1.18, t (6.4) |
| 4β | 1.44, m | ||||
| 5β | 36.0 CH | 1.64, m | 1′′α | 98.5 CH | 4.86, d (9.6) |
| 6α | 27.6 CH2 | 1.24, m | 2′′α | 36.8 CH2 | 2.00, m |
| 6β | 1.84, m | 2′′β | 1.68, m | ||
| 7α | 20.1 CH2 | 1.43, m | 3′′β | 66.4 CH | 4.19, m |
| 7β | 2.09, m | ||||
| 8β | 49.8 CH | 2.02, m | 4′′β | 82.7 CH | 3.20, m |
| 9α | 38.4 CH | 2.30, m | 5′′α | 68.2 CH | 3.74, m |
| 10 | 34.9 C | 6′′β | 18.0 CH3 | 1.18, t (6.4) | |
| 11 | 21.1 CH2 | 2.09, m | 1′′′α | 98.6 CH | 4.76, d (9.6) |
| 12α | 49.6 CH | 2.01, m | 2′′′α | 36.1 CH2 | 1.95, m |
| 12β | 1.44, m | 2′′′β | 1.65, m | ||
| 13 | 146.0 C | 3′′′β | 69.7 CH | 5.52, br s | |
| 14 | 80.0 C | 4′′′β | 80.2 CH | 3.28, m | |
| 15α | 31.2 CH2 | 1.82, m | 5′′′α | 69.4 CH | 3.35, m |
| 15β | 1.61, m | ||||
| 16α | 25.0 CH2 | 1.98, m | 6′′′β | 18.0 CH3 | 1.29, d (6.1) |
| 16β | 2.16, m | ||||
| 17α | 44.1 CH | 3.38, m | 3′′′-O![[C with combining low line]](https://www.rsc.org/images/entities/char_0043_0332.gif) OCH3 OCH3 |
171.3 C | |
| 18β | 111.6 CH2 | 5.10, s | 3′′′-OCO![[C with combining low line]](https://www.rsc.org/images/entities/char_0043_0332.gif) H3 H3 |
21.2 CH3 | 2.08, s |
| 4.94, s | |||||
| 19β | 22.4 CH3 | 0.85, s | 1′′′′α | 104.2 CH | 4.32, d (7.6) |
| 20 | 172.3 C | 2′′′′β | 73.6 CH | 3.20, m | |
| 21a | 73.0 CH2 | 4.61, dd (17.7, 1.5) | 3′′′′α | 76.1 CH | 3.39, m |
| 21b | 4.68, dd (17.7, 1.4) | ||||
| 22 | 116.0 CH | 5.91, br s | 4′′′′β | 69.7 CH | 3.35, m |
| 23 | 174.6 C | 5′′′′α | 76.4 CH | 3.24, m | |
| 1′α | 95.3 CH | 4.83, d (9.4) | 6′′′′a | 60.6 CH | 3.62, m |
| 6′′′′b | 3.80, m | ||||
| 2′α | 37.1 CH2 | 1.99, m | |||
| 2′β | 1.71, m |
The known compounds, digitoxigenin 3-O-β-D-quinovoside (4),22 glucodigimethyloside (5),23 digoxigenin (6), digoxigenin 3-β-D-glucopyranosyl-(l → 4)-β-D-digitoxoside (7), acetyldigoxin (8) lanatoside C (9),24 gitoxigeninmono-D-digitoxoside (10),25 digitalin (11), glucogitoroside (12),26 lanatoside B (13),27 diginatigenin mono-digitoxoside (14),28 and diginatin (15)29 were elucidated by comparing their spectroscopic data with those in literature.
The cytotoxic activities of the obtained CGs 1–15 were measured on A549 (non-small lung carcinoma) cells by the MTT method in preliminary assays. The proliferation inhibition rates of all the isolated CGs were greater than 70% after 24 hours of exposure (see the ESI Table S27†). Based on these results, IC50 values of these CGs were then measured against A549, HeLa (human cervical cancer cells), MCF-7 (breast cancer), and BEAS-2B (normal human lung epithelial cells) cell lines. Paclitaxel was used as a positive control (Table 4). Most of the CGs presented potent cytotoxic activities on all four cancer cell lines on the nanomolar scale (IC50 < 1 μM). In general, these CGs were more active against A549 and HeLa cells than against MCF-7. The cytotoxic selectivities of these CGs of cancer cell lines over normal cell lines were evaluated by comparing their IC50 values on cancer cell lines with those on BEAS-2B cell lines. Most of the isolated CGs exhibited two to eight-fold higher IC50 values on BEAS-2B cell lines than those on cancer cell lines, indicating that they were relatively selective against cancer cell lines.
| Com. | IC50 (μM) ± SD | ||||||
|---|---|---|---|---|---|---|---|
| BEAS-2B | A549 | SI | HeLa | SI | MCF-7 | SI | |
| a Cells were treated with compounds for 48 h, and cell viability was detected by the MTT assay, experiments were performed in triplicates and data represents mean ± SD. Selectivity index (SI) was calculated according to the following formula: SI = IC50 (normal cell line)/IC50(cancer cell lines). | |||||||
| 1 | 0.24 ± 0.02 | 0.08 ± 0.02 | 3.00 | 0.06 ± 0.02 | 3.75 | 0.11 ± 0.02 | 2.18 |
| 2 | 0.45 ± 0.05 | 0.25 ± 0.01 | 1.80 | 0.07 ± 0.03 | 6.43 | 0.22 ± 0.05 | 2.04 |
| 3 | 0.40 ± 0.04 | 0.33 ± 0.03 | 1.21 | 0.61 ± 0.30 | 0.66 | 0.53 ± 0.14 | 0.75 |
| 4 | 0.09 ± 0.01 | 0.04 ± 0.03 | 2.25 | 0.02 ± 0.006 | 4.50 | 0.23 ± 0.04 | 0.30 |
| 5 | 0.29 ± 006 | 0.09 ± 0.10 | 3.22 | 0.03 ± 0.00 | 3.22 | 0.12 ± 0.02 | 2.42 |
| 6 | 2.58 ± 0.11 | 1.28 ± 0.23 | 2.02 | 0.77 ± 0.23 | 3.35 | 1.44 ± 0.01 | 1.79 |
| 7 | 0.25 ± 0.10 | 0.15 ± 0.15 | 1.67 | 0.16 ± 0.08 | 1.56 | 0.38 ± 0.16 | 0.66 |
| 8 | 0.25 ± 0.06 | 0.15 ± 0.01 | 1.67 | 0.13 ± 0.007 | 1.92 | 0.19 ± 0.06 | 1.32 |
| 9 | 0.37 ± 0.10 | 0.19 ± 0.03 | 1.94 | 0.13 ± 0.013 | 2.85 | 0.24 ± 0.11 | 1.54 |
| 10 | 1.20 ± 0.33 | 0.27 ± 0.07 | 4.44 | 0.16 ± 0.06 | 7.5 | 0.49 ± 0.09 | 2.45 |
| 11 | 1.47 ± 0.20 | 0.42 ± 0.09 | 3.50 | 0.60 ± 0.21 | 2.45 | 1.38 ± 0.00 | 1.06 |
| 12 | 1.16 ± 0.31 | 0.14 ± 0.03 | 8.28 | 0.16 ± 0.01 | 7.25 | 0.26 ± 0.03 | 4.46 |
| 13 | 0.92 ± 0.29 | 0.57 ± 0.11 | 1.61 | 0.16 ± 0.03 | 5.75 | 0.44 ± 0.12 | 2.09 |
| 14 | 2.40 ± 0.11 | 0.67 ± 0.10 | 3.58 | 0.64 ± 0.16 | 3.75 | 1.14 ± 0.33 | 2.10 |
| 15 | 1.24 ± 0.34 | 0.36 ± 0.09 | 3.44 | 0.63 ± 0.30 | 1.97 | 0.67 ± 0.11 | 1.85 |
| Paclitaxel | 0.13 ± 0.03 | 0.06 ± 0.04 | 2.16 | 0.02 ± 0.01 | 6.50 | 0.11 ± 0.05 | 1.18 |
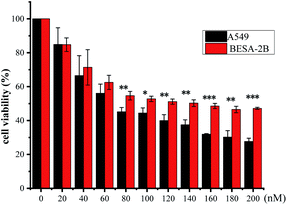
It has been shown in literature that subtle changes in the core structure of CGs can influence the biological activity significantly.30 To obtain a preliminary knowledge above the structure–activity relationship (SAR) of the isolated CGs, we examined the impact of structural variations on their anti-proliferative activities against A549 cells. In general, CGs bearing saccharide moieties at C-3 showed greater activity than the aglycone, as compounds without saccharide units exhibited a dramatic decrease in the activity, as shown by 7 (0.15 μM), 8 (0.15 μM) and 9 (0.19 μM) vs. aglycone 6 (1.28 μM). These data suggested that C-3 saccharide moieties were beneficial to the activity. Similar results have been reported previously.31 In addition, except for 2, compounds 1, 4 and 5 (0.04 ≤ IC50 ≤ 0.09 μM), showed greater activity than 7–9 (0.15 ≤ IC50 ≤ 0.19 μM) and 10–13 (0.14 ≤ IC50 ≤ 0.57 μM), suggesting that hydroxylation at C-12 or C-16 was unfavorable to the activity. Meanwhile, O-acetylation was thought to be responsible for the reduced activity of the compound 2. Compounds 14 (0.67 μM) and 15 (0.36 μM) displayed lower antiproliferative activity, indicating that simultaneous hydroxylation at C-12 and C-16 was detrimental to the activity. Moreover, the transformation of aglycone led to a dramatic decrease of the activity, as shown by 3 (0.33 μM), which could be due to the acetylation. Noteworthy, compounds 1, 4, and 5, displayed extremely low IC50 values comparable to the positive control paclitaxel. Compound 1 exhibited statistically significant selectivity against cancer cell lines (Fig. 5). Based on these data, compound 1 was chosen as a representative compound to export further.
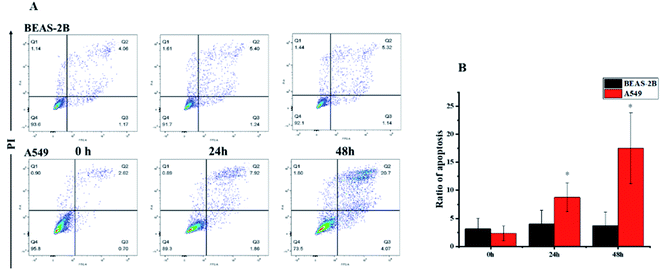
Based on literature reports,12,32 we first hypothesized that the cytotoxic activity of compound 1 was attributed to its apoptosis-inducing effect. To test our hypothesis, we first monitored the morphological change induced by compound 1. A549 cells showed substantial apoptotic morphological change after treatment with 1 for 24 h (see the ESI Fig. S27†). Subsequent Annexin V-FITC/PI assay revealed that accumulated over time, the apoptotic cell fraction increased with the treatment of 1 (Fig. 6). Interestingly, the apoptotic fraction of A549 cells was less than 20% even after being exposed to 80 nM of 1 for 48 h, indicating that alternative mechanisms of action other than apoptosis also contribute to the cytotoxic activity. The flow cytometric analysis also showed a surprising result that no significant apoptosis-induced effects on BEAS-2B cells were observed under the same experimental settings. This result further suggested that 1 showed selectivity against cancer cells over normal cells.
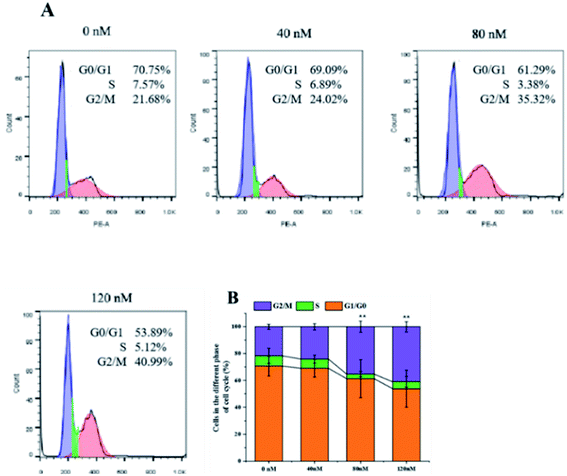
The soft agar assay measures the proliferation ability of cells in simulated matrices and provides an ideal way to rigorously test the inhibitory activity of compounds on a longer time scale.33 compound 1 can suppress the long-term proliferative capacity of A549 cells and the colony ability of surviving cells was significantly reduced after compound 1 treatment (Fig. 7), which is in accordance with the MTT assay results. The flow cytometric analysis was also performed to investigate the impact of 1 on cell cycle distribution. A549 cells were treated with increasing concentration (40, 80, 120 nM) of compound 1 for 24 h and DNA content was measured. As illustrated in Fig. 8, a significantly increased cell accumulation in the G2/M phase with a dose-dependence. The proportion of cells in G2/M phase increased from 21.68% to 24.02%, 35.32% and 40.99% respectively, with the increase of concentration of 1. According to the above results, compound 1 can inhibit cancer cell proliferation via arresting cell cycle progression in G2/M phase.
The application of transcriptomics can offer new insights into locating drug targets and pinpointing relevant pathways in tumor progression.34 To find an alternative mechanism of 1 for its anti-proliferative activities, a transcriptome analysis was performed. The expression of mRNA with a padj < 0.05 and |log2(fold change)| > 0 were considered for differential expression between the control groups and compound 1 treatment groups. The result showed that 6460 genes were up-regulated and 6317 were down-regulated in all 12![[thin space (1/6-em)]](https://www.rsc.org/images/entities/char_2009.gif) 777 differentially expressed genes (DEGs) as visually shown in volcano plot (Fig. S28A†). A heatmap (Fig. S28B†) was also used to illustrate the asymmetry of the relative up/down regulation of genes. Analysis of the top 40 cancer associated DEGs revealed that three tumor suppressor genes KLF15 (Kruppel Like Factor 15), FOSB (fosb proto-oncogene), and FTCD (formimidoyltransferase cyclodeaminase) were up-regulated and two carcinogenic genes vasohibin 2 (VASH2) and tryptophan 2,3-dioxygenase (TDO2) were down-regulated after the treatment with 1. The differential expression of the five candidate genes were further validated using RT-PCR (Fig. 9A), which showed consistent results with transcriptomic analysis otherwise FOSB. The most significantly downregulated gene VASH2, an angiogenesis regulatory factor, was proposed to participate in the anti-proliferative activities of 1. The inhibited effect of 1 on protein level of VASH2 was also examined with a western blot experiment. As shown in Fig. 9B and C, compound 1 caused significantly concentration-dependent down-regulation of VASH2. Together, VASH2 was proposed to be the potential molecular target of compound 1.
777 differentially expressed genes (DEGs) as visually shown in volcano plot (Fig. S28A†). A heatmap (Fig. S28B†) was also used to illustrate the asymmetry of the relative up/down regulation of genes. Analysis of the top 40 cancer associated DEGs revealed that three tumor suppressor genes KLF15 (Kruppel Like Factor 15), FOSB (fosb proto-oncogene), and FTCD (formimidoyltransferase cyclodeaminase) were up-regulated and two carcinogenic genes vasohibin 2 (VASH2) and tryptophan 2,3-dioxygenase (TDO2) were down-regulated after the treatment with 1. The differential expression of the five candidate genes were further validated using RT-PCR (Fig. 9A), which showed consistent results with transcriptomic analysis otherwise FOSB. The most significantly downregulated gene VASH2, an angiogenesis regulatory factor, was proposed to participate in the anti-proliferative activities of 1. The inhibited effect of 1 on protein level of VASH2 was also examined with a western blot experiment. As shown in Fig. 9B and C, compound 1 caused significantly concentration-dependent down-regulation of VASH2. Together, VASH2 was proposed to be the potential molecular target of compound 1.
 | ||
| Fig. 9 (A) RT-PCR experimental validated the differentially expressed genes regulated by compound 1. (B) western blot analyses of VASH2. (C) The corresponding quantitative. | ||
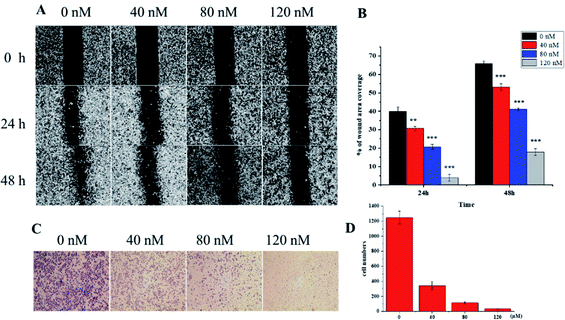
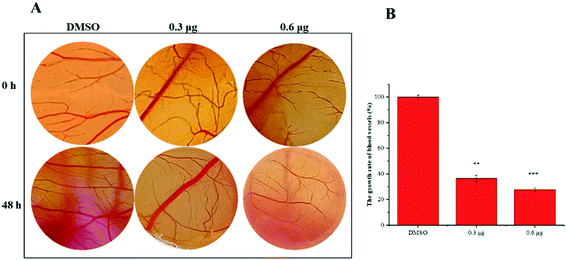
VASH2, a member of the vasohibin family, is abnormally expressed in various cancer cells and is strongly associated with tumor progression and chemoresistance.35,36 In addition, VASH2 was shown to promote angiogenesis in hepatic, ovarian and endometrial cancers, and was proposed to be a potential drug target.37 To better understand the molecular interactions between 1 and VASH2, a molecular docking analysis was performed. 3D interaction represented in Fig. 10 showed that 1 can fit in a binding pocket of VASH2 by forming eleven hydrogen bonds at Tyr239, Gln53, Asn189, Ile133, Met136, Arg212, Lys157, and His241 with a glide score of −14.943. The molecular docking result indicated that 1 was likely to show a good binding affinity with its potential molecular target VASH2. As VASH2 has been shown to be a potential molecular target of 1, and that VASH2 is a regulatory factor of angiogenesis, we sought to study the anti-angiogenesis activities of 1. Angiogenesis is a complicated pathological process, which is essential for cancer progression and metastasis by providing oxygen and nutrients.38 Antiangiogenic therapy, a way of blocking tumor neovascularization before the angiogenic switch or causing tumor vessel regression, has been showing to be a prospective treatment for cancer.39–42 To assess whether 1 can suppress tumor migration, the mobility of A549 cells was measured by wound healing and transwell assay. As shown in Fig. 11A and B, the width of the wound became smaller in control groups after 48 h. Nevertheless, the migration of A549 cells in 1-treated groups were significantly inhibited at designated time points. Transwell assay simultaneously showed that the quantity of migrated A549 cells obviously decreased with the increase in the concentrations of 1 (Fig. 11C and D), indicating the inhibitory effect of 1 on carcinoma cell metastasis. We further confirmed the inhibitory effect of 1 on angiogenesis in vivo by implementing compound 1 on CAM model, which has been an awesome tool in studying of tumor angiogenesis and metastasis.43 Chick embryos were treated with 0.3 or 0.6 μg of 1 or DMSO (control) within pre-placed polyethylene resin rings, and then were photographed at 0 h and 48 h (Fig. 12A). Experimental results showed that the density and extension of the CAM blood vessel plexuses were strongly reduced by 1 (Fig. 12B), which illustrates that compound 1 possessed anti-angiogenesis potentiality.
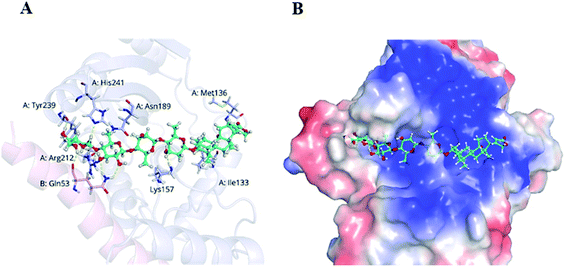 | ||
| Fig. 10 Docking analysis of 1 with VASH2. (A) Amino acid residues of VASH2 with close proximity to 1. (B) Space-filling model of VASH2 with its potential ligand 1. | ||
Conclusions
Collectively, 15 naturally occurring CGs were isolated and identified from the leaves of D. lanata. All the isolated CGs exhibited excellent anti-proliferation activity against cancer cell lines on nanomole scale. Compounds 1, 4, and 5 exhibited promising inhibitory activities with IC50 values of 40 nM, 90 nM and 80 nM respectively against A549 cell line. The mechanism studies indicated that the antiproliferative activity of 1 was associated with the cell cycle arrest at G2/M phase. Furthermore, 1 can significantly inhibit the expression of VASH2 and restrain angiogenesis on the CAM model in a concentration-dependent manner. To the best of our knowledge, this is the first attempt to repurpose CGs as potential inhibitors of tumor angiogenesis. Our study suggested that compound 1 is a potential lead compound for developing novel therapeutics for the treatment of cancer.Author contributions
Kun Gao and Jian-Jun Chen performed conceptualization and reviewed the final manuscript. Hong-Ying Yang performed the experiments and wrote the preliminary manuscript. Ya-Xiong Chen provide significant guidance in the biological experimental procedure. Shangwen Luo modified the syntax. Yi-Lin He, Wei-Jiao Feng and Yue Sun carried out the spectral analysis.Conflicts of interest
There are no conflicts to declare.Acknowledgements
The financial support from the National Natural Science Foundation of China (No. 22177044 and No. 81973193). The Natural Science Foundation of Gansu Province (No. 20JR5RA279).Notes and references
- D. J. Newman and G. M. Cragg, J. Nat. Prod., 2020, 83, 770–803 CrossRef CAS PubMed.
- K. Winnicka, K. Bielawski and A. Bielawska, Acta Pol. Pharm., 2006, 63, 109–115 CAS.
- C. P. Melero, M. Medarde and A. San Feliciano, Molecules, 2000, 5, 51–81 CrossRef CAS.
- Z. Xie and T. Cai, Mol. Interventions, 2003, 3, 157–168 CrossRef CAS PubMed.
- (a) M. S. Hossan, Z. Y. Chan and H. M. Collins, Cancer Lett., 2019, 453, 57–73 CrossRef CAS PubMed; (b) D. Reddy, R. Kumavath, D. Barh, V. Azevedo and P. Ghosh, Molecules, 2020, 25, 3596 CrossRef CAS PubMed.
- (a) E. Sarah Anderson and E. Christopher Barton, Mol. Genet. Metab. Rep., 2017, 13, 42–45 CrossRef PubMed; (b) J. M. Calderon-Montano, E. Burgos-Moron, M. L. Orta, D. Maldonado-Navas, I. Garcia-Dominguez and M. Lopez-Lazaro, BioMed Res. Int., 2014, 2014, 794930 Search PubMed.
- P. B. Raghavendra, Y. Sreenivasan and S. K. Manna, Mol. Immunol., 2007, 44, 2292–2302 CrossRef CAS PubMed.
- M. I. Khan, J. A. Chesney and D. A. Laber, et al., Am. J. Med. Sci., 2009, 337, 355–359 CrossRef PubMed.
- T. Mekhail, H. Kaur, R. Ganapathi, G. T. Budd, P. Elson and R. M. Bukowski, Invest. New Drugs, 2006, 24, 423–427 CrossRef CAS PubMed.
- (a) T. Juncker, C. Cerella and M. H. Teiten, Biochem. Pharmacol., 2011, 81, 13–23 CrossRef CAS PubMed; (b) C. Cerella, F. Muller and A. Gaigneaux, Cell Death Dis., 2015, 6, 1782 CrossRef PubMed.
- M. T. Roth, D. B. Cardin, E. H. Borazanci, M. Steinbach, V. J. Picozzi, A. Rosemury, R. C. Wadlow, R. A. Newman and J. A. Berlin, Oncologist, 2020, 25, 1446–1450 CrossRef PubMed.
- (a) M. A. Farah, M. A. Ali and S. M. Chen, Colloids Surf., B, 2016, 141, 158–169 CrossRef PubMed; (b) F. Radogna, C. Cerella and A. Gaigneaux, Oncogene, 2016, 35, 3839–3853 CrossRef CAS PubMed.
- Y. Wang, Q. Qiu and J. J. Shen, Int. J. Biochem. Cell Biol., 2012, 44, 1813–1824 CrossRef CAS PubMed.
- V. Pongrakhananon, T. A. Stueckle and H. Y. L. Wang, Biochem. Pharmacol., 2014, 88, 23–35 CrossRef CAS PubMed.
- M. Diederich, F. Muller and C. Cerella, Biochem. Pharmacol., 2017, 125, 1–11 CrossRef CAS PubMed.
- Y. L. He, H. Y. Yang and P. Z. Huang, et al., Phytochem, 2021, 192, 112951 CrossRef CAS PubMed.
- E. Gurel, S. Karvar, B. Yucesan, I. Eker and M. Sameeullah, Curr. Pharm. Des., 2017, 23, 5104–5114 CAS.
- T. Drakenberg, P. Brodelius and D. D. Mcintyre, Can. J. Chem., 1990, 68, 272–277 CrossRef CAS.
- L. Boff, J. Munkert and F. M. Ottoni, et al., Chem. - Eur. J., 2019, 167, 546–561 CAS.
- J. Yan, A. D. Kline and H. Mo, J. Org. Chem., 2003, 68, 1786–1795 CrossRef CAS PubMed.
- F. Abe, T. Yamauchi and T. Nohara, Phytochemistry, 1992, 31, 251–254 CrossRef CAS.
- M. S. Butler, L. Towerzey and N. B. Pham, Phytochem, 2014, 98, 160–163 CrossRef CAS PubMed.
- Y. Terada, R. Misoi and N. W. atanabe, Chem. Pharm. Bull., 2000, 48, 349–352 CrossRef CAS PubMed.
- T. Lehtola, A. Huhtikangas and R. Hiltunen, Planta Med., 1981, 42, 250–254 CrossRef CAS PubMed.
- D. Satoh, T. Wada and H. Ishii, Pharm. Bull., 1957, 5, 253–255 CrossRef CAS PubMed.
- H. Kirmizibekmez, M. Masullo and M. Festa, Phytother. Res., 2014, 28, 534–538 CrossRef CAS PubMed.
- M. N. Tekić, B. Pekić and G. Vatai, Sep. Sci. Technol., 1994, 29, 551–556 CrossRef.
- C. J. Clarke and P. H. Cobb, J. Chromatogr. A, 1979, 168, 541–549 CrossRef CAS.
- E. Angliker, F. Barfuss and W. Kussmaul, Justus Liebigs Ann. Chem., 1957, 607, 131–143 CrossRef CAS.
- M. Ye, G. Qu and H. Guo, J. Steroid Biochem., 2004, 91, 87–98 CrossRef CAS PubMed.
- (a) Y. Ren, H. T. Ribas and K. Heath, J. Nat. Prod., 2020, 83, 638–648 CrossRef CAS PubMed; (b) Y. Ren, Q. Tan and K. Heath, Bioorg. Med. Chem., 2020, 28, 115301 CrossRef CAS PubMed; (c) M. T. T. Nguyen, K. D. H. Nguyen and P. H. Dang, J. Nat. Prod., 2020, 83, 385–391 CrossRef CAS PubMed.
- S. Wen, Y. Chen and Y. Lu, et al., Fitoterapia, 2016, 112, 74–84 CrossRef CAS PubMed.
- (a) F. Du, X. Zhao and D. Fan, Bio-Protoc., 2017, 7, e2351 Search PubMed; (b) S. Horibata, T. V. Vo, V. Subramanian, P. R. Thompson and S. A. Coonrod, J. Visualized Exp., 2015, 9, e52727 Search PubMed.
- Y. Shi, Y. Wang and W. Huang, J. Proteome Res., 2019, 18, 3259–3267 CrossRef CAS PubMed.
- (a) Z. Li, T. Min and H. Bei, PLoS One, 2014, 9, e90358 CrossRef PubMed; (b) H. Kimura, H. Miyashita, Y. Suzuki, M. Kobayashi, K. Watanabe and H. Sonoda, Blood, 2009, 113, 4810–4818 CrossRef CAS PubMed.
- X. Tan, Z. Liao and S. Zou, Oncol. Res., 2020, 28, 3–11 CrossRef.
- (a) Y. Takahashi, T. Koyanagi, Y. Suzuki, Y. Saga, N. Kanomata and T. Moriya, et al., Mol. Cancer Res., 2012, 10, 1135–1146 CrossRef CAS PubMed; (b) T. Koyanagi, Y. Suzuki, Y. Saga, S. Machida, Y. Takei and H. Fujiwara, et al., Cancer Sci., 2013, 104, 1705–1710 CrossRef CAS PubMed; (c) T. Koyanagi, Y. Saga, Y. Takahashi, Y. Suzuki, M. Suzuki and Y. Sato, Oncol. Lett., 2013, 5, 1058–1062 CrossRef CAS PubMed.
- N. Weidner, P. R. Carroll, J. Flax, W. Blumenfeld and J. Folkman, J. Natl. Cancer Inst., 1993, 143, 401–409 CAS.
- L. Holmgren, M. S. O′Reilly and J. Folkman, Nat. Med., 1995, 1, 149–153 CrossRef CAS PubMed.
- Y. Chen and S. H. Tseng, In Vivo, 2007, 21, 365–370 CAS.
- M. Russo and R. Giavazzi, Thromb. Res., 2018, 164, S3–S6 CrossRef CAS PubMed.
- N. Weidner, J. Folkman, F. Pozza, P. Bevilaoqua, E. N. Allred, D. H. Moore, S. Meli and G. Gasparini, J. Natl. Cancer Inst., 1992, 84, 1875–1887 CrossRef CAS PubMed.
- D. Ribatti, Int. Rev. Cell Mol. Biol., 2008, 270, 181–224 CAS.
Footnote |
| † Electronic supplementary information (ESI) available: NMR, HRESIMS, IR spectra and experimental section. See https://doi.org/10.1039/d2ra04464a |
| This journal is © The Royal Society of Chemistry 2022 |

