 Open Access Article
Sodium alginate as an eco-friendly rheology modifier and salt-tolerant fluid loss additive in water-based drilling fluids
Zhaojie Wei ab,
Maosen Wangab,
Ying Liab,
Yinghui Anab,
Kaijun Liab,
Kun Boab and
Mingyi Guo
 *ab
*ab
aCollege of Construction Engineering, Jilin University, Changchun 130021, China. E-mail: guomingyi@jlu.edu.cn
bKey Laboratory of Drilling and Exploitation Technology in Complex Conditions, Ministry of Natural Resources, Jilin University, Changchun 130021, China
First published on 19th October 2022
Abstract
The rheological and filtration performance of drilling fluids greatly depends on the additives used. To address the negative impact on the drilling fluid performance stemming from electrolyte contamination, a sustainable sodium alginate (SA) biopolymer was employed as an additive in water-based drilling fluids to overcome the performance deterioration caused by the polyelectrolyte effect under salt contamination. The results demonstrated that SA performs better than sodium carboxymethyl cellulose (Na-CMC) and polyanionic cellulose (PAC-LV), the widely used drilling fluid additives. Although exposed to highly concentrated salt contamination, the addition of SA can mitigate viscosity variation and maintain a lower filtration volume of a base fluid (BF), whereas an advanced variation in CMC/BF and PAC/BF was observed. The possible rheology and filtration mechanism of SA under highly concentrated salt contamination were investigated through zeta potential, particle size distribution, and scanning electron microscopy (SEM). The results revealed that the anchoring groups on the SA molecular chain enable them to strongly adsorb on the negatively charged bentonite surface via hydrogen and ionic bond interactions, leading to a significant improvement in both rheological and filtration performance. Therefore, SA with excellent salt tolerance and sustainability confers practical applicability that could extend to the preparation of saltwater-based and other inhibitive drilling fluids.
1 Introduction
The success of a drilling operation is inextricably associated with the suitable utilization of drilling fluids. As the indispensable part of drilling operations, the drilling fluid has long been expected to perform multifunctional roles in stabilizing the borehole, suspending the cuttings, cooling and lubricating the drill bit.1,2 It is worth mentioning that drilling fluids can be broadly divided into water-based drilling fluids (WBDFs), oil-based drilling fluids (OBDFs), and foam drilling fluids.3,4 Among these drilling fluids, WBDFs are considered to be the most widely recommended owing to their desirable properties such as lower cost, ease of preparation, variable rheology, and eco-friendly nature.5–8 To minimize formation damage and stabilize the borehole, satisfactory rheological and filtration performance in WBDFs should be given priority during circulation.In general, bentonite is a fundamental component of WBDFs, which exhibits outstanding swelling capacity, gel formation and shear thinning properties after full dispersion and hydration. However, owing to the intrinsic swelling characteristics and crystalline structure of bentonite, flocculation and aggregation from salt contamination usually cause serious irreversible challenges such as borehole instability and the invasion of the formation by drilling fluid filtrate, thereby increasing drilling time and costs significantly.9–12 In comparison with OBDFs, one of the critical issues of WBDFs that still needs to be tackled is shale hydration and dispersion. Inorganic salts feature excellent hydration inhibition characteristics, are low cost and easily available, and have been widely used in WBDFs to weaken shale hydration via ion exchange. Nevertheless, as WBDFs are subjected to high concentration electrolytes, the flocculation of the bentonite, which leads to the deterioration of the filtration capability and significant viscosity decline, becomes the prevailing issue. Therefore, the design of a multifunctional WBDF that simultaneously achieves stable rheological and filtration performance after the invasion of highly concentrated salinity remains a challenge.
To circumvent these challenges, academics and petroleum practitioners have attempted to develop different additives, including microparticles, synthetic polymers, and their hybrid nanocomposites.13–15 Among these additives, synthetic polymers have gained more attention owing to their targeted properties via chemical modification of functional groups, as well as the regulatable molecular weight.16 Recently, a large variety of synthetic polymers have been successfully applied in drilling fluid systems such as acrylamide-based polymers,17–19 polyacrylates, polyvinyl alcohol20,21 and functionalized cellulose nanoparticles.22,23 Despite these polymers resulting in effective improvement in the performance of WBDFs, the large-scale application of conventional synthetic polymers at low cost remains difficult, and environmentally unacceptable issues mainly related to drilling waste disposal also restrict their application.24
In order to diminish the adverse effects on the environment and reduce preparation costs at drilling sites, degradable biopolymers such as xanthan gum (XG), sodium carboxymethyl cellulose (Na-CMC) and guar gum have been widely developed.25–28 These additives have been proven to improve the performance of drilling fluids to meet the function requirements, including appropriate rheology and filtration properties.28,29 Nevertheless, owing to the polyelectrolyte effect and shrinkage of biopolymers under salinity conditions, the application of natural polymers that possess groundwater intrusion resistance and superior anti-salt contamination performance warrants further exploration.
Sodium alginate (SA) is a linear anionic polysaccharide extracted from the cell walls of different kinds of brown algae (pseudomonas and azotobacter). The polymer chain of SA contains α-L-guluronic acid (G-block) and β-D-mannuronic acid (M-block) linked by 1,4-β-D-glucosidic bonds.30 As the most abundant carbohydrate in brown algae, approximately 50![[thin space (1/6-em)]](https://www.rsc.org/images/entities/char_2009.gif) 000 tons of alginate are produced annually in the world.31 Owing to its biodegradability, renewability and easy availability, SA has been proven to play an active role in water treatment,32 biomedical engineering,33–36 the food industry,37,38 drug delivery,39 and 3D printing.40,41 Moreover, the high solubility, tailorable rheological properties, excellent flocculability and adsorption characteristic of sodium alginate account for its application in gel formation to enhance hydrogel strength.42,43 Meanwhile, owing to the spatial network structure of SA in water,44,45 its thixotropy and unique shear-thinning behavior make it an alternative additive that could be used in drilling fluid. While there is a vast amount of bibliographic literature regarding the application of SA, salt-tolerant rheological and filtration loss properties in water-based drilling fluid have not been reported; although it has been combined with graphene oxide to reduce the filtration loss, the detailed mechanism has not been systematically analysed.46 The introduction of SA proposed in this article enriches the variety of salt resistant biodegradable polymers used in the drilling industry.
000 tons of alginate are produced annually in the world.31 Owing to its biodegradability, renewability and easy availability, SA has been proven to play an active role in water treatment,32 biomedical engineering,33–36 the food industry,37,38 drug delivery,39 and 3D printing.40,41 Moreover, the high solubility, tailorable rheological properties, excellent flocculability and adsorption characteristic of sodium alginate account for its application in gel formation to enhance hydrogel strength.42,43 Meanwhile, owing to the spatial network structure of SA in water,44,45 its thixotropy and unique shear-thinning behavior make it an alternative additive that could be used in drilling fluid. While there is a vast amount of bibliographic literature regarding the application of SA, salt-tolerant rheological and filtration loss properties in water-based drilling fluid have not been reported; although it has been combined with graphene oxide to reduce the filtration loss, the detailed mechanism has not been systematically analysed.46 The introduction of SA proposed in this article enriches the variety of salt resistant biodegradable polymers used in the drilling industry.
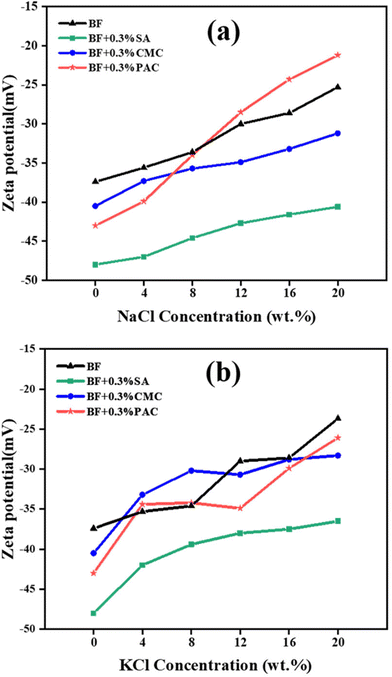
In this study, we propose sodium alginate as a water based drilling fluid additive and investigate its rheological and filtration loss properties upon NaCl and KCl contamination. Additionally, the salt tolerance mechanism of SA/WBDF was comprehensively studied through particle size distribution (PSD), zeta potential, and scanning electron microscopy (SEM). It is revealed that SA could bond closely with clay particles through hydrogen bond and ionic bond interactions, resulting in a dense mesh-like structure and thus imparting high viscosity to the WBDF. Meanwhile, due to the noncovalent interactions, SA could screen the salt-sensitive bentonite particle sites and prevent the absorption of external cations from the susceptible ion sites of bentonite particles. In addition, a hot rolling test was used to evaluate the thermal stability of drilling fluids with different biodegradable additives. Owing to the desirable properties and excellent performance in water based drilling fluids, the findings from this study can expand the application of SA in environment friendly drilling fluids and contribute to the development and progression of brine muds.
2 Materials and methods
2.1 Materials
For comparison, commercially available additives were used for the water-based drilling fluids. Sodium carboxymethyl cellulose (Na-CMC) was obtained from Yousuo Technology Co., Ltd., China. Low-viscosity polyanionic cellulose (PAC-LV) was purchased from Xingzheng Chemical Co., Ltd. (Shenyang, China). Sodium alginate (SA) (viscosity 200 ± 20 mPa s) was obtained as a commercial product from Shanghai Aladdin Biochemical Technology Co., China. Commercial sodium bentonite was purchased from Rongchang Mining Co., Ltd., P. R. China. The bentonite used to prepare water based drilling fluids followed the American Petroleum Institute (API) standard. Sodium chloride (purity ≥ 99%, NaCl) and potassium chloride (purity ≥ 99%, KCl) were obtained from Fuchen Chemical Reagent Co., Ltd. Deionized water was prepared in our own laboratory. All the reagents were not purified further.2.2 Methods
| τ = 0.511 × φN | (1) |
| γ (s−1) = 1.703 × N (rotation speed, rpm) | (2) |
 | (3) |
| PV = φ600 − φ300 (mPa s) | (4) |
| YP = 0.511 × (2 × φ300 − φ600) (Pa) | (5) |
2.2.7.1 Bingham plastic model. The rheological properties of plastic fluids were initially evaluated using the Bingham plastic model, which has two parameters: yield point and plastic viscosity. The mathematical model was expressed using the following form (eqn (6)):
| τ = τ0 + μpγ | (6) |
2.2.7.2 Power Law Model. Pseudoplastic fluids are representative of a class of solutions containing long-chain macromolecular polymers and high-solid drilling fluids. The concave–convex rheological curve of pseudoplastic fluids can be characterized using the power law model, and it can be expressed as eqn (7):
| τ = Kγn | (7) |
2.2.7.3 Herschel–Bulkley model. The Herschel–Bulkley model introduces the yield point based on the power law model. Due to its high precision, the Herschel–Bulkley model is often applied in drilling to describe the rheology of drilling fluids, as given by eqn (8):
| τ = τ0 + Kγn | (8) |
3 Results and discussion
3.1 Rheological and filtration properties of different fluid-loss additives
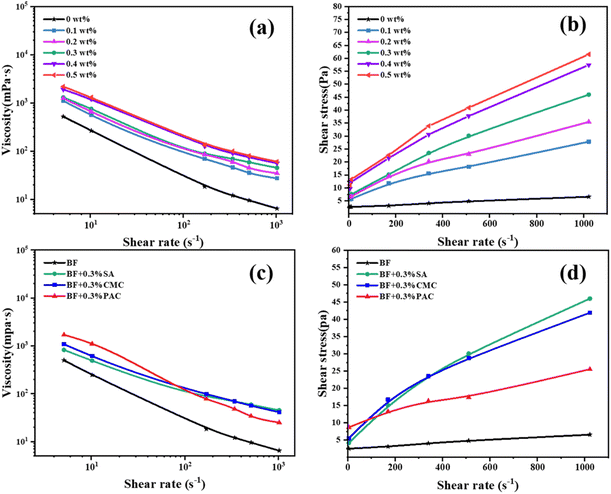
As is known, drilling fluids are commonly designed as non-Newtonian fluids and shear-thinning behavior is a notable viscosity characteristic of polymer containing suspensions.45 It can be observed that the rheology of SA/BF closely followed shear-thinning behavior in a range of shear rates from 5.11 to 1022 s−1, exhibiting high viscosity to suspend cuttings at low shear rates but low viscosity to reduce flow resistance at high shear rates. Meanwhile, one can see that shear thinning behavior is more obvious with increasing concentrations of SA. This marked shear-thinning effect was beneficial for shale cutting transport, borehole cleaning, and drilling rate improvement. Fig. 1b shows the plots of shear stress as a function of shear rate for SA/BF at different SA concentrations. The results were consistent with the viscosity trends; the shear stress also increased with increasing concentration of SA. For instance, the shear stress of SA/BF with 0.1, 0.2, 0.3, 0.4 and 0.5 wt% SA is 27.85, 35.46, 45.99, 57.44 and 61.52 Pa, respectively, at a high shear rate of 1022 s−1.
It is well known that Na-CMC and PAC-LV strongly interact with clay particles, exhibit excellent thickening properties and are widely used to regulate the rheological properties of drilling fluid. To determine the thickening capability of SA, Na-CMC and PAC-LV were used as control additives (see Fig. 1c and d). It can be seen that SA/BF exhibit high viscosity similar to CMC/BF and PAC/BF, and the shear thinning behavior of SA/BF did not differ significantly from CMC/BF and PAC/BF with the increase in shear rate from 5.11 to 1022 s−1. Such desirable shear thinning behavior in SA/BF contributes to improving bottom hole cleaning efficiency, suspending and settling cuttings.
As inferred, the high viscosity in SA/BF necessarily implied the strong interaction and stable adsorption between polymer chains and clay particles. Therefore, the rheological analysis indicated that the addition of SA enhanced the rheological properties and allowed the BF to provide cutting transport performance for water-based drilling fluids in an effective way. Furthermore, the shear stress of SA/BF increased more rapidly than that of CMC/BF and PAC/BF, which also illustrates the efficiency of SA. The highest shear stress was derived from chemical adsorption among the clay particles and SA chains; thus, this revealed the much better ability of SA to improve the shear stress even at a high shear rate. Moreover, at a shear rate of 5.11 s−1, the shear stress was 4.19, 5.52 and 8.69 Pa for SA/BF, CMC/BF and PAC/BF, respectively. The lower shear stress for SA/BF at a low shear rate has the benefit of lower swab and surge pressures. Thus, the addition of SA to drilling fluids significantly enhanced the rheological behavior whether at a low or high shear rate.
Fig. 2 shows the effect of the additives (Na-CMC, PAC-LV and SA) on the rheological parameters (AV, PV and YP) and filtration volume of BF with different dosages. SA demonstrated similarly excellent rheological properties compared with CMC at the same concentrations. Apparent viscosity has great importance for cutting transport and well cleaning efficiency. As shown in Fig. 2a, SA/BF exhibits slightly superior viscosity to CMC/BF, and much higher viscosity than PAC/BF. When 0.3 wt% additives are added, the AV of SA/BF, CMC/BF and PAC/BF increased from 6.5 mPa s to 45, 41 and 25 mPa s, respectively. Being a fundamental rheological parameter, plastic viscosity (PV) reflects the friction between clay particles and the liquid phase, and internal friction among the clay nanoplatelets. Fig. 2b shows the effect of additives on the PV of BF. As the content of additives increased, the PV of SA/BF was obviously higher than that of the other drilling fluids; the trend was as follows: SA/BF > CMC/BF > PAC/BF. The YP (yield point) is an important indicator in the evaluation of thixotropy, which is defined as the minimum shear stress that must be exerted to induce fluid flow. Similarly, YP was also enhanced with increasing additive concentrations; as shown in Fig. 2c, we observe higher YP in SA/BF than in PAC/BF and slightly lower YP in SA/BF than in CMC/BF. The YP of BF is 3.1 Pa, and it increased to 14.2, 15.6 and 9.2 Pa with 0.3 wt% SA, CMC and PAC, respectively; the YP of SA/BF was inferior to that of CMC/BF by only 9.8%. The suitable YP for SA/BF was directly correlated with the flow resistance owing to the entangled structure in suspension.
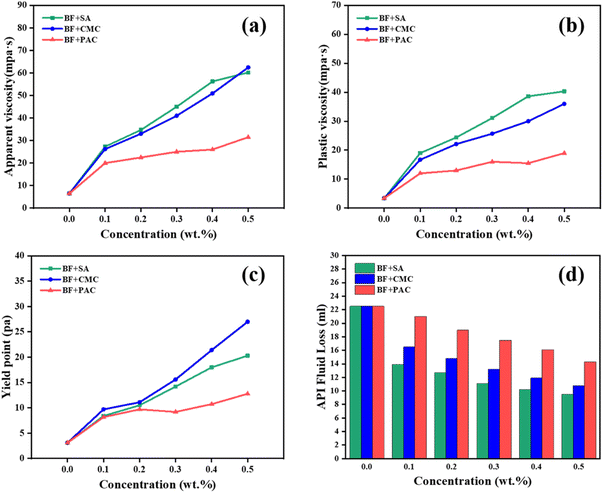 | ||
| Fig. 2 Plot of (a) AV, (b) PV, (c) YP, and (d) API filtration loss of drilling fluids with the addition of different concentrations of SA, Na-CMC, and PAC-LV. | ||
An accurate and suitable rheological model plays a vital role in forecasting viscosity properties and flow behavior in a quantitative manner. In this work, to describe rheological properties and estimate the relationship between shear stress and shear rate, three widely applied constitutive rheological models (the Bingham plastic, power law and Herschel–Bulkley models) were used to fit the rheological data. Comparing the fitting curve parameters, it is found that the Herschel–Bulkley model is qualitatively consistent with the experimental rheological data in different drilling fluids due to the smallest value of root mean squared error (RMSE) and coefficient determination R2 close to 1 (Table 1). Furthermore, flow index n, consistency index k, and yield stress τ0 were calculated by fitting the data to the Herschel–Bulkley model.
| Models | SA concentration (wt%) | Na-CMC concentration (wt%) | PAC-LV concentration (wt%) | ||||||||
|---|---|---|---|---|---|---|---|---|---|---|---|
| 0 | 0.10 | 0.20 | 0.30 | 0.10 | 0.20 | 0.30 | 0.10 | 0.20 | 0.30 | ||
| BP | τ0 (Pa) | 2.64 | 7.26 | 8.67 | 14.21 | 8.81 | 9.41 | 14.74 | 6.45 | 10.91 | 12.8 |
| μ (Pa s) | 0.01 | 0.02 | 0.04 | 0.05 | 0.02 | 0.03 | 0.05 | 0.01 | 0.01 | 0.02 | |
| R2 | 0.99 | 0.98 | 0.98 | 0.98 | 0.91 | 0.95 | 0.93 | 0.99 | 0.99 | 0.99 | |
| RMSE | 0.14 | 1.09 | 1.72 | 2.44 | 2.09 | 2.62 | 4.88 | 0.60 | 0.45 | 0.80 | |
| PL | n | 0.23 | 0.44 | 0.58 | 0.50 | 0.33 | 0.49 | 0.47 | 0.35 | 0.39 | 0.23 |
| K | 1.21 | 1.30 | 0.60 | 1.92 | 2.55 | 1.40 | 2.39 | 1.70 | 1.71 | 5.77 | |
| R2 | 0.77 | 0.95 | 0.98 | 0.96 | 0.97 | 0.99 | 0.99 | 0.91 | 0.95 | 0.85 | |
| RMSE | 0.66 | 1.65 | 2.10 | 3.35 | 1.24 | 1.20 | 1.16 | 1.53 | 0.88 | 2.64 | |
| HB | τ0 (Pa) | 2.55 | 5.28 | 5.69 | 9.87 | 4.29 | 4.01 | 4.09 | 5.36 | 8.58 | 11.64 |
| n | 0.92 | 0.73 | 0.76 | 0.74 | 0.50 | 0.50 | 0.54 | 0.77 | 0.76 | 0.80 | |
| k (Pa sn) | 0.01 | 0.15 | 0.20 | 0.31 | 0.09 | 0.12 | 0.23 | 0.07 | 0.09 | 0.08 | |
| R2 | 0.99 | 0.99 | 0.99 | 0.99 | 0.98 | 0.98 | 0.99 | 0.99 | 0.99 | 0.99 | |
| RMSE | 0.12 | 0.37 | 0.50 | 0.65 | 0.89 | 0.89 | 0.22 | 0.06 | 0.58 | 0.46 | |
It can be seen that SA/BF with 0.1, 0.3 and 0.5 wt% of SA had a consistency index of 0.15, 0.2, and 0.31 in the Herschel–Bulkley model, respectively; whereas CMC/BF with 0.1, 0.3 and 0.5 wt% of CMC had a consistency index of 0.09, 0.12 and 0.23, respectively, and the corresponding concentrations of PAC in BF had a consistency index of 0.07, 0.09, and 0.08. In comparison with Na-CMC and PAC-LV, SA has a consistently higher consistency index in favor of shale cutting transport. The curve fitting results remained consistent with those observed experimentally. Meanwhile, as the concentration of SA increased, we speculated that the increased consistency index may be related to the strengthened interactions of hydrogen bonds in SA molecules.
Effective control of lost circulation has long been recognized as the dominant strategy to maintain borehole stability. Fig. 2d depicts the filtration loss as a function of additive concentration. As expected, compared with BF, the filtration loss decreased with the increasing content of additives added to BF. Among these three additives, SA exhibits the highest filtrate volume reduction. At the concentration of 0.3 wt%, compared with BF, about 51% reduction (11.1 ml/30 min) in SA/BF, 41.3% in CMC/BF (13.2 ml/30 min), and 22.2% in PAC/BF (17.5 ml/30 min) can be obtained, respectively. We deduced that the carboxyl and hydroxyl groups in the molecular chain of SA were easily adsorbed on the surface of clay particles, thus maintaining the dispersibility of clay platelets and forming a low permeability filter cake (discussed in section 3.2.3). Based on the above observation, it can therefore be concluded that the addition of SA to BF not only can improve the rheological properties but also enhance the filtration performance.
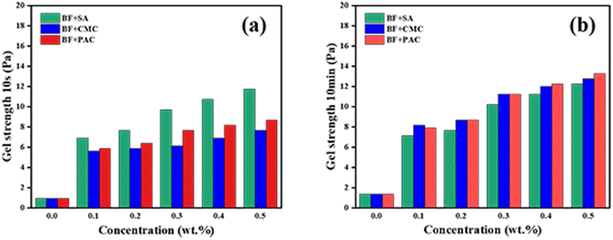
Gel strength, for the specified time periods of 10 s and 10 min, is the commonly used indicator to assess the rate of gel formation, and the strength of the gels that formed under static conditions of the drilling fluid. A higher gel strength helps to suspend and transport the shale cutting and other solid phases; however, excessive final gel strength (10 min) easily induces pressure fluctuation when the circulation is restored. Fig. 3 shows the gel strength of BF with the addition of different concentrations of SA, CMC and PAC-LV. When 0.3 wt% filtration additives were added, the initial gel strengths (10 s) of CMC/BF, PAC/BF, and SA/BF were 6.13, 7.67 and 9.71 Pa, respectively. The final gel strength (10 min) was 11.24, 11.24, and 10.22 Pa, which represented an increase of 83.4%, 46.5% and 5.3% compared with initial gel strength, respectively. In comparison to CMC/BF and PAC/BF, SA/BF showed the highest increase in initial gel strength (10 s) and the minimum increase in final gel strength (10 min). The SA induced increase in the gel strength in a short time was related to various factors such as the interaction between nanoplatelets and polysaccharides, enhanced hydrogen bonding, and the changes in the SA-induced microstructure.52,53 Moreover, stronger electrostatic repulsion resulted from the more highly negatively charged SA chains, which reduced the crosslinking density and the formation of large complex coacervates, leading to a lower increase in final gel strength. This indicates that SA can form a reasonable network under static conditions, which is not only conducive to suspending cuttings but also avoids the generation of higher pump pressures when the pump restarts.
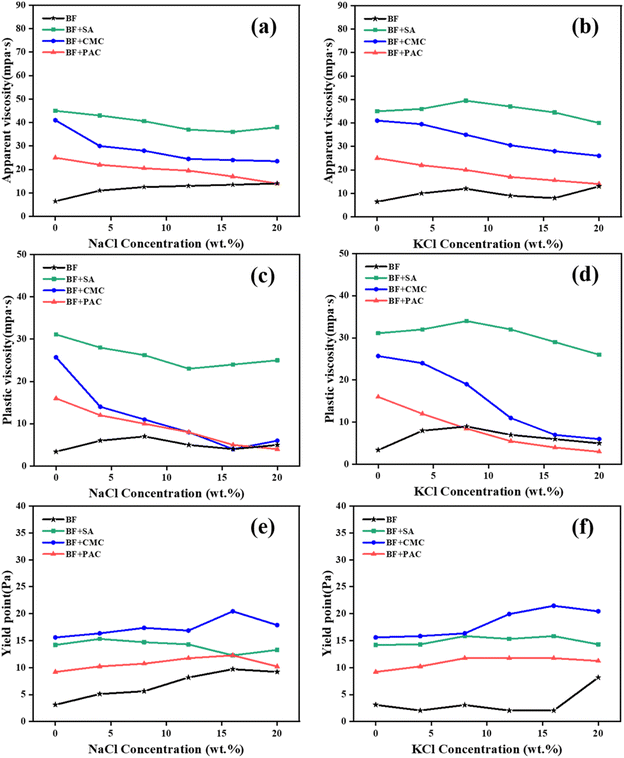 | ||
| Fig. 4 Rheological parameters of base drilling fluids: (a), (b) AV; (c), (d) PV; (e), (f) YP with a fixed additive concentration of 0.3 wt% in different concentrations of NaCl or KCl. | ||
The AV and PV of SA/BF remained at a high level even when exposed to high concentrations of electrolytes, whereas those of CMC/BF and PAC/BF decreased greatly. For instance, SA/BF, CMC/BF and PAC/BF, respectively, had AV values of 38, 23.5 and 14 mPa s when contaminated with 20 wt% NaCl. Similar results were manifested in 20 wt% KCl solution, where the AV of SA/BF only decreased by 11.1% and that of CMC/BF and PAC/BF decreased by 36.6% and 44.0%. It is concluded that the electrolytes had a negative effect on the conformation of Na-CMC and PAC through interactions among K+ and Na+. The stable AV and PV of SA/BF could be attributed to the strong interaction between the surface of clay particles and SA chains via hydrogen bonding and electrostatic forces, hence shielding the adsorption sites of positive ions and maintaining the stretched conformation of SA even under highly concentrated electrolytes. Fig. 4e and f show the effect of electrolyte contamination on YP. When the NaCl or KCl concentration increased to 20 wt%, the YP of CMC/BF and PAC/BF increased slightly. Specifically, when the NaCl concentration increased from 0 to 20 wt%, the YP of CMC/BF and PAC/BF gradually increased from 15.6 to 17.9 Pa and from 9.2 to 10.2 Pa, respectively. This implied that the invading positive ions showed a strong electrostatic attraction with bentonite particles, flocculating the clay particles. Meanwhile, owing to the polyelectrolyte effect, the polymer conformation changed from entangled to coiled and thus increased the YP. However, only a slight decrease in the YP of SA/BF was observed when exposed to 20 wt% NaCl; the YP of SA/BF with and without 20 wt% NaCl was 13.3 Pa and 14.2 Pa, respectively. The weak variations in the YP of SA/BF indicate that SA might interact with nanoplatelets via hydrogen-bonding interactions, carrying more negative charges, and thus improving the colloidal stability under high salinity conditions. In addition, as shown in Table 2, the Herschel–Bulkley model was the most accurate equation for predicting the rheological behavior of different drilling fluids under different salt conditions. The data showed that flow index n < 1 for all drilling fluids, which still behaved as non-Newtonian fluids after the invasion by 20 wt% cations (Na+ or K+). It is worth noting that SA/BF had a higher yield stress than CMC/BF and PAC/BF, which is beneficial for cutting carrying capacity. Additionally, it can be seen that SA/BF with 20 wt% NaCl had a consistency index (k) value of 0.41, whereas CMC/BF and PAC/BF had values of 0.28 and 0.30, respectively. Similarly, the same trend was observed after the invasion by KCl. The higher consistency index in SA/BF contributes to enhancing the viscosity and improving the bottom hole cleaning capacity and drilling efficiency.55
| Formula | Salt conditions | Bingham plastic model | Power law model | Herschel–Bulkley model | ||||||||||
|---|---|---|---|---|---|---|---|---|---|---|---|---|---|---|
| τ0 (Pa) | μ (Pa s) | R2 | RMSE | n | k | R2 | RMSE | τ0 (Pa) | n | k (Pa sn) | R2 | RMSE | ||
| CMC/BF | 20 wt% NaCl | 5.90 | 0.02 | 0.87 | 2.63 | 0.47 | 0.09 | 0.90 | 2.33 | 2.98 | 0.63 | 0.28 | 0.91 | 2.14 |
| 20 wt% KCl | 7.01 | 0.02 | 0.87 | 2.94 | 0.46 | 1.14 | 0.91 | 2.46 | 2.69 | 0.60 | 0.38 | 0.93 | 2.23 | |
| PAC/BF | 20 wt% NaCl | 5.65 | 0.01 | 0.76 | 1.97 | 0.29 | 1.89 | 0.99 | 0.43 | 2.54 | 0.62 | 0.30 | 0.99 | 0.43 |
| 20 wt% KCl | 8.27 | 0.01 | 0.75 | 1.41 | 0.16 | 4.59 | 0.99 | 0.25 | 1.95 | 0.58 | 0.45 | 0.99 | 0.23 | |
| SA/BF | 20 wt% NaCl | 10.97 | 0.03 | 0.99 | 1.18 | 0.40 | 2.27 | 0.93 | 2.70 | 8.10 | 0.60 | 0.41 | 0.99 | 0.63 |
| 20 wt% KCl | 9.38 | 0.03 | 0.93 | 3.04 | 0.47 | 1.55 | 0.99 | 1.21 | 2.87 | 0.55 | 0.83 | 0.99 | 0.92 | |
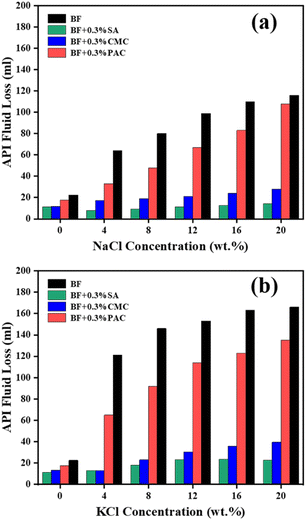
We further checked the filtration loss of the suspensions with different additives in various concentrations of NaCl and KCl. As shown in Fig. 5a, the API filtration volume of CMC/BF and PAC/BF increased from 11.1 to 28 ml and 17.5 to 108 ml in NaCl at 20 wt%, respectively. However, the filtration volume of SA/BF was only 14.1 ml in 20 wt% NaCl solution. A similar result was observed in the SA/BF contaminated with 20 wt% KCl, where the filtration loss of BF with 0.3 wt% SA was only 22.5 ml, which is lower than that of CMC/BF (39.4 ml) and PAC/BF (135 ml). Therefore, the electrolyte contamination had a negligible effect on the filtration loss of SA/BF, which implies that SA is a promising additive for maintaining lower drilling fluid leakage.
| Formulation | Aging temperature (°C) | AV (mPa s) | PV (mPa s) | YP (Pa) | FL (ml) | GS10 s (Pa) | GS10 min (Pa) |
|---|---|---|---|---|---|---|---|
| BF | 25 | 6.5 | 3.4 | 3.1 | 22.5 | 0.9 | 1.3 |
| 80 | 4.0 | 4.0 | 0.5 | 50.0 | 1.5 | 1.0 | |
| 100 | 3.0 | 3.0 | 0.5 | 68.0 | 1.0 | 0.5 | |
| 120 | 2.5 | 3.0 | 0.5 | 90.0 | 1.0 | 0.5 | |
| SA/BF | 25 | 45.0 | 31.1 | 14.2 | 11.1 | 9.7 | 10.2 |
| 80 | 42.0 | 27.0 | 15.3 | 12.0 | 5.6 | 6.6 | |
| 100 | 25.5 | 14.0 | 11.8 | 14.5 | 1.6 | 5.0 | |
| 120 | 15.0 | 5.0 | 10.2 | 32.0 | 1.5 | 2.0 | |
| CMC/BF | 25 | 41 | 25.7 | 15.6 | 13.2 | 6.1 | 11.2 |
| 80 | 35.0 | 21.0 | 14.3 | 14.0 | 5.1 | 6.1 | |
| 100 | 28.0 | 22.0 | 6.1 | 15.0 | 1.5 | 2.6 | |
| 120 | 11.5 | 9.0 | 2.6 | 31.0 | 1.5 | 2.0 | |
| PAC/BF | 25 | 25.0 | 16.0 | 9.2 | 17.5 | 7.6 | 11.2 |
| 80 | 25.5 | 15.0 | 7.7 | 10.7 | 1.5 | 4.6 | |
| 100 | 20.0 | 12.0 | 2.2 | 8.2 | 2.0 | 2.6 | |
| 120 | 12.0 | 10.0 | 2.0 | 2.0 | 2.0 | 2.6 |
However, as the aging temperature increased, the rheological and filtration performance of all formulations exhibited a marked decline. High temperature disrupted the molecular structure of SA, preventing the molecular chains from maintaining a stretched state.56 The weakened interaction resulted in the reduction of electrostatic repulsion among particles, and van der Waals forces occupied a dominant position, leading to agglomeration and flocculation of clay particles.57 Thus, SA is expected to be applied as a multifunctional additive for drilling operations where the borehole temperature is lower than 80 °C.
3.2 Mechanism analysis of filtration
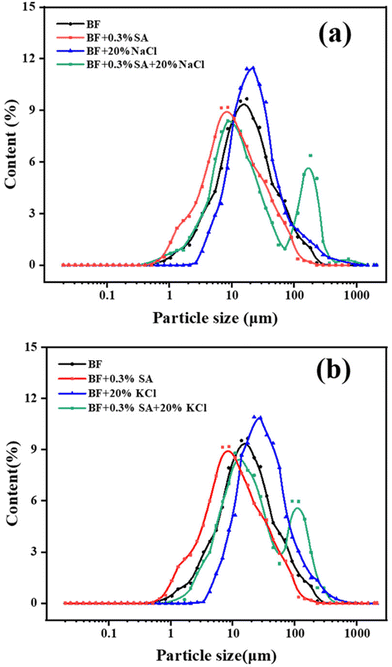 | ||
| Fig. 6 Particle size distribution of BF and SA/BF in various concentrations of (a) NaCl and (b) KCl. | ||
After the addition of 0.3 wt% SA to BF, the mean diameter was reduced from 14.5 to 8.9 μm. Moreover, in the presence of SA, the D50 of BF decreased from 19.4 to 13.1 μm in 20 wt% NaCl solution and from 25.6 to 17.0 μm in 20 wt% KCl solution. Meanwhile, the particle size distribution curve slightly changed from unimodal to bimodal and moved to the left compared to BF with electrolytes. It can be concluded that although the electrolytes induced aggregation of clay platelets in SA/BF with diameter larger than 100 μm, most of the clay particles remained highly dispersible with diameter smaller than 10 μm. The relatively narrow size distribution with high numbers of large sized particles in BF makes it difficult to prevent the penetration of water. The filtration volume of BF increased from 22.5 to 116 and 166 ml as the D50 increased from 14.5 to 19.4 (NaCl) and 25.6 (KCl) μm, whereas that of SA/BF was only 22.5 and 39.4 ml with D50 of 13.1 and 17.0 μm. The reasonable particle size distribution was conducive to plugging pores, in which the large sized particles play a key bridging role, whereas smaller sized particles enter into the internal voids and fill the pores between the large particles without percolation.61–63 It is reasonable that SA is able to maintain a wide particle size distribution, which effectively prevents water from penetrating pores in the formation and improves the integrity of the borehole.
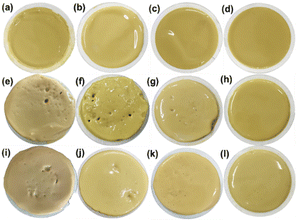
Under high salinity conditions, the thickness of the filter cake obviously increased; loose and open porous surfaces were observed on the filter cakes of BF, CMC/BF and PAC/BF, which could be attributed to the clay particle flocculation. In contrast, as shown in Fig. 8d, h and i, it was clearly observed that, after adding 0.3 wt% SA, a denser and smooth filter cake was formed, even at high salt concentration. Meanwhile, the thickness of SA/BF decreased from 16.3 mm (NaCl) and 21.2 mm (KCl) to 3.2 and 4.3 mm compared to BF, significantly thinner than CMC/BF and PAC/BF. This may be due to the broad size distribution, and larger sized particles in the SA/BF suspension could bridge and connect the smaller particles to form a thin and dense filter cake.
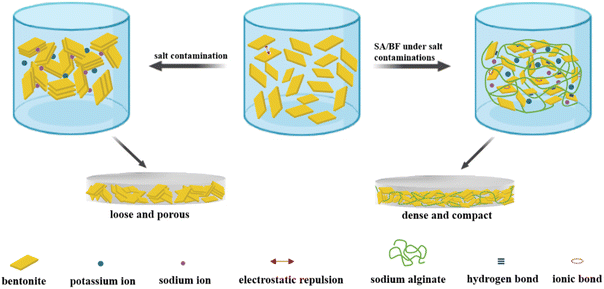
Keen to verify our conjecture, we observed the surface micromorphology of dried filter cakes using SEM. As seen in Fig. 9a and d, the filter cake surface of SA/BF was dense and compact, while that of BF showed micro sized pores and fractures. Moreover, at high salt concentration, strong agglomeration of clay particles was observed on the surface of the filter cake in BF, leading to massive noticeable pores and fractures following the invasion by 20 wt% NaCl or KCl. Once SA was added, a dense and smooth surface suggested that the pores and fractures were successfully sealed, and no obvious flocculation and aggregation could be detected. In summary, the quality of the filter cake is well maintained after the invasion by highly concentrated electrolytes, demonstrating the excellent filtration performance of SA towards salt contamination. As schematically illustrated in Fig. 10, although high concentrations of electrolyte contaminants may cause the aggregation of bentonite particles by reducing electrostatic repulsion and leading to polymer molecular chain collapse due to the polyelectrolyte effect, SA can effectively maintain the network structure and promote the hydration effect, forming a dense and compact filter cake, leading to a significant improvement in the filtration properties.
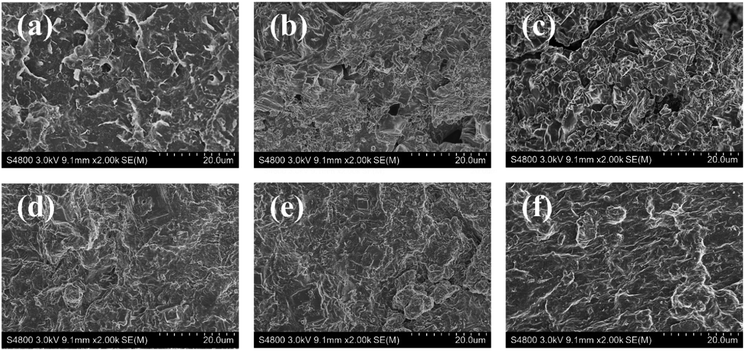 | ||
| Fig. 9 SEM images of filter cakes under different salt conditions. (a) BF; (b) BF in 20 wt% NaCl; (c) BF in 20 wt% KCl; (d) SA/BF; (e) SA/BF in 20 wt% NaCl; (f) SA/BF in 20 wt% KCl. | ||
4 Conclusions
In this study, sodium alginate biopolymer was utilized to improve the rheological properties and filtration performance of WBDF. The results proved that a small quantity of SA (0.3 wt%) greatly enhanced the rheological properties and effectively improved the filtration performance compared to commercial Na-CMC and PAC-LV. Moreover, SA/BF had a higher consistency index, which favored improving the cutting carrying ability. Under highly concentrated salinity, the rheological and filtration properties of SA/BF were better than those of PAC/BF and CMC/BF, demonstrating the superior salt tolerance of SA. Meanwhile, the thickness and permeability of the filter cake under electrolyte contamination were significantly decreased owing to the addition of SA. Zeta potential, particle size distribution, and SEM validated that the enhanced rheological properties and filtration loss reduction performance could be ascribed to the adsorption of SA on the clay surface, which shields the adsorption sites of positive ions and increases electrostatic repulsion, thereby maintaining the stretched conformation of SA/clay particles. Moreover, the introduction of SA also shed significant light on the design of eco-friendly drilling fluids and expanded the scope of the application of salt-water and inhibitive drilling fluids.Author contributions
Zhaojie Wei: conceptualization, methodology, software, writing – original draft, formal analysis, writing – review & editing. Maosen Wang: conceptualization, supervision. Ying Li: conceptualization, supervision. Yinghui An: supervision, validation, investigation. Kaijun Li: supervision, data curation. Kun Bo: supervision, data curation. Mingyi Guo: conceptualization, methodology, supervision, validation, formal analysis, funding acquisition.Conflicts of interest
There are no conflicts of interest to declare.Acknowledgements
This work was supported by the National Natural Science Foundation of China (NSFC, No. 42072338), the Cooperative Project between Universities and Jilin Province, China (No. SXGJSF2017-5), and the open fund from SinoProbe Laboratory (No. Sinoprobe Lab 202220).References
- J. Sun, X. Chang, K. Lv, J. Wang, F. Zhang, X. Zhou and J. Zhao, J. Mol. Liq., 2020, 319, 114345 CrossRef CAS.
- Q. Chu and L. Lin, RSC Adv., 2019, 9, 8608–8619 RSC.
- L. B. Pereira, C. M. S. Sad, E. V. R. Castro, P. R. Filgueiras and V. Lacerda, Fuel, 2022, 310, 122301 CrossRef CAS.
- A. Nasiri, M. Ameri Shahrabi and M. Keshavarz Moraveji, RSC Adv., 2018, 8, 9685–9696 RSC.
- C. Ma, R. Wen, F. Zhou, H. Zhao, X. Bao, A. Evelina, W. Long, Z. Wei, L. Ma, J. Liu and S. Chen, Arabian J. Chem., 2022, 15, 103610 CrossRef CAS.
- J. Qiu, Y. Bai, J. Sun, L. Dai, S. Lei and F. Liu, J. Appl. Polym. Sci., 2021, 139, 51763 CrossRef.
- P. Xu, M. Xu, Z. Tao, Z. Wang and T. Huang, R. Soc. Open Sci., 2018, 5, 180358 CrossRef.
- I. Ali, M. Ahmad and T. Ganat, J. Pet. Sci. Eng., 2022, 210, 110021 CrossRef CAS.
- Y. Tian, X. Liu, P. Luo, J. Huang, J. Xiong, L. Liang and W. Li, ACS Omega, 2021, 6, 15448–15459 CrossRef CAS PubMed.
- S. Gulraiz and K. E. Gray, Geothermics, 2021, 96, 102214 CrossRef.
- R. K. Rodrigues, S. d. F. C. Martins, M. F. Naccache and P. R. de Souza Mendes, J. Non-Newtonian Fluid Mech., 2020, 286, 104397 CrossRef CAS.
- Y. An, G. Jiang, Y. Qi, Q. Ge and L. Zhang, RSC Adv., 2016, 6, 17246–17255 RSC.
- D. Tingji, W. Ruihe, X. Jiafang, M. Jiayue, W. Xiaohui, X. Jiawen and Y. Xiaolong, Colloids Surf., A, 2022, 644, 128855 CrossRef.
- H. M. Ahmad, T. Iqbal, M. A. Al Harthi and M. S. Kamal, J. Pet. Sci. Eng., 2021, 205, 108763 CrossRef CAS.
- M. A. A. Alvi, M. Belayneh, S. Bandyopadhyay and M. W. Minde, Energies, 2020, 13, 6718 CrossRef CAS.
- A. Kariman Moghaddam, S. Davoodi, A. Ramazani S and K. M. Minaev, J. Mol. Liq., 2022, 347, 117950 CrossRef CAS.
- J. Cao, L. Meng, Y. Yang, Y. Zhu, X. Wang, C. Yao, M. Sun and H. Zhong, Energy Fuels, 2017, 31, 11963–11970 CrossRef CAS.
- F. Liu, G. Jiang, S. Peng, Y. He and J. Wang, Energy Fuels, 2016, 30, 7221–7228 CrossRef CAS.
- M.-C. Li, Q. Wu, J. Han, C. Mei, T. Lei, S.-y. Lee and J. Gwon, ACS Sustainable Chem. Eng., 2020, 8, 11569–11578 CrossRef CAS.
- Y. Wu, Z. Wang, Z. Yan, T. Zhang, Y. Bai, P. Wang, P. Luo, S. Gou and Q. Guo, Ind. Eng. Chem. Res., 2017, 56, 168–174 CrossRef CAS.
- X. Yang, Z. Shang, H. Liu, J. Cai and G. Jiang, J. Pet. Sci. Eng., 2017, 156, 408–418 CrossRef CAS.
- M.-C. Li, Q. Wu, K. Song, C. F. De Hoop, S. Lee, Y. Qing and Y. Wu, Ind. Eng. Chem. Res., 2016, 55, 133–143 CrossRef CAS.
- K. Song, Q. Wu, M. Li, S. Ren, L. Dong, X. Zhang, T. Lei and Y. Kojima, Colloids Surf., A, 2016, 507, 58–66 CrossRef CAS.
- B. Xie, A. P. Tchameni, M. Luo and J. Wen, Mater. Lett., 2021, 284, 128914 CrossRef CAS.
- J. Li, Z. Qiu, H. Zhong, X. Zhao, Z. Liu and W. Huang, J. Pet. Sci. Eng., 2022, 208, 109704 CrossRef CAS.
- D. F. S. Petri, J. Appl. Polym. Sci., 2015, 132, 42035 CrossRef.
- K. Sehly, H.-L. Chiew, H. Li, A. Song, Y.-K. Leong and W. Huang, Appl. Clay Sci., 2015, 104, 309–317 CrossRef CAS.
- A. M. A. Hasan and M. E. Abdel-Raouf, Egypt. J. Pet., 2018, 27, 1043–1050 CrossRef.
- S. Shanmugam, G. Ross, C. Y. Mbuncha and A. Santra, Polym. Chem., 2021, 12, 6705–6713 RSC.
- F. G. Fischer and H. Dörfel, Die Polyuronsäuren der Braunalgen (Kohlenhydrate der Algen I), Jahresband, vol. 302, 1955, pp. 186–203 Search PubMed.
- S. Li, N. He and L. Wang, Mar. Drugs, 2019, 17, 540 CrossRef CAS.
- Z. Tian, L. Zhang and C. Ni, Environ. Sci. Pollut. Res. Int., 2019, 26, 32397–32406 CrossRef.
- X. Chen, L.-x. Lu, X. Qiu and Y. Tang, Food Control, 2017, 73, 1275–1284 CrossRef CAS.
- L. Yuan, Y. Wu, J. Fang, X. Wei, Q. Gu, H. El-Hamshary, S. S. Al-Deyab, Y. Morsi and X. Mo, Artif. Cells, Nanomed., Biotechnol., 2017, 45, 76–83 CrossRef CAS.
- L. Yuan, Y. Wu, Q. S. Gu, H. El-Hamshary, M. El-Newehy and X. Mo, Int. J. Biol. Macromol., 2017, 96, 569–577 CrossRef CAS PubMed.
- Q. S. Zhao, Q. X. Ji, K. Xing, X. Y. Li, C. S. Liu and X. G. Chen, Carbohydr. Polym., 2009, 76, 410–416 CrossRef CAS.
- K. Saravanakumar, A. Sathiyaseelan, A. V. A. Mariadoss, H. Xiaowen and M. H. Wang, Int. J. Biol. Macromol., 2020, 153, 207–214 CrossRef CAS.
- D. Alves, M. A. Cerqueira, L. M. Pastrana and S. Sillankorva, Food Res. Int., 2020, 128, 108791 CrossRef CAS.
- G. Luo, J. Wang, Y. Wang, B. Feng and J. Weng, J. Microencapsulation, 2015, 32, 129–136 CrossRef CAS.
- A. A. Egorov, A. Y. Fedotov, A. V. Mironov, V. S. Komlev, V. K. Popov and Y. V. Zobkov, Beilstein J. Nanotechnol., 2016, 7, 1794–1799 CrossRef CAS PubMed.
- S. Fu, X. Du, M. Zhu, Z. Tian, D. Wei and Y. Zhu, Biomed. Mater., 2019, 14, 065011 CrossRef CAS.
- L. Du, A. GhavamiNejad, Z. C. Yan, C. S. Biswas and F. J. Stadler, Carbohydr. Polym., 2018, 199, 58–67 CrossRef CAS.
- J. Yang, L. Liu and S. Han, Colloids Surf., A, 2017, 529, 320–327 CrossRef CAS.
- A. García, M. Culebras, M. N. Collins and J. J. Leahy, J. Appl. Polym. Sci., 2018, 135, 46217 CrossRef.
- C. Toigo, M. Kracalik, E. Bradt, K. H. Pettinger and C. Arbizzani, Polymers, 2021, 13, 3582 CrossRef CAS PubMed.
- S. M. Lalji, S. I. Ali, H. Sohail, A. R. Misbah, K. Azam and N. Navaid, Chem. Pap., 2022, 76, 6461–6473 CrossRef CAS.
- A. Kariman Moghaddam and A. Ramazani Saadatabadi, J. Pet. Sci. Eng., 2020, 189, 107028 CrossRef CAS.
- H. Movahedi and S. Jamshidi, J. Pet. Sci. Eng., 2021, 198, 108224 CrossRef CAS.
- A. Das, E. L. Gilmer, S. Biria and M. J. Bortner, ACS Appl. Polym. Mater., 2021, 3, 1218–1249 CrossRef CAS.
- Y. Jiang, J. A. De La Cruz, L. Ding, B. Wang, X. Feng, Z. Mao, H. Xu and X. Sui, Int. J. Biol. Macromol., 2020, 148, 811–816 CrossRef CAS.
- X. Gao, H.-Y. Zhong, X.-B. Zhang, A.-L. Chen, Z.-S. Qiu and W.-A. Huang, Pet. Sci., 2021, 18, 1163–1181 CrossRef.
- L. C. Sow, N. Z. Y. Toh, C. W. Wong and H. Yang, Food Hydrocolloids, 2019, 94, 459–467 CrossRef CAS.
- J. S. Kim, D. H. Kim and Y. S. Lee, Polymers, 2021, 13, 663 CrossRef CAS PubMed.
- A. V. Walter, L. N. Jimenez, J. Dinic, V. Sharma and K. A. Erk, Rheol. Acta, 2019, 58, 145–157 CrossRef CAS.
- G. L. R. Leal, A. I. C. Garnica, R. R. Silva, L. R. Viana, A. C. B. Júnior, J. C. O. Freitas and F. D. S. Curbelo, J. Pet. Sci. Eng., 2022, 215, 110562 CrossRef CAS.
- F. Guerretta, G. Magnacca, F. Franzoso, P. Ivanchenko and R. Nisticò, Mater. Lett., 2019, 234, 339–342 CrossRef CAS.
- D. Gao, X. Li, Y. Cheng, B. Lyu and J. Ma, Int. J. Biol. Macromol., 2022, 200, 557–565 CrossRef CAS PubMed.
- E. U. Akpan, G. C. Enyi, G. Nasr, A. A. Yahaya, A. A. Ahmadu and B. Saidu, J. Pet. Sci. Eng., 2019, 175, 1028–1038 CrossRef CAS.
- F. Liu, C. Zhang, X. Li, Z. Zhang, X. Wang, X. Dai, M. Zhou and Q. Liu, Colloids Surf., A, 2022, 636, 128099 CrossRef CAS.
- J. Su, M. Liu, L. Lin, X. Pu, C. Ge, T. Zhang and G. Liu, J. Pet. Sci. Eng., 2022, 208, 109618 CrossRef CAS.
- D. R. Nascimento, B. R. Oliveira, V. G. P. Saide, S. C. Magalhães, C. M. Scheid and L. A. Calçada, J. Pet. Sci. Eng., 2019, 182, 106275 CrossRef CAS.
- T. Ma, N. Peng and P. Chen, J. Nat. Gas Sci. Eng., 2020, 79, 103350 CrossRef.
- X. Zhao, D. Li, H. Zhu, J. Ma and Y. An, RSC Adv., 2022, 12, 22853–22868 RSC.
- H. Jia, P. Huang, Q. Wang, Y. Han, S. Wang, F. Zhang, W. Pan and K. Lv, Fuel, 2019, 244, 403–411 CrossRef CAS.
| This journal is © The Royal Society of Chemistry 2022 |

