 Open Access Article
Triangulo-{ErIII3} complex showing field supported slow magnetic relaxation†
Mamo Gebrezgiabher ab,
Sören Schlittenhardt
 c,
Cyril Rajnák
 b,
Juraj Kuchár
 d,
Assefa Sergawie
 a,
Juraj Černák
 d,
Mario Rubencef,
Madhu Thomas
 *a and
Roman Boča
 *b
*b
aDepartment of Industrial Chemistry, College of Applied Sciences, Nanotechnology Excellence Center, Addis Ababa Science and Technology University, Addis Ababa P.O. Box 16417, Ethiopia. E-mail: madhu.thomas@aastu.edu.et
bDepartment of Chemistry, Faculty of Natural Sciences, University of SS Cyril and Methodius, 91701 Trnava, Slovakia. E-mail: roman.boca@ucm.sk
cInstitute of Nanotechnology, Karlsruhe Institute of Technology, Hermann-von-Helmholtz-Platz 1, 76344 Eggenstein-Leopoldshafen, Germany
dDepartment of Inorganic Chemistry, Institute of Chemistry, P. J. Šafárik University in Košice, 041 80 Košice, Slovakia
eInstitute of Quantum Materials and Technologies (IQMT, ), Karlsruhe Institute of Technology, Hermann-von-Helmholtz-Platz 1, 76344 Eggenstein-Leopoldshafen, Germany
fCentre Européen de Science Quantique (CESQ), Institut de Science et d’Ingénierie Supramoléculaires (ISIS, UMR 7006), CNRS-Université de Strasbourg, 8 allée Gaspard Monge BP 70028 67083, Strasbourg Cedex, France
First published on 4th August 2022
Abstract
The triangulo-{Er3} complex [Er3Cl(o-van)3(OH)2(H2O)5]Cl3·nH2O (n = 9.4; H(o-van) = o-vanillin) (1) was generated by an in situ method. The isolated Er(III) complex 1 was characterized by elemental analysis and molecular spectroscopy. The results of single crystal X-ray diffraction studies have shown that 1 is built up of trinuclear [Er3Cl(o-van)3(OH)2(H2O)5]3+ complex cations, chloride anions and water solvate molecules. Within the complex cation the three Er(III) central atoms are placed at the apexes of a triangle which are bridged by three (o-van)− ligands with additional chelating functions and two μ3-OH− ligands. Additionally five aqua and one chlorido ligands complete the octa-coordination of the three Er(III) atoms. AC susceptibility measurements reveal that the compound exhibits slow magnetic relaxation with two relaxation modes.
Introduction
Single molecule magnets (SMMs) and single ion magnets (SIMs) are usually coordination compounds that exhibit slow relaxation of their magnetization in the absence of an external magnetic field at a molecular level.1 Since the discovery of a dodecanuclear manganese cluster as a SMM,2 a plethora of SMMs were made of homometallic3–7 and heterometallic8–15 transition metals and have been reported. Lanthanides entered into this spectacular field of molecular magnetism owing to their large magnetic moments and huge magnetic anisotropy despite their weak exchange interactions due to the efficient shielding of the unpaired electrons in the 4f orbitals. The reports on lanthanide based SIMs and SMMs increased recently, after the report of Ishikawa's phthalocyanine mononuclear double decker SIMs16 and Powell's exotic Dy3 triangles showing SMM behavior in a thermally populated excited state with an almost nonmagnetic ground state.17In continuation of these reports, pure Dy(III) based SMMs have drawn the attention of many investigators as evident by the huge number of contributions to this particular field of molecular magnetism,18–31 generating a variety of SMM's with Dy(III).4,32–37 But their characteristics with respect to the blocking temperature and energy barrier need further improvement and advancement.
The SMM chemistry of Er(III) is much popular now a days, in terms of its large coercive fields with a hysteresis loop persisting up to 12 K;38 featuring the highest energy barrier (300 cm−1) to date;39 by varying the energy barrier and quantum tunneling of magnetization (QTM) with respect to the coordination environments;40 showing the ability in retaining magnetization by controlling the Raman relaxation process;41 having magnetic hysteresis loop up to 5 K (200 Oe s−1);42 also exhibiting magnetic relaxation dynamics in low coordination environment.43
With a slight difference in symmetry,44 Er(III) complex exhibits slow magnetic relaxation under zero dc field with a relaxation barriers of ∼150 cm−1 and waist-restricted magnetic hysteresis. The incorporation of an equatorial ligand field facilitates slow magnetic relaxation in the prolate Er(III) ion and shows good characteristics for application in quantum information processing.45
With this all in mind, we have synthesized erbium triangle (cluster) which was obtained by the condensation of o-vanillin and 2-(aminomethyl)pyridine in the presence of triethylamine in methanolic medium under in situ condition. The erbium triangle thus generated is comparable with the previously reported dysprosium, gadolinium and ytterbium triangles made up of the same ligand.17,46,47
Therefore, herein we are reporting about a triangulo-{Er3} complex with formula unit C24H33O25.47Cl4Er3 (1) made of o-vanillin (2-hydroxy-3-methoxybenzaldehyde). The crystal structure analysis reveals that the Er3 triangle is capped by two μ3-hydroxo bridges. Magnetic studies reveal that the complex is a field induced SMM with two relaxation modes (low frequency and high-frequency modes).
Experimental section
General procedures
All starting materials o-vanillin, 2-aminomethyl pyridine, triethylamine, erbium chloride hexahydrate and methanol were of analytical reagent grade and were used as commercially obtained without further purification. Elemental analysis for C, H, and N were carried out on Flash 2000 CHNSO apparatus (Thermo Scientific). FTIR spectra were measured in region of 400–4000 cm−1 at room temperature (Shimadzu IR Affinity−1, Quest holder).Magnetic susceptibility data were collected at temperatures between 2–300 K using a Quantum Design MPMS-XL SQUID magnetometer at an external field of 0.1 T. The samples were grounded and fixed in a gelatine capsule using small amounts of eicosane to avoid any movement of the sample. The data obtained were corrected for diamagnetic contributions of the sample, the eicosane, the gelatine capsule and the sample holder.
Synthesis of erbium complex (1)
The complex 1 was prepared by the addition of a methanolic solution ErCl3·6H2O (1.0 mmol, 0.381 g) in 15 mL dropwise to a stirring solution of o-vanillin (1 mmol, 0.152 g), 2-aminomethyl pyridine (1 mmol, 0.108 mL) in the presence of triethylamine (1 mmol, 0.101 mL) in methanol (50 mL). The resultant reaction mixture was refluxed for 4 hours in an oil bath. The yellow solution obtained on reflux was cooled to room temperature and filtered. Vapor diffusion of diethyl ether to the filtered yellow solution yielded X-ray quality yellow block crystals. The complex was collected by filtration and washed with cold MeOH and dried in air and vacuum. Yield, 160 mg/35%, Anal. calct for (1), 20.98(C), 2.4(H), found 21.19 (C), 2.35(H). IR (KBr disc) cm−1: 3365 (m), 2363 (br), 1631 (s), 1468 (s), 1355 (s), 1298 (m), 1221 (s), 739 (s), 652 (m), 423(m).X-ray crystallography
Single crystal data of 1 were collected at 95.15 K on a SuperNova Dual diffractometer equipped with AtlasS2 detector and using graphite-monochromated Mo Kα radiation (λ = 0.71073 Å). The data collection was done using the CrysAllisPro system.48 The data were corrected for absorption using numerical absorption correction based on Gaussian integration over a multifaceted crystal model, with Tmin = 0.528 and Tmax = 0.853. The structure of 1 was solved by direct methods and refined by full-matrix least-squares techniques on F2 using SHELXT and SHELXL programs, respectively,49–51 which were incorporated in the WinGX program package.52 H-atoms of the o-van ligand were placed in calculated positions. The positional coordinates of the methine (![[double bond, length as m-dash]](https://www.rsc.org/images/entities/char_e001.gif) C)–H hydrogen atoms were refined. The positional coordinates of the hydroxo and aqua ligand hydrogen atoms were refined with application of restrained O–H and H⋯H distances. The chloride anion in the lattice is disordered with half occupancies induced by their close positions (Cl4A, Cl4B). The majority of lattice water molecules are disordered, some over three positions. The disordered water molecules were refined assuming common thermal motion. Their site occupation factors were first refined and then fixed. We note that in the difference map remained three peaks with heights between 1.0 and 1.85 e Å−1 but these were situated close to the Er(III) atoms. As a consequence of extended disorder, the hydrogen atoms of all lattice water molecules cannot be found in the difference map and were not involved in calculations. Structural figures were drawn using Diamond program.53
C)–H hydrogen atoms were refined. The positional coordinates of the hydroxo and aqua ligand hydrogen atoms were refined with application of restrained O–H and H⋯H distances. The chloride anion in the lattice is disordered with half occupancies induced by their close positions (Cl4A, Cl4B). The majority of lattice water molecules are disordered, some over three positions. The disordered water molecules were refined assuming common thermal motion. Their site occupation factors were first refined and then fixed. We note that in the difference map remained three peaks with heights between 1.0 and 1.85 e Å−1 but these were situated close to the Er(III) atoms. As a consequence of extended disorder, the hydrogen atoms of all lattice water molecules cannot be found in the difference map and were not involved in calculations. Structural figures were drawn using Diamond program.53
Results and discussion
The erbium trinuclear complex 1 was isolated by reacting hydrated erbium chloride with 2-hydroxy-3-methoxybenzaldehyde (o-vanillin) and 2-(aminomethyl)pyridine in the presence of triethylamine in methanolic medium under in situ conditions. Instead of the expected formation of a complex with a Schiff base type ligand, a triangular complex based only on a deprotonated o-vanillin ligand was separated from the reaction mixture. This is in line with our synthetic experience that the topology of o-vanillin is mostly favoring the triangular architecture even if o-vanillin is mixed with a variety of aromatic or heterocyclic primary amines during in situ synthesis.17In the IR spectrum of complex 1 (Fig. S1†), the peaks at 1631 cm−1, 1355 cm−1, 1221 cm−1 and 1468 cm−1 are corresponding to aldehydic carbonyl (C![[double bond, length as m-dash]](https://www.rsc.org/images/entities/char_e001.gif) O), ring phenolic oxygen (C–O), methoxy and aromatic ring stretching vibrations, respectively.54
O), ring phenolic oxygen (C–O), methoxy and aromatic ring stretching vibrations, respectively.54
Single crystal X-ray study confirms that the asymmetric part of the crystal structure of 1 contains one trinuclear [Er3Cl(o-van)3(OH)2(H2O)5]3+ complex cation, three chloride anions and water solvate molecules. This complex of Er(III) with o-van ligand is novel. Analogous triangular arrangement of Er(III) atoms was already found in an Er(III) complex with the 5-bromo derivate of o-van, o-vanBr and methanol as ligands as well as solvate molecules, namely [Er3Cl3(o-vanBr)3(OH)2(CH3OH)3]Cl·3CH3OH.55 It should be noted that in this complex the donor sets of the Er(III) central atoms differ from that observed in our complex 1. As to the other lanthanide elements, such triangular arrangement was reported for Dy(III) [Dy3Cl(o-van)3(OH)2(H2O)5]Cl3·9H2O17 and Yb(III) [Yb3Cl(o-van)3(OH)2(H2O)5]Cl3·4H2O.47 The Er(III) complex is similar to previously reported Gd(III)46 and Dy(III) triangles in terms of their bond distances and bond angles.17
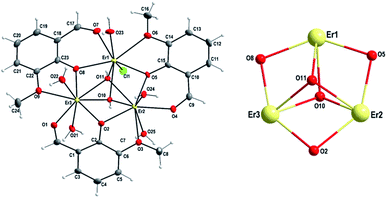
Within the [Er3(o-van)3(OH)2Cl(H2O)5]3+ complex cation, two aqua ligands are coordinated to Er(2) and Er(3) atoms (Fig. 2, left) above and below the plane of the triangle, while for Er(1) atom, the terminal ligands are formed by a single aqua ligand above and a chlorido ligand below the plane of the triangle (Fig. 2, left). In addition to this, there are two μ3-hydroxo bridges above and below the plane capping the Er3 triangular arrangement from both sides of the triangle (Fig. 2, left). In the {Er3O5} core, as indicated in Fig. 2, right, three Er(III) centers are held together by multiple monoatomic o-bridges. The respective distances between the Er(III) atoms are 3.5091(6), 3.4779(6) and 3.5052(5) Å for Er(1)⋯Er(2), Er(2)⋯Er(3) and Er(1)⋯Er(3) contacts, respectively. These Er⋯Er distances (Table 1) are very close to those found in the analogous complex [Er3Cl3(o-vanBr)3(OH)2(CH3OH)3]Cl·3CH3OH (3.4845(7), 3.4895(9) and 3.5219(7) Å)55 and comparable to previously reported Dy⋯Dy, Gd⋯Gd and Yb⋯Yb distances for the same type o-vanillin based triangular complexes.17,46,47
| O11–Er3 | 2.328(3) Å | O11–Er2 | 2.341(3) Å |
| O10–Er3 | 2.360(3) Å | O24–Er2 | 2.361(3) Å |
| O2–Er3 | 2.284(3) Å | O4–Er2 | 2.292(4) Å |
| O21–Er3 | 2.330(3) Å | O10–Er2 | 2.336(3) Å |
| O1–Er3 | 2.324(3) Å | O2–Er2 | 2.314(3) Å |
| O9–Er3 | 2.500(4) Å | O25–Er2 | 2.316(3) Å |
| O22–Er3 | 2.319(4) Å | O3–Er2 | 2.512(4) Å |
| O8–Er3 | 2.298(3) Å | Er3–Er2 | 3.4779(7) Å |
| O6–Er1 | 2.509(3) Å | Er1–Er3 | 3.5052(5) Å |
| O5–Er1 | 2.295(3) Å | Er2–Er1 | 3.5091(7) Å |
| O23–Er1 | 2.329(3) Å | Er2–O2–Er3 | 98.3(1)° |
| O7–Er1 | 2.339(4) Å | Er2–O10–Er3 | 95.5(1)° |
| O8–Er1 | 2.313(3) Å | Er2–O11–Er3 | 96.3(1)° |
| O11–Er1 | 2.394(3) Å | Er3–O11–Er1 | 95.8(1)° |
| O10–Er1 | 2.335(3) Å | Er2–O11–Er1 | 95.6(1)° |
| Cl1–Er1 | 2.661(1) Å | Er2–O5–Er1 | 99.6(1)° |
| O5–Er2 | 2.298(3) Å | Er3–O8–Er1 | 98.9(1)° |
All erbium centers in the triangular array are octa-coordinated with O7Cl, O8 and O8 donor sets for Er1, Er2 and Er3 atoms, respectively. Calculations using the SHAPE procedure56 indicate that the coordination polyhedra of all three Er central atoms correspond to triangular dodecahedra (Fig. 1 and Table S1†). The same polyhedra for Er(III) central atoms are present in the analogous [Er3Cl3(o-vanBr)3(OH)2(CH3OH)3]Cl·3CH3OH complex (Table S1†)55 and somewhat similar coordination modes have been observed for the gadolinium and dysprosium analogues from the previous reports.17,46
The observed Er–O distances in 1 are in the range 2.284(3)–2.509(3) Å while the Er–Cl bond exhibits a value of 2.661(1) Å (Table 1). These values well correspond to the ranges of 2.283(4)–2.525(4) Å and 2.6406(17)–2.6714(17) Å for Er–O and Er–Cl bond distances, respectively, in the analogous Er(III) complex [Er3Cl3(o-vanBr)3(OH)2(CH3OH)3]Cl·3CH3OH.55
The positive charge of the complex cation in 1 is counterbalanced with the negative charge of three chloride anions. These chloride anions along with the chlorido ligand are involved in the formation of a hydrogen bonding network which results in a three-dimensional supramolecular structure of 1 (Fig. S2 and Table S2†). Within the polymeric hydrogen bonded system, a chain-like arrangement of triangular complex cations can be distinguished (Fig. S3†). The chloride counter ions Cl2 and Cl3 link the triangular units by hydrogen bonds with the two bonded aqua ligands (O21 and O23) (Table S2†) and these hydrogen bonds are reinforced by hydrogen bonds formed by capping hydroxide ligands (O10 and O11). Within this chain-like arrangement, there exists the shortest intermolecular distance of 8.104 Å between two Er(III) atoms, namely the one Er1⋯Er1III (III: 1 − x, 1 − y, 1 − z).
For each of the triangular pairs along the chain, a phenyl ring from a unit in the neighbouring chain interleaves giving a side-on phenyl carbon C(13)⋯Cl(4B) distance of 3.51 Å. This phenyl is also between two other phenyl groups on a neighbouring chain at ca. 3.84 Å. Hence, considering plane 1 (1 − x, −1/2 + y, 3/2 − z), the angle of π–π interaction is 12.890° with a centroid–centroid distance of 3.811 Å and a distance shift of 1.150 Å. When we look along plane 2 (3/2 − x, +y, 1 − z), the π–π interaction angle is around 12.690° with a centroid–centroid distance of 3.876 Å having a distance shift of 0.696 Å. No interaction is found along plane 3.
DC magnetic data for 1
The ground electronic state (multiplet) of an Er(III) centre is 4I15/2 with gJ = 6/5. Three Er(III) centres produce N = 163 = 4096 magnetic states and M = 192 zero field states with equal energy. When only the isotropic exchange is considered, the total molecular angular momentum (J) is a good quantum number and the large-dimensional interaction matrix can be factored to low-dimensional blocks. Namely, for the molecular values Jmin = 1/2 to Jmax = 3·(15/2) = 45/2 the dimensions of blocks are 2, 4, 6, 8, 10, 12, 14, 16, 15, 14, 13, 12, 11, 10, 9, 8, 7, 6, 5, 4, 3, 2, and 1. This means that the block of the maximum dimensionality is a matrix 16 × 16 that can easily be diagonalized in order to get energy levels. Each block can be filled by exploiting the apparatus of the irreducible tensor operators as described elsewhere.57 Then the eigenvalues enter the partition function and the magnetization and the magnetic susceptibility are calculated by means of the statistical thermodynamics. A requirement for such a procedure is a uniform set of g-factors, that is fulfilled in the present case.The temperature dependence of the magnetic susceptibility was converted to the dimensionless product function χT/C0 where C0 = NAμ0μ2B/kB = 4.714 × 10⁻⁶ m3 mol−1 [SI] is the reduced Curie constant containing only the fundamental physical constants in their usual meaning (Fig. 3, left).
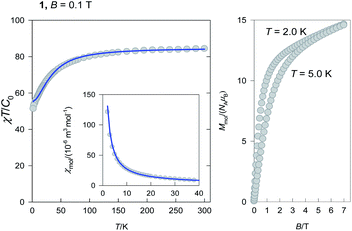 | ||
| Fig. 3 DC magnetic data for 1(inset – molar magnetic susceptibility) (left). Solid lines – fitted and magnetization curve (right). | ||
The product function at room temperature adopts a value of χT/C0 = 84.4 and on cooling it decrease to a value of 51.4 at T = 2.0 K. The theoretically expected value for three uncoupled Er(III) centres possessing the maximum J = 15/2 is 3 × 30.6 = 91.8.57 The observed lower value is a consequence of the exchange coupling of an antiferromagnetic nature and irregular energy spectrum as explained below.
The magnetization (Fig. 3, right) per formula unit M1 = Mmol/(NAμB) does not saturate at T = 2.0 K and B = 7.0 T to the maximum values for Jmax = 45/2. This is also a fingerprint of the irregular energy spectrum.
Before fitting the magnetic data there is a need to be emphasized that a triangulo-{Er3} complex refers to the isosceles triangle (C2v) since the Er–Er distances are 3.505, 3.509 and 3.478 Å so that instead of a single exchange coupling constant two different (J twice, and J′) need be considered. The simple exchange coupling model with the isotropic exchange Hamiltonian
 | (1) |
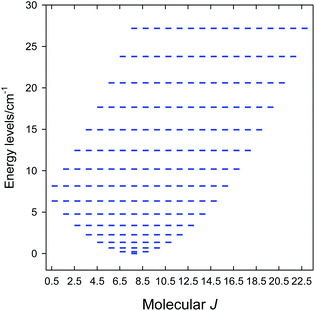
The zero-field energy levels (M = 192) are displayed in Fig. 4 showing that the ground molecular state is J = 21/2. This explains the observed values of the product function and maximum M1. A further improvement of the model would be based on the g-factor asymmetry, zero-field splitting, asymmetric exchange and/or antisymmetric exchange. Then, however, the blocking of the interaction matrix with N = 4096 states is not beneficial since there would be the off-diagonal matrix elements mixing the blocks of the different angular momentum.57
AC magnetic data for 1
The AC susceptibility data was taken with the same hardware as DC ones at the different temperature–frequency-DC field regimes; BAC = 0.35 mT.The AC susceptibility components are displayed in Fig. 5 for a set of trial frequencies at different external field BDC = 0–0.5 T and T = 2.0 K. In the absence of the external field, the out-of-phase susceptibility (χ′′) is silent. With increasing applied field it increases and culminates around BDC = 0.3 T for the lowest frequencies. However, the maximum alters with the frequency of the AC field. It can be concluded that 1 exhibits a field supported slow magnetic relaxation.
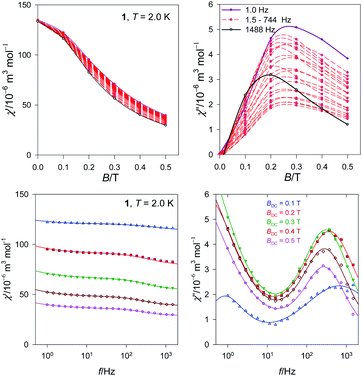 | ||
| Fig. 5 Field dependence (top) and frequency dependence (bottom) of the AC susceptibility components for 1 at T = 2.0 K. | ||
The second scan refers to a selected external field BDC = 0.3 T and the variable is the frequency between f = 0.1 and 1500 Hz for temperature rising from T = 2.0–4.5 K in steps of 0.25 K (Fig. 6 and S4†).
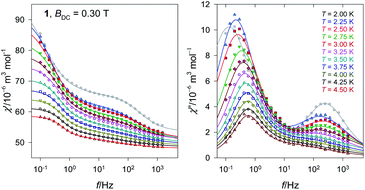 | ||
| Fig. 6 Frequency dependence of the AC susceptibility components for a set of temperatures for 1. Lines – fitted. | ||
The complex 1 exhibits two relaxation modes: the low-frequency mode (LF) below f < 1 Hz, and the high-frequency one (HF) above 100 Hz. On heating, both of them escape. The fitting to a two-set Debye model58 at BDC = 0.3 T and T = 2.0 K gave the relaxation times τLF = 1.2(1) s, τHF = 0.61(4) ms, and the mole fraction of the LF species xLF = 0.73. The relaxation time over the magic border of 1 s is rare.59 The adiabatic susceptibility χS = 53 × 10−6 m3 mol−1 [SI units] is also large.
The Argand diagram is presented in Fig. 7 showing two overlapped arcs.
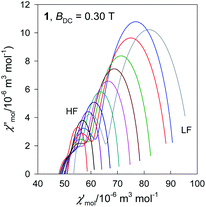 | ||
| Fig. 7 Argand diagram for 1. Lines are fitted. Colour codes from Fig. 6. | ||
On heating the high-temperature mode exhibits a reciprocating thermal behaviour;60,61 the relaxation time decreases in contrast to the usual thermal development. At BDC = 0.3 T and T = 4.0 K; the relaxation times are τLF = 0.30(1) s, τHF = 4.5(16) ms, and the mole fraction of the LF species xLF = 0.54.
The Arrhenius-like plot ln![[thin space (1/6-em)]](https://www.rsc.org/images/entities/char_2009.gif) τ vs. T−1 for the relaxation time and its ln
τ vs. T−1 for the relaxation time and its ln![[thin space (1/6-em)]](https://www.rsc.org/images/entities/char_2009.gif) τ vs. ln
τ vs. ln![[thin space (1/6-em)]](https://www.rsc.org/images/entities/char_2009.gif) T counterpart are drawn in Fig. 8 (left). The reciprocating thermal behaviour is well visible as prolongation of the relaxation time on heating between T = 2.0–4.0 K.
T counterpart are drawn in Fig. 8 (left). The reciprocating thermal behaviour is well visible as prolongation of the relaxation time on heating between T = 2.0–4.0 K.
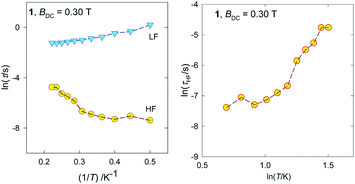 | ||
| Fig. 8 Various representations of the relaxation time vs. temperature for 1. Lines are guide for eyes. | ||
The magnetic properties of 1 were compared with the reported triangles made up of the same type ligand,17,46 and this behaviour is different from the Dy3 system reported by Powell et al.17 and Gd3 species presented by Costes et al.46
PXRD and TG-DTG analysis
The powder X-ray diffraction (PXRD) pattern of complex 1 is in good agreement with the simulated one from the respective crystal data as indicated in Fig. S5.† This suggests that the crystal structure is truly representative of the bulk materials and excludes the possibility of multi phases. The differences in intensity may be due to the preferred orientation of the powder samples.The thermo gravimetric analysis of the complex shows that it is stable up to 75 °C and decomposes in four stages. The first stage starts at 75 °C and ends at 120 °C corresponding to the removal of lattice water while the decomposition between 120 °C to 199 °C corresponds to the removal of coordinated water. The decomposition stages between 199 °C to 512 °C and 512 °C to 565 °C corresponds to the removal of the rest of the ligand moieties leaving metal chloride at 565 °C, which slowly sublimes after62 (Fig. S6†).
Conclusions
In summarizing, a novel triangular {Er3} complex has been synthesized and characterized by single crystal X-ray diffraction studies and elemental analysis. In the triangulo-{Er3} species, for the Er2 and Er3 centers two aqua ligands are coordinated below and above the plane of the triangle, while for Er1 the coordination site is occupied by one aqua ligand above and one chlorido ligand below the plane. In addition, two μ3-hydroxo bridges link the Er centers generating a coordination number of eight to all the three central atoms.In the present compound a distinct anisotropic center is created to Er1 compared to Er2 and Er3 due to the change in the coordination centers creating significant magnetic disparities between them. This creates ample of opportunity to vary the coordination mode and thus tune the SMM properties.
AC magnetic measurements reveal that 1 behaves as a field supported SMM with two-mode slow relaxation of magnetization having τLF = 0.30(1) s, τHF = 4.5(16) ms, and a mole fraction of the LF species xLF = 0.54 at T = 4.0 K and BDC = 0.3 T.
Author contributions
Mamo Gebrezgiabher: design, synthesis of the chemical compound, conceptualization, methodology, molecular spectroscopy study and analysis, formal analysis, investigation, writing – original draft, writing – review & editing, visualization. Sören Schlittenhardt: magnetic characterization, formal analysis, investigation, data curation, visualization, writing – review & editing, visualization. Cyril Rajnák: supervision, DC and AC magnetism studies and analysis, theoretical studies, magneto-structural correlations, funding acquisition, formal analysis, investigation, resources, data curation, writing – review & editing, visualization. Juraj Kuchár: crystallographic studies, SHAPE symmetry studies, formal analysis, investigation, data curation, writing – review & editing, visualization. Assefa Sergawie: supervision, editing, writing – review & editing, visualization. Juraj Černák: crystallographic studies, SHAPE symmetry studies, formal analysis, investigation, data curation, writing – review & editing, visualization. Mario Ruben: magnetic characterization, DC and AC magnetism studies, supervision, editing, and reviewing, data curation, writing – review & editing, visualization. Madhu Thomas: supervision, editing, formal analysis, investigation, data curation, writing – review & editing, visualization. Roman Boča: supervision, DC and AC magnetism studies and analysis, theoretical studies, magneto-structural correlations, funding acquisition, formal analysis, investigation, resources, data curation, writing – review & editing, visualization.Conflicts of interest
There are no conflicts to declare.Acknowledgements
We are thankful to national scholarship programme of the Slovak Republic 2021 for financial support and to Addis Ababa Science and Technology University, Ethiopia, for a PhD studentship (Mamo Gebrezgiabher). Slovak grant agencies (APVV 18-0016, APVV 19-0087, VEGA 1/0191/22, 1/0189/22 and VEGA 1/0086/21) are thankfully acknowledged. The authors thank Dr M. Dušek from Institute of Physics, AV ČR, Prague, Czech Republic for his kind permission to use the diffractometer facility. We acknowledge our thankfulness to Ms. R. Mičová, UCM, Trnava, Slovakia for the spectroscopic and microanalysis. We are thankful to Dr S. Klyatskaya from KIT, Germany and T. Gebretsadik from Changchun Institute of Applied Chemistry, CAS, China respectively, for their support and suggestions during this work. We are also thankful to Prof. Nandakumar Kalarikkal, Mahatma Gandhi University, Kottayam, India for TG analysis.References
- D. Gatteschi, R. Sessoli and J. Villain, Molecular Nanomagnets, Oxford University Press, Oxford, UK, 2006 Search PubMed.
- R. Sessoli, D. Gatteschi, A. Caneschi and M. A. Novak, Nature, 1993, 365, 141–143 CrossRef CAS.
- S. K. Langley, N. F. Chilton, B. Moubaraki and K. S. Murray, Dalton Trans., 2012, 41, 1033–1046 RSC.
- P. Abbasi, K. Quinn, D. I. Alexandropoulos, M. Damjanovi, A. Escuer, J. Mayans, M. Pilkington and T. C. Stamatatos, J. Am. Chem. Soc., 2017, 139, 15644–15647 CrossRef CAS PubMed.
- A. M. Ako, I. J. Hewitt, V. Mereacre, R. Clérac, W. Wernsdorfer, C. E. Anson and A. K. Powell, Angew. Chem., Int. Ed., 2006, 45, 4926–4929 CrossRef CAS PubMed.
- K. S. Gavrilenko, O. Cador, K. Bernot, P. Rosa, R. Sessoli, S. Golhen, V. V Pavlishchuk and L. Ouahab, Chem. - Eur. J., 2008, 14, 2034–2043 CrossRef CAS PubMed.
- A. Kawamura, A. S. Filatov, J. S. Anderson and I. Jeon, Inorg. Chem., 2019, 58, 3764–3773 CrossRef CAS PubMed.
- G. Wu, R. Clérac, W. Wernsdorfer, S. Qiu, C. E. Anson, I. J. Hewitt and A. K. Powell, Eur. J. Inorg. Chem., 2006, 2006, 1927–1930 CrossRef.
- N. Portolés-Gil, S. Gómez-Coca, O. Vallcorba, G. Marbán, N. Aliaga-Alcalde, A. López-Periago, J. A. Ayllón and C. Domingo, RSC Adv., 2020, 10, 45090–45104 RSC.
- R. Clérac, H. Miyasaka, M. Yamashita and C. Coulon, J. Am. Chem. Soc., 2002, 124, 12837–12844 CrossRef PubMed.
- H. Oshio, M. Nihei, S. Koizumi, T. Shiga, H. Nojiri, M. Nakano, N. Shirakawa and M. Akatsu, J. Am. Chem. Soc., 2005, 127, 4568–4569 CrossRef CAS PubMed.
- V. Mereacre, A. M. Ako, R. Clérac, W. Wernsdorfer, I. J. Hewitt, C. E. Anson and A. K. Powell, Chem. - Eur. J., 2008, 14, 3577–3584 CrossRef CAS PubMed.
- M. Dolai, M. Ali, C. Rajnák, J. Titiš and R. Boča, New J. Chem., 2019, 43, 12698–12701 RSC.
- S. Hazra, J. Titiš, D. Valigura, R. Boča and S. Mohanta, Dalton Trans., 2016, 45, 7510–7520 RSC.
- A. Vráblová, M. Tomás, L. R. Falvello, Ľ. Dlháň, J. Titiš, J. Černák and R. Boča, Dalton Trans., 2019, 48, 13943–13952 RSC.
- N. Ishikawa, M. Sugita, T. Ishikawa, S. Y. Koshihara and Y. Kaizu, J. Am. Chem. Soc., 2003, 125, 8694–8695 CrossRef CAS PubMed.
- J. Tang, I. Hewitt, N. T. Madhu, G. Chastanet, W. Wernsdorfer, C. E. Anson, C. Benelli, R. Sessoli and A. K. Powell, Angew. Chem., Int. Ed., 2006, 45, 1729–1733 CrossRef CAS PubMed.
- J. D. Rinehart and J. R. Long, Chem. Sci., 2011, 2, 2078–2085 RSC.
- A. Bhunia, M. T. Gamer, L. Ungur, L. F. Chibotaru, A. K. Powell, Y. Lan, P. W. Roesky, F. Menges, C. Riehn and G. Niedner-Schatteburg, Inorg. Chem., 2012, 51, 9589–9597 CrossRef CAS PubMed.
- S. Mukherjee, J. Lu, G. Velmurugan, S. Singh, G. Rajaraman, J. Tang and S. K. Ghosh, Inorg. Chem., 2016, 55, 11283–11298 CrossRef CAS PubMed.
- S. Mukherjee, A. K. Chaudhari, S. Xue, J. Tang and S. K. Ghosh, Inorg. Chim. Acta, 2013, 35, 144–148 CAS.
- R. Boča, M. Stolárová, L. R. Falvello, M. Tomás, J. Titiš and J. Černák, Dalton Trans., 2017, 46, 5344–5351 RSC.
- M. Gebrezgiabher, S. Schlittenhardt, C. Rajnák, A. Sergawie, M. Ruben, M. Thomas and R. Boča, Inorganics, 2022, 10, 66 CrossRef CAS.
- J. Long, F. Habib, P. H. Lin, I. Korobkov, G. Enright, L. Ungur, W. Wernsdorfer, L. F. Chibotaru and M. Murugesu, J. Am. Chem. Soc., 2011, 133, 5319–5328 CrossRef CAS PubMed.
- M. Gebrezgiabher, Y. Bayeh, T. Gebretsadik, G. Gebreslassie, F. Elemo, M. Thomas and W. Linert, Inorganics, 2020, 8, 1–66 CrossRef.
- Y. Guo, G. Xu, P. Gamez, L. Zhao, S. Lin, R. Deng, J. Tang and H.-J. Zang, J. Am. Chem. Soc., 2010, 132, 8538–8539 CrossRef CAS PubMed.
- Y. N. Guo, G. F. Xu, Y. Guo and J. Tang, Dalton Trans., 2011, 40, 9953–9963 RSC.
- Y. X. Zhang, X. Y. Cheng, Y. T. Tang, Y. H. Zhang, S. C. Wang, H. Y. Wei and Z. L. Wu, Polyhedron, 2019, 166, 23–27 CrossRef CAS.
- Y. Guo, X. Chen, S. Xue and J. Tang, Inorg. Chem., 2012, 51, 4035–4042 CrossRef CAS PubMed.
- K. Liu, W. Shi and P. Cheng, Coord. Chem. Rev., 2015, 289–290, 74–122 CrossRef CAS.
- A. Khan, O. Fuhr, M. N. Akhtar, Y. Lan, M. Thomas and A. K. Powell, J. Coord. Chem., 2020, 73, 1–10 CrossRef.
- C. A. P. Goodwin, F. Ortu, D. Reta, N. F. Chilton and D. P. Mills, Nat. Publ. Gr., 2017, 548, 439–442 CAS.
- F. S. Guo, B. M. Day, Y. C. Chen, M. L. Tong, A. Mansikkamäki and R. A. Layfield, Science, 2018, 362, 1400–1403 CrossRef CAS PubMed.
- F. Luan, T. Liu, P. Yan, X. Zou, Y. Li and G. Li, Inorg. Chem., 2015, 54, 3485–3490 CrossRef CAS PubMed.
- C. A. Gould, K. R. McClain, D. Reta, J. G. C. Kragskow, D. A. Marchiori, E. Lachman, E. S. Choi, J. G. Analytis, R. D. Britt, N. F. Chilton, B. G. Harvey and J. R. Long, Science, 2022, 375, 198–202 CrossRef CAS PubMed.
- K. Randall McClain, C. A. Gould, K. Chakarawet, S. J. Teat, T. J. Groshens, J. R. Long and B. G. Harvey, Chem. Sci., 2018, 9, 8492–8503 RSC.
- L. Spree, F. Liu, V. Neu, M. Rosenkranz, G. Velkos, Y. Wang, S. Schiemenz, J. Dreiser, P. Gargiani, M. Valvidares, C. H. Chen, B. Büchner, S. M. Avdoshenko and A. A. Popov, Adv. Funct. Mater., 2021, 31, 1–7 CrossRef.
- L. Ungur, J. J. Le Roy, I. Korobkov, M. Murugesu and L. F. Chibotaru, Angew. Chem., Int. Ed., 2014, 53, 4413–4417 CrossRef CAS PubMed.
- Y. S. Meng, C. H. Wang, Y. Q. Zhang, X. B. Leng, B. W. Wang, Y. F. Chen and S. Gao, Inorg. Chem. Front., 2016, 3, 828–835 RSC.
- H. Zhang, R. Nakanishi, K. Katoh, B. K. Breedlove, Y. Kitagawa and M. Yamashita, Dalton Trans., 2018, 47, 302–305 RSC.
- M. J. Giansiracusa, A. K. Kostopoulos, D. Collison, R. E. P. Winpenny and N. F. Chilton, Chem. Commun., 2019, 55, 7025–7028 RSC.
- L. Münzfeld, X. Sun, S. Schlittenhardt, C. Schoo, A. Hauser, S. Gillhuber, F. Weigend, M. Ruben and P. W. Roesky, Chem. Sci., 2022, 13, 945–954 RSC.
- P. Zhang, L. Zhang, C. Wang, S. Xue, S. Lin and J. Tang, Inorg. Chem., 2014, 132, 4484–4487 Search PubMed.
- K. R. Meihaus and J. R. Long, J. Am. Chem. Soc., 2013, 135, 17952–17957 CrossRef CAS PubMed.
- L. Münzfeld, C. Schoo, S. Bestgen, E. Moreno-Pineda, R. Köppe, M. Ruben and P. W. Roesky, Nat. Commun., 2019, 10, 1–7 CrossRef PubMed.
- J. P. Costes, F. Dahan and F. Nicodème, Inorg. Chem., 2001, 40, 5285–5287 CrossRef CAS PubMed.
- X. Zou, P. Yan, J. Zhang, F. Zhang, G. Hou and G. Li, Dalton Trans., 2013, 42, 13190–13199 RSC.
- R. CrysAlisPro 1.171.41.93a, Oxford Diffraction, Oxford Diffraction Ltd, England, 2020 Search PubMed.
- G. M. Sheldrick, Acta Crystallogr., Sect. A: Found. Crystallogr., 2015, 71, 3–8 CrossRef PubMed.
- G. M. Sheldrick, Acta Crystallogr., Sect. C: Struct. Chem., 2015, 71, 3–8 Search PubMed.
- G. M. S.-97 Sheldrick, Crystal structure refinement with SHELXL, Bruker AXS Inc, Madison, WI, WI, 1997, vol. version 5 Search PubMed.
- L. J. Farrugia, J. Appl. Crystallogr., 2012, 45, 849–854 CrossRef CAS.
- K. Brandenburg and H. Putz, Crystal Impact Diamond, Crystal and Molecular Structure Visualization, GbR Postfach, 1251, D-53002, Bonn, Germany, 2008 Search PubMed.
- K. Nakamoto, Infrared and Raman Spectra of Inorganic and Coordination Compounds Part A : Theory and Applications in Inorganic Chemistry, John Wiley & Sons, Inc., Hoboken, New Jersey, New Jersey, 2008 Search PubMed.
- X. Yang, R. A. Jones and M. J. Wiester, Dalton Trans., 2004, 3, 1787–1788 RSC.
- M. Llunell, D. Casanova, J. Cirera, P. Alemany and S. Alvarez, SHAPE - Program for the Stereochemical Analysis of Molecular Fragments by Means of Continuous Shape Measures and Associated Tools, Version 2.1, University of Barcelona, Spain, 2013 Search PubMed.
- R. Boča, A Handbook of Magnetochemical Formulae, Elsevier, Amsterdam, 2012 Search PubMed.
- R. Boča and C. Rajnák, Coord. Chem. Rev., 2021, 430, 213657 CrossRef.
- R. Boča, C. Rajnák, J. Moncol, J. Titiš and D. Valigura, Inorg. Chem., 2018, 57, 14314–14321 CrossRef PubMed.
- C. Rajnák and R. Boča, Coord. Chem. Rev., 2021, 436, 213808 CrossRef.
- C. Rajnák, J. Titiš and R. Boča, Magnetochemistry, 2021, 7, 1–76 CrossRef.
- W. W. Wendlandt, Thermal Analysis, John Wiley and Sons, New York, 3rd edn, 1986, vol. 19 Search PubMed.
Footnote |
| † Electronic supplementary information (ESI) available: X-ray structure analysis, and crystallographic and physical data. CCDC 2122186. For ESI and crystallographic data in CIF or other electronic format see https://doi.org/10.1039/d2ra04328a |
| This journal is © The Royal Society of Chemistry 2022 |


