 Open Access Article
Creative Commons Attribution 3.0 Unported Licence
Influence of structure phase transition on the thermoelectric properties of Cu2Se1−xTex liquid-like compounds
Trung Kien Macab,
Thi Thu Taab,
Huu Tuan Nguyen bc,
Van Du Nguyena,
Thi Lan Huong Phamd,
Van Thiet Duonge,
Tran Dang Thanhef,
Bach Thang Phan
 g and
Anh Tuan Duong
 *ab
*ab
aFaculty of Materials Science and Engineering, Phenikaa University, Yen Nghia, Ha-Dong District, Hanoi, 12116, Vietnam. E-mail: tuan.duonganh@phenikaa-uni.edu.vn
bPhenikaa Research and Technology Institute (PRATI), A&A Green Phoenix Group, 167 Hoang Ngan, Hanoi, 10000, Vietnam
cFaculty of Electrical and Electronic Engineering, Phenikaa University, Hanoi, 12116, Vietnam
dFaculty of Biotechnology, Chemistry and Environmental Engineering, Phenikaa University, Hanoi, 10000, Vietnam
eGraduate University of Science and Technology, Vietnam Academy of Science and Technology, 18-Hoang Quoc Viet, Cau Giay, Hanoi, 10000, Vietnam
fInstitute of Materials Science, Vietnam Academy of Science and Technology, 18-Hoang Quoc Viet, Cau Giay, Hanoi, 10000, Vietnam
gCenter for Innovative Materials and Architectures, Vietnam National University, Ho Chi Minh City, Vietnam
First published on 15th September 2022
Abstract
Copper chalcogenide Cu2(Se,Te) compounds are well known as typical p-type thermoelectric materials with a figure of merit (ZT) that can be optimized by the ratio of Se![[thin space (1/6-em)]](https://www.rsc.org/images/entities/char_2009.gif) :
:![[thin space (1/6-em)]](https://www.rsc.org/images/entities/char_2009.gif) Te. Here, by using the mechanical alloying and solid-state reaction methods, Te was substituted into Se sites within Cu2Se as the formula Cu2Se1−xTex (x = 0.1, 0.2, 0.25, and 0.3). The observed changes in structural phase, grain morphologies, and grain size were recorded by XRD and FE-SEM imaging with the appearance of the secondary phase of Cu2Te, with a Te content of x = 0.25. The layered structure morphology was observed more clearly at the high Te content. The electrical conductivity was greatly increased with enriched Te content while the maximum Seebeck coefficient was obtained in the Cu2Se0.75Te0.25 sample. Accordingly, a power factor value of up to 9.84 μW cm−1 K−2 at 773 K was achieved. The appearance of a Cu2Te phase with a Te content of 0.25 created a structural phase transition which results in a ZT value of 1.35 at 773 K in the Cu2Se0.75Te0.25 sample.
Te. Here, by using the mechanical alloying and solid-state reaction methods, Te was substituted into Se sites within Cu2Se as the formula Cu2Se1−xTex (x = 0.1, 0.2, 0.25, and 0.3). The observed changes in structural phase, grain morphologies, and grain size were recorded by XRD and FE-SEM imaging with the appearance of the secondary phase of Cu2Te, with a Te content of x = 0.25. The layered structure morphology was observed more clearly at the high Te content. The electrical conductivity was greatly increased with enriched Te content while the maximum Seebeck coefficient was obtained in the Cu2Se0.75Te0.25 sample. Accordingly, a power factor value of up to 9.84 μW cm−1 K−2 at 773 K was achieved. The appearance of a Cu2Te phase with a Te content of 0.25 created a structural phase transition which results in a ZT value of 1.35 at 773 K in the Cu2Se0.75Te0.25 sample.
1. Introduction
Thermoelectric (TE) materials are of increasing interest because they can directly convert waste heat from furnaces, vehicle engines, factories, or human bodies to electric power without moving parts.1 The performance of TE materials is determined by the figure of merit (ZT), defined as ZT = S2σT/κ, where S is the Seebeck coefficient, σ is the electrical conductivity, T is the absolute temperature, and κ is the total thermal conductivity (κ = κE + κL, where κE and κL are the electronic and lattice contributions, respectively).2 To maximize the ZT value of materials, larger power factor (S2σ) and lower thermal conductivity (κ) of materials are required.3 The Seebeck coefficient can be improved by some methods such as resonance doping,4,5 band convergence,6 hyperconvergence,7,8 Rashba splitting,9 band gap enlargement,10,11 and breaking of crystal mirror symmetry.12 The balance between low effective mass and high mobility of charge carriers can enhance their electrical conductivity.3,13 The thermal conductivity can be minimized by adding a number of interfaces and phonon scattering centers.14Copper-base composites have been well-known as a high ZT value material. The copper chalcogenide compounds such as the Cu-base diamond-like compound (Cu2SnSe3, Cu2GeSe3, Cu3SbSe3, CuSbSe2, CuGaTe2 or CuInTe2,…) or Cu-base liquid-like compound Cu2(S, Se, Te) have high ZT value due to high electrical conductivity and low lattice thermal conductivity while other Cu-base such as the CuI compounds or CuI-based coordination polymer precursors exhibited high Seebeck coefficient.15–19 Among of the copper chalcogenide compounds, copper selenide (Cu2Se) has well-known as an excellent thermoelectric material due to its high ZT value, low cost, nontoxic, and tunable electrical transport properties. Belong to the group of liquid-like compounds, Cu2Se has a complex crystal structure with two main structural phases – α phase below 414 K and β phase formed above 414 K.20 In the high-temperature phase of Cu2Se, copper (Cu) ions are random located (liquid-like ions) inside the rigid sublattice of Se, leading to weak bonding and enhancing lattice phonon scatter.16,21 Until now, to increase the ZT value of Cu2Se, most researchers have focused on the control of doping elements and contents to modify electrical transport properties; nano-structuring to reduce thermal conductivity, and optimizing the growth method to control the structure and defect of materials for maximizing ZT value. Through the optimization of fabrication methods such as the hydrothermal, high-energy ball milling technique combined with spark plasma sintering (SPS), hot-pressing; and the control of the fabrication parameters (temperature and pressure), the ZT values of pure Cu2Se can achieve from 1.0 to 1.8 at around of 800–900 K.22–27 Fabrication of Cu2Se nanostructure leads to the formation of scattered interfaces, thus to reduce lattice thermal conductivity. On the other hand, under the nanoscale, quantum confinement effects enhance the electron density of states near the Fermi level, leading to the improvement of the Seebeck coefficient.16 The ZT values of Cu2Se nanostructure can be achieved above 2.0. For the doping method, the best TE performance with a ZT value of 2.62 was obtained at 756 °C for the bulk Cu1.94Al0.02Se.28 The good TE performance achieved by wet chemical method with the ZT from 0.9 to 1.6.29,30 Although the above manufacturing methods have resulted in well-improved TE properties of materials, they also have several limitations, which require expensive equipment and complex manufacturing protocol. Especially, for the melting process, which is necessary to rise to an extremely high temperature, takes more time, and the wet chemical method only produces a small amount of sample.
In the liquid-like compound of Cu2(S, Se, Te) group, the modification of S, Se, and Te elements content to maximize ZT value is attracting many research groups. Especially for control of Te contents in Cu2(Se, Te) material systems. In 2016, S. Butt et al. controlled Te doping contents (as Te-5%, Te-10%, Te-15%, and Te-20%, respectively in Cu2Se) and Te-10% doping in Cu2Se achieved the highest ZT value of 1.9 at 873 K.31 At lower 10% of Te doped Cu2Se, L. Yang et al. reported that the highest ZT value of 1.76 was observed at 850 K for Cu2Se0.98Te0.02 sample while Y. B. Zhu et al. described the same composition of Cu2Se0.98Te0.02 but using a different growth method, the ZT value could be achieved up to 1.25 at 773 K.20,32 K. Zhao et al. studied the thermoelectric properties of the series Cu2Se1−xTex (x = 0.2, 0.3, 0.5, and 0.7). The result showed that the crystal structure of the sample with Te content of 0.2 (Cu2Se0.8Te0.2) was nearly the same as Cu2Se, indicating no structural change.33 They also reported that the highest ZT value of 1.4 could be achieved for Cu2Se0.7Te0.3 at 1000 K with the Cu2Te phase observed. By using the chemical method, F.-H. Lin et al. reported the ZT value of 1.2 at 773 K and 1.4 at 920 K for the Cu2Se0.96Te0.04 sample.34 At around the transitional phase of the Cu2Se1−xTex (with Te contents between 0.2 to 0.3), the influence of Te content on the thermoelectric properties of these materials should be clarified.
Here, we focus on the Cu2Se1−xTex composition with Te contents of 0.1, 0.2, 0.25, and 0.3 by using a simple method, mechanical alloying combined with solid-state reaction (pressing and sintering). We found that, at 0.25 of Te content, the Cu2Te phase appeared, and a structural phase transition was observed. Especially, a new structural morphology was observed by FE-SEM images in the composition of Cu2Se0.75Te0.25 and Cu2Se0.7Te0.3. The highest ZT value of 1.35 was achieved at 773 K for the Cu2Se0.75Te0.25 sample.
2. Experimental
High purity powder of Cu (99.99%), Se (99.99%), and Te (99.99%) were weighed, according to the chemical compositions of Cu2Se1−xTex (x = 0.1, 0.2, 0.25, and 0.3). The stoichiometric elements were loaded into a tungsten carbide jar with tungsten carbide balls for mechanical alloying (MA) by a high-energy ball mill (FRITSCH Pulverisette 7, Germany) for 10 hours with the speed of 700 rpm. The nano-powder was loaded into a Ø 12 mm diameter mold and pressed under uniaxial pressure of 50 MPa at 523 K for 1 hour. The obtained samples were sintered at 873 K for 1 hour in an argon atmosphere. The crystal structure was investigated by X-ray diffraction (XRD) by using XRD EQUINOX 5000 Thermo Scientific, France with Cu-Kα radiation, λ = 1.54056 Å. Field-Emission Scanning Electron Microscopy (FE-SEM) was used to obtain the crystal morphologies. The electrical conductivity σ and Seebeck coefficient S were measured by a thermoelectric measurement system (Linseis-LSR3, Germany) using a four-probe contact method in a Helium atmosphere and a temperature range of 300 K to 773 K. The total thermal conductivity (κ) was calculated by the formula κ = DCpd. The thermal diffusivity (D) and the specific heat capacity (Cp) of all bulk samples were measured by NETZSCH LFA 467 using the laser flash method in the Ar atmosphere. The sample densities (d) were obtained by the basic calculation d = mV−1, where m is the mass of the sample and V is its volume.3. Results and discussion
The crystal structure of bulk Cu2Se1−xTex (x = 0.1, 0.2, 0.25, and 0.3) was observed by XRD patterns as shown in Fig. 1, corresponding to with two standard identification patterns of α-Cu2Se (card #96-155-6748) and Cu2Te (card #96-152-6238). At low Te content samples (Cu2Se0.9Te0.1 and Cu2Se0.8Te0.2), the XRD patterns were well-matched with trigonal α-Cu2Se (space group R![[3 with combining macron]](https://www.rsc.org/images/entities/char_0033_0304.gif) m). However, the XRD peaks shifted to a lower 2θ value with an increase of Te content, indicating that Te atoms substituted to Se sites in the Cu2Se lattice. A structural transformation of Cu2Se1−xTex was clearly observed at the proposed samples with the higher Te contents of x = 0.25 and 0.3. Particularly, the α-Cu2Se (107) diffraction peak at 2θ around 40° disappeared, meanwhile, a secondary phase of Cu2Te appeared (the Cu2Te peaks were marked (*) in XRD patterns), suggesting the formation of Cu2Se/Cu2Te hybrid structure at a Te content of 0.25. The structural phase transition of Cu2Se1−xTex was also observed by K. Zhao et al. with x ≥ 0.3.33 The enlarged patterns in the 2θ range of 34–40.5° were highlighted in Fig. 1b. The left shift of XRD peaks with increasing Te content indicated an expansion of lattice parameters.
m). However, the XRD peaks shifted to a lower 2θ value with an increase of Te content, indicating that Te atoms substituted to Se sites in the Cu2Se lattice. A structural transformation of Cu2Se1−xTex was clearly observed at the proposed samples with the higher Te contents of x = 0.25 and 0.3. Particularly, the α-Cu2Se (107) diffraction peak at 2θ around 40° disappeared, meanwhile, a secondary phase of Cu2Te appeared (the Cu2Te peaks were marked (*) in XRD patterns), suggesting the formation of Cu2Se/Cu2Te hybrid structure at a Te content of 0.25. The structural phase transition of Cu2Se1−xTex was also observed by K. Zhao et al. with x ≥ 0.3.33 The enlarged patterns in the 2θ range of 34–40.5° were highlighted in Fig. 1b. The left shift of XRD peaks with increasing Te content indicated an expansion of lattice parameters.
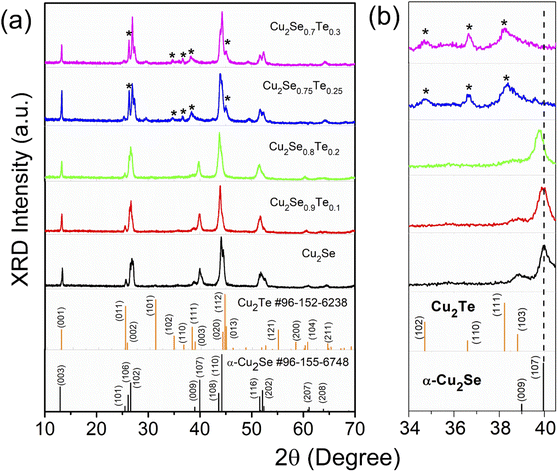 | ||
| Fig. 1 The room temperature X-ray diffraction of (a) Cu2Se1−xTex (x = 0; 0.1; 0.2; 0.25; and 0.3) and standard cards of α-Cu2Se and Cu2Te; (b) larger view of 2θ range from 34 to 40.5°. | ||
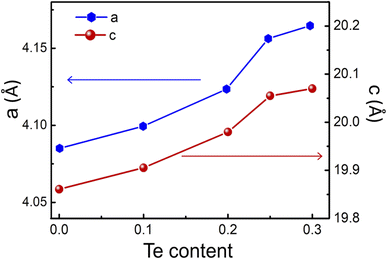
Fig. 2 demonstrates the increasing of a and c lattice parameters from 4.08 Å to 4.16 Å and 19.86 Å to 20.07 Å, respectively with Te content from x = 0 to x = 0.3. It can be explained by the substitution of the larger ionic radius of Te (0.221 nm) than that of Se (0.198 nm). The tellurium concentration gradually increased, and Te elements replaced the Se position until the saturation state was reached (x = 0.25). The leftover Te formed in the Cu2Te phase, which leaded to a change in the XRD patterns and the morphological structure (discuss later) of the proposed samples.
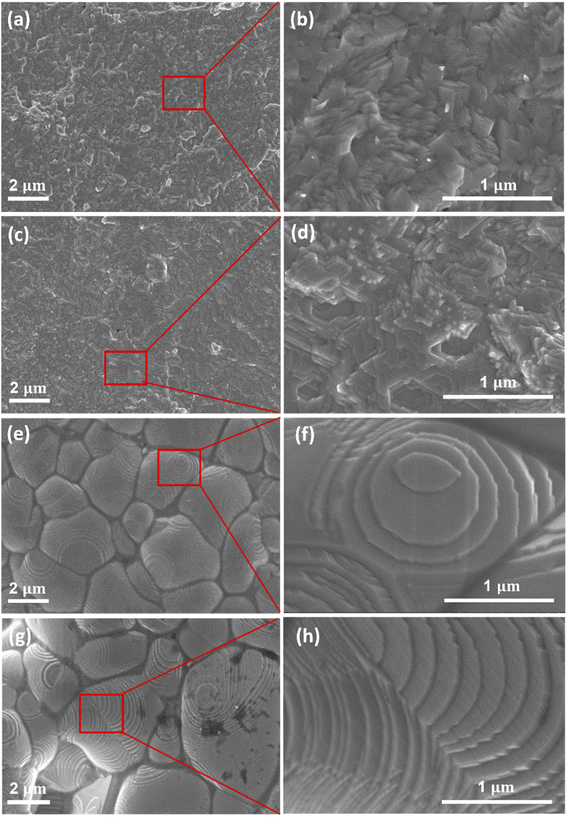
Surface morphology of Cu2Se1−xTex (x = 0.1, 0.2, 0.25, and 0.3) was observed by Field-emission scanning electron microscopy (FE-SEM) as shown in Fig. 3. The typical layer structure of samples was remarkably formed with the increasing Te doping content. Especially in samples with higher Te content (x = 0.25 and 0.3), the grain morphologies and grain boundaries markedly changed. The average grain size of Cu2Se0.75Te0.25 and Cu2Se0.7Te0.3 was around 2.5 μm and 3.4 μm, respectively. A lamellar microstructure with an average thickness of a few nm was clearly observed in the high content of Te samples. The change of morphology and structure induces the improvement of electrical conductivity, which was discussed below.
The temperature dependence of electrical conductivity (σ) of Cu2Se1−xTex (x = 0.1, 0.2, 0.25, and 0.3) was shown in Fig. 4a. The electrical conductivity of all samples decreased with higher temperature, indicating that all samples showed a degenerate semiconductor. An anomalous point at around ∼400 K of electrical conductivity data is attributed due to the phase transition from α-phase to β-phase of Cu2Se.35,36 The σ value of all samples as a function of temperature above 400 K was decreased, indicating a typical degenerate semiconducting behavior. Thus, with an increasing measuring temperature, there are fewer charge carriers generated while the contribution of the decrease in carrier mobility is large, leading to a decrease in electrical conductivity. Besides, the electrical conductivity greatly increases with the increasing Te content. It can be explained by the higher intrinsic electrical conductivity of Cu2Te is greatly higher than that of Cu2Se.16,20,33,37,38 The highest value of electrical conductivity was observed in the Cu2Se0.75Te0.25. It is around 54% higher than that of Cu2Se0.09Te0.0.1 in the temperature range from 300 K to 773 K. The light-decreasing electrical conductivity of the Cu2Se0.7Te0.3 sample could be explained by the reduction of Cu2+ ions due to the Cu2Te phase formation. K. Zhao et al. also observed a decreasing in the carrier concentration of Cu2Se0.7Te0.3, compared to other doping samples.33
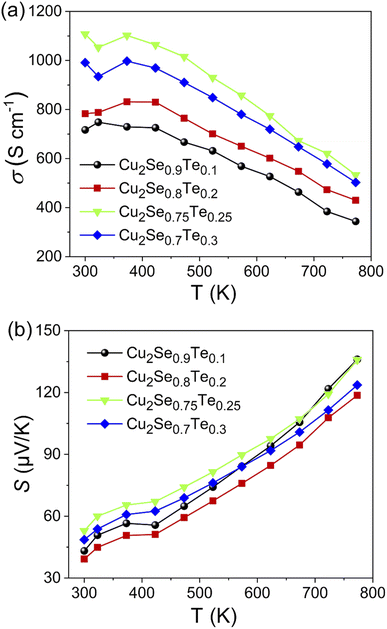 | ||
| Fig. 4 Temperature-dependent electronic transport properties of Cu2Se1−xTex (x = 0.1; 0.2; 0.25; 0.3). (a) Electrical conductivity (σ), (b) Seebeck coefficient (S). | ||
Seebeck coefficient as a function of temperature for all samples was presented in Fig. 4b. The positive Seebeck coefficient sign of all samples indicates that dominant charge carriers were holes and all samples showed p-type semiconducting behavior. As a type of degenerate semiconductor, the Seebeck coefficient of samples increased with an increase in temperature due to the electron–phonon scattering. In the temperature range from 300 K to 773 K, the maximum Seebeck coefficient of 135 μV K−1 was achieved in Cu2Se0.75Te0.25 sample, which can be related to the local thermal gradient due to the difference in the thermal conductivity of Cu2Te and Cu2Se.
The thermoelectric power factor was calculated by S2σ as shown in Fig. 5a. The electrical conductivity increased with increasing Te content while the Seebeck coefficient was still high, resulting in the highest power factor of 9.84 μW cm−1 K−2 at 773 K in Cu2Se0.75Te0.25 sample. The non-linear PF at around 400 K was due to the phase transition from α-phase to β-phase of Cu2Se.
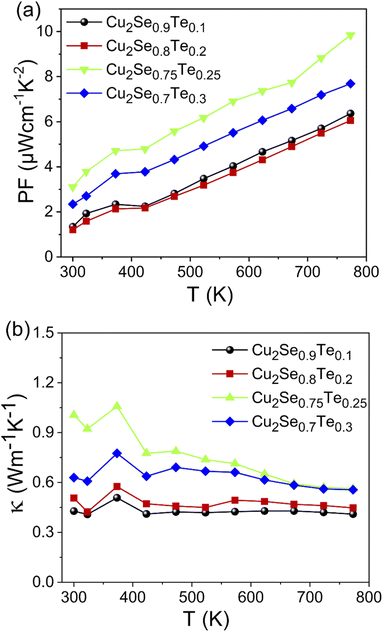 | ||
| Fig. 5 The temperature dependent (a) power factor and (b) thermal conductivity of Cu2Se1−xTex (x = 0.1; 0.2; 0.25; 0.3). | ||
The temperature-dependent total thermal conductivity (κ) of Cu2Se1−xTex samples was presented in Fig. 5b. Those Te-doped Cu2Se samples also possessed very low total thermal conductivity, according to what we initially envisioned based on their natural liquid-like structures. As a general thermoelectric semiconductor, κL decreases due to the enhanced phonon scattering. Furthermore, combined with the trend of the electrical conductivity, it could be concluded that the carrier thermal conductivity did not have much change. Thus, as the measuring temperature increased, the total thermal conductivity decreased, except for the anomalous point near 400 K, where the phase transition (Cu2Se) occurred. Additionally, above 400 K, the thermal conductivity of Cu2Se0.75Te0.25 and Cu2Se0.7Te0.3 samples decreased while it was almost maintained in the samples with low Te (x = 0.1 and 0.2) with increase in measuring temperature. This phenomenon could be explained via the decrease of the lattice thermal conductivity at the synthetic samples with high amount of Te-doped. In contrast, the slight decrease in thermal conductivity at the lower Te-doped samples was due to the balance between κE and κL. Further, the increase in thermal conductivity with increasing Te content also indicates that the phase transition arising from the formation of the Cu2Te phase contributed to the increasing thermal conductivity. It needs to be stressed that the thermal conductivity of Cu2Te was higher than that of Cu2Se. So, the formation of Cu2Te in samples impacted to the increasing thermal conductivity.
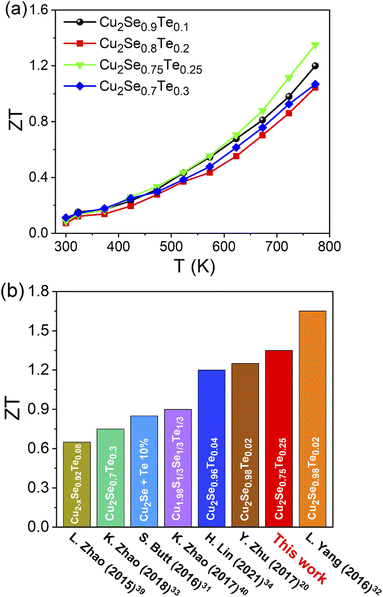
The temperature dependence thermoelectric figure of merit (ZT) of Cu2Se1−xTex (x = 0.1, 0.2, 0.25, and 0.3) was shown in Fig. 6a. The ZT values of all samples were increased with increasing temperature. With the balance of σ, S, and κ values, the highest ZT of ∼1.35 was obtained at Cu2Se0.75Te0.25, which owned the great power factor (9.84 μW cm−1 K−2 at 773 K) and ultra-low thermal conductivity (0.56 W m−1 K−2 at 773 K). At below 800 K, the ZT value in this work is almost higher than those of the pristine p-type Te-doped copper selenide materials in some previous reports under the different Te doping contents and synthetic method (Fig. 6b).20,31–34,39,40 In the Te contents range from x = 0.2 to 0.3, we found that the transition phase point at Te of 0.25 achieved the highest ZT value, compared with other Te contents. K. Zhao et al. investigated the thermoelectric properties of Cu2Se1−xTex (x = 0 to 1) solid solutions and they found the highest ZT value with x = 0.3 but the series of samples of x = 0.25 was missed.33
4. Conclusions
In summary, the Cu2Se1−xTex (x = 0.1, 0.2, 0.25, and 0.3) compounds have been successfully prepared by mechanical alloying combined with a solid-state reaction method. The structural phase transition of Cu2Se1−xTex was observed at Te content of 0.25 which obtained the highest ZT value of 1.35. A phase transition at 400 K from the α → β of all samples has been observed and confirmed using the measured results of electrical and thermal properties. Via the XRD and FE-SEM results, the change in crystal structure and morphology was observed according to Te content. By a more simple synthetic method, the obtained ZT value in this study has higher than that of almost previous study results. More interestingly, the optimization of fabrication parameters of Cu2Se0.75Te0.25 can lead to enhancing the ZT value of this material.Author contributions
T. K. Mac, and T. T. Ta, synthesized the Cu2Se1−xTex samples and performed the electrical conductivity and Seebeck coefficient experiments. V. D. Nguyen measured thermal conductivity, H. T. Nguyen, V. T. Duong, and T. L. H. Pham edited the manuscript and performed FE-SEM experiments. T. D. Thanh performed XRD experiments and edited the manuscript. B. T. Phan edited the manuscript. T. K. Mac wrote the paper with discussion and comments from all the authors. A. T. Duong supervised the project.Conflicts of interest
There are no conflicts to declare.Acknowledgements
The work was supported by the Vietnam National Foundation for Science and Technology Development (NAFOSTED) under Grant number 103.02-2019.354.References
- M. Hamid Elsheikh, D. A. Shnawah, M. F. M. Sabri, S. B. M. Said, M. Haji Hassan, M. B. Ali Bashir and M. Mohamad, Renewable Sustainable Energy Rev., 2014, 30, 337–355 CrossRef.
- D. Rowe and C. Bhandari, CRC Handbook of Thermoelectrics, CRC Press, 2018 Search PubMed.
- G. J. Snyder and E. S. Toberer, Nat. Mater., 2008, 7, 105–114 CrossRef CAS PubMed.
- U. S. Shenoy, K. D. Goutham and D. K. Bhat, J. Alloys Compd., 2022, 921, 165965 CrossRef CAS.
- D. K. Bhat and U. S. Shenoy, Mater. Today Phys., 2019, 11, 100158 CrossRef.
- U. S. Shenoy, K. D. Goutham and D. K. Bhat, Mater. Adv., 2022, 5941–5946 RSC.
- U. S. Shenoy, K. D. Goutham and D. K. Bhat, J. Alloys Compd., 2022, 905, 164146 CrossRef CAS.
- D. K. Bhat and U. S. Shenoy, J. Alloys Compd., 2020, 834, 155181 CrossRef CAS.
- U. S. Shenoy and D. K. Bhat, Energy Adv., 2022, 1, 9–14 RSC.
- D. K. Bhat and U. S. Shenoy, J. Alloys Compd., 2020, 843, 155989 CrossRef CAS.
- U. S. Shenoy and D. K. Bhat, ACS Sustainable Chem. Eng., 2021, 9, 13033–13038 CrossRef CAS.
- S. Shenoy and D. K. Bhat, J. Phys. Chem. C, 2017, 121, 20696–20703 CrossRef CAS.
- H. J. Goldsmid, J. Electron. Mater., 2012, 41, 2126–2129 CrossRef CAS.
- A. T. Duong, V. Q. Nguyen, G. Duvjir, V. T. Duong, S. Kwon, J. Y. Song, J. K. Lee, J. E. Lee, S. Park, T. Min, J. Lee, J. Kim and S. Cho, Nat. Commun., 2016, 7, 1–6 Search PubMed.
- P. Qiu, X. Shi and L. Chen, Energy Storage Mater., 2016, 3, 85–97 CrossRef.
- K. Zhao, P. Qiu, X. Shi and L. Chen, Adv. Funct. Mater., 2020, 30, 1–19 Search PubMed.
- K. Nishikawa, Y. Takeda and T. Motohiro, Appl. Phys. Lett., 2013, 102, 2012–2015 CrossRef.
- S. Q. Bai, I. H. K. Wong, N. Zhang, K. Lin Ke, M. Lin, D. J. Young and T. S. A. Hor, Dalton Trans., 2018, 47, 16292–16298 RSC.
- S. Q. Bai, I. H. K. Wong, M. Lin, D. J. Young and T. S. A. Hor, Dalton Trans., 2018, 47, 5564–5569 RSC.
- Y. Bin Zhu, B. P. Zhang and Y. Liu, Phys. Chem. Chem. Phys., 2017, 19, 27664–27669 RSC.
- K. Tyagi, B. Gahtori, S. Bathula, S. Auluck and A. Dhar, Appl. Phys. Lett., 2014, 105, 16–21 Search PubMed.
- T. Hu, Y. Yan, S. Wang, X. Su, W. Liu, G. Tan, P. Poudeu-Poudeu and X. Tang, RSC Adv., 2019, 9, 10508–10519 RSC.
- Y. Jin, J. Hwang, S. Kim, J. Kim and S. J. Kim, Nanoscale Adv., 2021, 3, 3107–3113 RSC.
- D. L. Shi, Z. M. Geng, L. Shi, Y. Li and K. H. Lam, J. Mater. Chem. C, 2020, 8, 10221–10228 RSC.
- J. Lei, Z. Ma, D. Zhang, Y. Chen, C. Wang, X. Yang, Z. Cheng and Y. Wang, J. Mater. Chem. A, 2019, 7, 7006–7014 RSC.
- L. Yang, Z. G. Chen, G. Han, M. Hong and J. Zou, Acta Mater., 2016, 113, 140–146 CrossRef CAS.
- A. A. Olvera, N. A. Moroz, P. Sahoo, P. Ren, T. P. Bailey, A. A. Page, C. Uher and P. F. P. Poudeu, Energy Environ. Sci., 2017, 10, 1668–1676 RSC.
- B. Zhong, Y. Zhang, W. Li, Z. Chen, J. Cui, Y. Xie, Q. Hao and Q. He, Appl. Phys. Lett., 2014, 105, 1–4 Search PubMed.
- Z. Zhu, Y. Zhang, H. Song and X. J. Li, Appl. Phys. A: Mater. Sci. Process., 2018, 124, 747 CrossRef CAS.
- Q. Hu, Z. Zhu, Y. Zhang, X. J. Li, H. Song and Y. Zhang, J. Mater. Chem. A, 2018, 6, 23417–23424 RSC.
- S. Butt, W. Xu, M. U. Farooq, G. K. Ren, Q. Zhang, Y. Zhu, S. U. Khan, L. Liu, M. Yu, F. Mohmed, Y. Lin and C. W. Nan, ACS Appl. Mater. Interfaces, 2016, 8, 15196–15204 CrossRef CAS PubMed.
- L. Yang, Z. G. Chen, G. Han, M. Hong, L. Huang and J. Zou, J. Mater. Chem. A, 2016, 4, 9213–9219 RSC.
- K. Zhao, M. Guan, P. Qiu, A. B. Blichfeld, E. Eikeland, C. Zhu, D. Ren, F. Xu, B. B. Iversen, X. Shi and L. Chen, J. Mater. Chem. A, 2018, 6, 6977–6986 RSC.
- F. H. Lin and C. J. Liu, ChemSusChem, 2021, 14, 1316–1323 CrossRef CAS PubMed.
- H. Liu, X. Shi, M. Kirkham, H. Wang, Q. Li, C. Uher, W. Zhang and L. Chen, Mater. Lett., 2013, 93, 121–124 CrossRef CAS.
- A. L. N. Stevels and F. Jellinek, Recl. Trav. Chim. Pays-Bas, 1971, 90, 273–283 CrossRef CAS.
- S. Ballikaya, H. Chi, J. R. Salvador and C. Uher, J. Mater. Chem. A, 2013, 1, 12478 RSC.
- Y. Qin, L. Yang, J. Wei, S. Yang, M. Zhang, X. Wang and F. Yang, Materials, 2020, 13, 5704 CrossRef CAS PubMed.
- L. Zhao, X. Wang, F. F. Yun, J. Wang, Z. Cheng, S. Dou, J. Wang and G. J. Snyder, Adv. Electron. Mater., 2015, 1400015 CrossRef.
- K. Zhao, C. Zhu, P. Qiu, A. B. Blichfeld, E. Eikeland, D. Ren, B. B. Iversen, F. Xu, X. Shi and L. Chen, Nano Energy, 2017, 42, 43–50 CrossRef CAS.
| This journal is © The Royal Society of Chemistry 2022 |

