
 Open Access Article
 This Open Access Article is licensed under a Creative Commons Attribution-Non Commercial 3.0 Unported Licence
Tetrabutylammonium bromide-based hydrophobic deep eutectic solvent for the extraction and separation of dihydromyricetin from vine tea and its inhibitory efficiency against xanthine oxidase
Liling Wang a,
Yanbin Wanga,
Meixu Chenb,
Yaoyao Zhub,
Yuchuan Qina and
Yifeng Zhou*b
a,
Yanbin Wanga,
Meixu Chenb,
Yaoyao Zhub,
Yuchuan Qina and
Yifeng Zhou*b
aThe Key Laboratory of Biochemical Utilization of Zhejiang Province, Zhejiang Academy of Forestry, Hangzhou 310023, China
bSchool of Biological and Chemical Engineering, Zhejiang University of Science and Technology, Hangzhou 310023, China. E-mail: zhouyf3000@163.com
First published on 7th October 2022
Abstract
In this study, deep eutectic solvent oscillation-assisted extraction (DES-OS) combined with macroporous resin adsorption and desorption technology was used to achieve the rapid green extraction and separation of the characteristic component dihydromyricetin (DMY) from vine tea. Multivariate data analysis showed that the DES system composed of tetrabutylammonium bromide (N444Br) and pyruvic acid (molar ratio 1![[thin space (1/6-em)]](https://www.rsc.org/images/entities/char_2009.gif) :2) had good extraction performance for DMY. The influence parameters of DES-OS were studied, and optimized by the single-factor test and response surface methodology (RSM) with Box–Behnken design (BBD). The extraction model of DMY was established and verified. The results showed that the extraction yield of DMY could reach 40.1 mg g−1 under the optimal conditions (DES water contents of 71.18%, extraction time of 2.80 h, extraction temperature of 46.40 °C), which is in good agreement with the predicted value. In addition, Fourier transform infrared spectroscopy (FT-IR) was used to characterize the solvent before and after extraction. Scanning electron microscopy (SEM) results further confirmed that tetrabutylammonium bromide:pyruvate enhanced the destruction of the cell wall structure, resulting in the release of more DMY. Furthermore, different macroporous resins were selected for the separation of DMY for the DES-OS extract, and it was found that the DM301 resin had the ideal recovery performance under optimized dynamic condition. Finally, the product was found to have an inhibitory effect against xanthine oxidase (XO) as a mixed-type competitive inhibitor with IC50 values of (5.79 ± 0.22) × 10−5 mol L−1. The inhibitory mechanisms of DMY on XO were explored by enzyme kinetics, spectroscopy, molecular docking and molecular dynamics analysis approaches, which provided a theoretical basis for the above inhibition assays.
:2) had good extraction performance for DMY. The influence parameters of DES-OS were studied, and optimized by the single-factor test and response surface methodology (RSM) with Box–Behnken design (BBD). The extraction model of DMY was established and verified. The results showed that the extraction yield of DMY could reach 40.1 mg g−1 under the optimal conditions (DES water contents of 71.18%, extraction time of 2.80 h, extraction temperature of 46.40 °C), which is in good agreement with the predicted value. In addition, Fourier transform infrared spectroscopy (FT-IR) was used to characterize the solvent before and after extraction. Scanning electron microscopy (SEM) results further confirmed that tetrabutylammonium bromide:pyruvate enhanced the destruction of the cell wall structure, resulting in the release of more DMY. Furthermore, different macroporous resins were selected for the separation of DMY for the DES-OS extract, and it was found that the DM301 resin had the ideal recovery performance under optimized dynamic condition. Finally, the product was found to have an inhibitory effect against xanthine oxidase (XO) as a mixed-type competitive inhibitor with IC50 values of (5.79 ± 0.22) × 10−5 mol L−1. The inhibitory mechanisms of DMY on XO were explored by enzyme kinetics, spectroscopy, molecular docking and molecular dynamics analysis approaches, which provided a theoretical basis for the above inhibition assays.
1 Introduction
Dihydromyricetin (3,5,7,3′,4′,5′-hexahydroxy-2,3-dihydroflavanol, DMY), also known as ampelopsin, is an important and major flavonoid with the highest content (over 30%) found in Ampelopsis grossedentata.1 DMY belongs to dihydroflavonoids, and has a variety of pharmacological activities, such as anti-inflammatory, cough relief, analgesia, anti-hypertension, lipid-reducing, liver protection, alcohol intoxication relief, and anti-tumor.2–4 Like many bioactive compounds,5 DMY is a hydrophobic compound, and it is almost insoluble in water (only 0.2 mg mL−1 at 25 °C and 0.9 mg mL−1 at 37 °C).6 Extraction of active ingredients is an important step in the development and quality control of Chinese herbal medicine products. At present, many extraction methods (mainly including water extraction, organic solvent extraction, acid extraction, alkaline extraction, and enzyme extraction) have been used to extract flavonoids from vine tea. Among them, methanol is the most frequently selected extraction solvent,7 which can cause serious environmental pollution and safety problems.In recent years, with the proposal of the concept of “green chemistry”, various green solvents such as ionic liquid (IL) and deep eutectic solvents (DES) have attracted considerable attention in the extraction of plant natural products. Compared with ILs, DESs have been favored by researchers due to their simple preparation, low price, excellent biodegradability, sustainability and low toxicity. Furthermore, they have excellent properties of traditional ionic liquids, such as good solubility, high stability and low volatility. DES is usually composed of hydrogen bond acceptors (HBAs, such as quaternary ammonium salts) and hydrogen bond donors (HBDs, such as amides, polyols, carboxylic acids, and others) according to a certain stoichiometric ratio of two or three low eutectic components, and its freezing point is significantly lower than that of the pure substance of each component. At present, DESs have been widely used in many chemical fields, such as chemical synthesis, electrochemistry, nanomaterials, biochemistry, separation process and chemical analysis.8–10 For natural active compounds, traditional extraction methods usually rely on the high consumption of organic solvents and the increase of the extraction time. As a new kind of solvent, the emergence of DES is just in line with the purpose of establishing an environmentally friendly extraction and separation method. At present, DES has attracted extensive attention because its physical and chemical properties are close to those of ionic liquids. However, DES is cheaper, safer and easier to prepare than ionic liquids. DES in the extraction and separation of natural active compounds is still in its initial stage. So far, the natural DES has been applied to the extraction of essential oils,11 and phenolic,12 flavonoid,13,14 anthracene,15 and hop compounds.16 In the future, there will be increasingly more research on extraction and separation processes with DES, which will be also very meaningful.17
Gout is a series of diseases caused by long-term purine metabolism disorder or abnormal uric acid excretion in organisms, and the abnormal increase of xanthine oxidase (XO) activity is the main factor to induce such diseases.18,19 Therefore, enzyme inhibitors have been widely studied as effective drugs for the treatment of these diseases. In recent years, more studies have shown that natural plant active ingredients exhibit good inhibition of XO, such as kaempferol,20 luteolin,21 and others. Many studies have shown that flavonoids can inhibit XO activity, with the C-5 and C-7 hydroxyl groups of the flavonoids playing an important role in the inhibition.22 DMY (3′,4′,5,7-tetrahydroxy flavonoids) is also a flavonoid containing hydrogen bonds, and also contains C-5 and C-7 hydroxyl structures in the A ring. Literature has reported that DMY has an inhibitory effect on gout,23 but the mechanism of DMY's efficacy and the molecular mechanism of inhibiting the activity of XO have been rarely reported. Moreover, DMY has the advantage of low toxicity and side effects, which provides a realistic value for the study of the mechanism of DMY inhibiting XO. It also provides favorable conditions for the research and development of new drugs, and a deeper understanding of the pharmacological mechanism.
In consideration of the notable attributes of DES, herein, we adopted a series of DESs as a simple sample extractant for vine tea coupled with macroporous resin for further separation. The main parameters affecting the extraction procedure and the adsorption of macroporous resin were investigated and optimized. The method was successfully applied to DMY extraction and separation. Moreover, the effects of DMY against XO and their structure–activity relationships, with the assistance of computational chemistry, were evaluated. Through this work, hydrophobic deep eutectic solvents may be applied for the efficient extraction of DMY and other related compounds, owing to its environment-friendly and green processing behavior.
2 Materials and methods
2.1 Chemicals and materials
Vine tea was purchased from farms in Zhangjiajie, Hunan, China. The materials were ground and sieved (40 mesh). The powders were stored in a desiccator until further use. DL-menthol (purity 95%), thymol crystals (purity 98%), tetrabutylammonium bromide (N4444Br; purity 97%), acetic acid (purity 99.7%), butyric acid (purity 98%), hexanoic acid (purity 98%), octanoic acid (purity 98%), decanoic acid (purity 98%), dodecanoic acid (purity > 98%), pyruvic acid (purity 98%), levulinic acid (purity 99%), and allopurinol standard (purity > 98%) were purchased from Shanghai Aladdin Chemical Co. LTD, China. For HPLC analysis, DMY standard (purity > 98%) and formic acid (HPLC grade) were purchased from Shanghai Aladdin Chemical Co. LTD, China, and methanol (HPLC grade, ≥99.9%) was purchased from Tedia Company, Fairfield, OH, USA.2.2 Preparation of DESs
DESs were prepared using menthol, thymol or tetrabutylammonium bromide (N444Br) as the hydrogen bond acceptors (HBAs) and various long chain acids as the hydrogen bond donors (HBDs), as stated in Table 1. Preparation of DESs was performed by the heating and stirring approach, as described by Wu et al.24 Briefly, different HBAs and HBDs at a suitable molar ratio were weighed, mixed in air-tight reagent bottles, and stirred at 80 °C until a homogeneous and stable liquid was formed. Afterwards, the obtained liquid was then kept overnight at 30 °C.25| No. | Solvent abbreviation | Hydrogen bond acceptor (HBA) | Hydrogen bond donor (HBD) | Molar ratio | DMY yield ± SD (mg per g DW of vine tea) |
|---|---|---|---|---|---|
| 1 | MAA | DL-menthol | Acetic acid | 1:1 |
124.95 ± 0.78 |
| 2 | MLA | DL-menthol | Levulinic acid | 1:1 |
304.61 ± 0.54 |
| 3 | MPA | DL-menthol | Pyruvic acid | 1:2 |
103.73 ± 0.94 |
| 4 | MBA | DL-menthol | Butyric acid | 1:1 |
146.35 ± 0.25 |
| 5 | MHA | DL-menthol | Hexanoic acid | 1:1 |
83.38 ± 0.19 |
| 6 | MOA | DL-menthol | n-Octanoic acid | 1:1 |
64.76 ± 0.34 |
| 7 | MDA | DL-menthol | Decanoic acid | 2:1 |
74.62 ± 0.71 |
| 8 | NAA1 | N4444Br | Acetic acid | 1:2 |
203.65 ± 0.12 |
| 9 | NAA2 | N4444Br | Acetic acid | 1:3 |
314.46 ± 0.87 |
| 10 | NBA1 | N4444Br | Butyric acid | 1:1 |
202.64 ± 1.01 |
| 11 | NBA2 | N4444Br | Butyric acid | 1:2 |
36.36 ± 0.92 |
| 12 | NPA | N4444Br | Pyruvic acid | 1:2 |
388.49 ± 1.21 |
| 13 | NLA | N4444Br | Levulinic acid | 1:2 |
78.31 ± 0.96 |
| 14 | NHA | N4444Br | Hexanoic acid | 1:2 |
297.19 ± 1.12 |
| 15 | NOA | N4444Br | n-Octanoic acid | 1:2 |
77.96 ± 0.53 |
| 16 | NDA | N4444Br | Decanoic acid | 2:1 |
93.94 ± 0.98 |
| 18 | TDA1 | Thymol | Decanoic acid | 3:2 |
9.30 ± 0.13 |
| 19 | TDA2 | Thymol | Decanoic acid | 1:1 |
5.33 ± 0.32 |
| 20 | TDA3 | Thymol | Decanoic acid | 1:3 |
2.30 ± 0.09 |
| 21 | TDA3 | Thymol | Decanoic acid | 1:2 |
2.13 ± 0.07 |
| 22 | TOA | Thymol | n-Octanoic acid | 1:1 |
4.64 ± 0.34 |
| 23 | TLA | Thymol | Lauric acid | 1.5:1 |
8.15 ± 0.22 |
| 24 | THA | Thymol | Hexanoic acid | 1:1 |
5.93 ± 0.19 |
| 25 | TBA | Thymol | Butyric acid | 1:1 |
9.67 ± 0.65 |
| 26 | TPA | Thymol | Pyruvic acid | 1:1 |
79.54 ± 0.78 |
| 27 | TLA | Thymol | Levulinic acid | 1:1 |
251.18 ± 1.92 |
| 29 | TUA1 | Thymol | Undecylenic acid | 7:3 |
13.03 ± 0.21 |
| 30 | TUA2 | Thymol | Undecylenic acid | 3:2 |
11.94 ± 0.59 |
| 31 | TUA3 | Thymol | Undecylenic acid | 1:1 |
6.24 ± 0.38 |
| 32 | TUA4 | Thymol | Undecylenic acid | 1:2 |
3.54 ± 0.21 |
| 33 | TUA5 | Thymol | Undecylenic acid | 1:3 |
3.32 ± 0.09 |
| 34 | TUA6 | Thymol | Undecylenic acid | 1:4 |
5.63 ± 0.11 |
2.3 Extraction of DMY from vine tea
For the initial selection of the best DES, 1 g of the dried vine tea powder was mixed with 10 mL of different DESs. The mixture was shaken at 200 rpm, 30 °C for 3 h. Then, the mixtures were centrifuged at 10000 rpm for 10 min at 25 °C for collecting the supernatant. Finally, 10 μL of the supernatant was diluted to 1 mL with methanol, and filtered through a 0.22 μm microporous nylon membrane for quantitative analysis by HPLC.
2.4 HPLC analysis of DMY
DMY was analyzed according to a previous method.1 In detail, a high-performance liquid chromatography Series with a Shimadzu LC-20AD separations module, a SIL-20A autosampler, a CTO-20A column oven, and a SPD-20A UV/vis detector (Shimadzu Corporation, Japan) were used for the DMY analysis. The chromatographic separation was carried out on a Shimadzu WondaCract C18 chromatographic column (4.6 mm × 250 mm, 5 μm) at a column temperature of 35 °C. A mixture of methanol-0.1% formic acid/water (30:70 v/v) was used as the mobile phase and the flow rate was 1.0 mL min−1. The detection wavelength was recorded at 292 nm, and the sample injection volume was set at 10 μL. The retention time of DMY was about 10.5 min in standard and sample solutions. The contents of DMY were calculated based on the calibration curves established with the following regression equation, y = 29696x − 13838 (R2 = 0.9999), within the test ranges of 50–400 μg mL−1, where y and x were its concentration (g mL−1) and the value of the peak area, respectively. The extraction yield (%) was calculated with the contents of DMY divided by the dry weight of the vine tea sample.
2.5 Optimization of the DES extract by single factor tests and response surface methodology (RSM)
Firstly, the extraction yields of DMY were studied through a series of single factor tests with the important extraction parameters, including water concentration (10%, 20%, 30%, 40%, 50%, 60%, 70%, 80%, and 90% v/v), shaken time (0.5, 1, 1.5, 2, 2.5, 3 and 3.5 h), liquid–solid ratios (5, 10, 20, 30, 40 and 50 mL g−1) and temperature (30, 35, 40, 45, 50, 55 and 60 °C). According to the above single factor experimental results, a Box–Behnken design (BBD) based on RSM was applied for the optimization of the extraction conditions with the Design-Expert 8.0.6 Trail software (Stat-Ease, Minneapolis, MN, USA). The chosen key factor boundaries of the water contents (A), extraction temperature (B), and extraction time (C) are listed in Table 2, while the liquid–solid ratio was fixed at 20 mL g−1. The experiments were performed in random order to avoid systematic errors.| Run | A: Water (%) | B: Temperature (°C) | C: Time (h) | Exp. (%) | Pred. (%) |
|---|---|---|---|---|---|
| 1 | 70(0) | 35(−1) | 3(1) | 37.57 | 37.37 |
| 2 | 60(−1) | 55(1) | 2.5(0) | 33.13 | 33.23 |
| 3 | 70(0) | 45(0) | 2.5(0) | 39.00 | 39.63 |
| 4 | 70(0) | 45(0) | 2.5(0) | 39.64 | 39.63 |
| 5 | 70(0) | 45(0) | 2.5(0) | 40.00 | 39.63 |
| 6 | 60(0) | 45(0) | 2(-1) | 35.27 | 34.97 |
| 7 | 70(0) | 55(1) | 3(1) | 39.06 | 39.01 |
| 8 | 70(0) | 35(−1) | 2(−1) | 38.88 | 38.93 |
| 9 | 80(1) | 45(0) | 3(1) | 37.15 | 37.45 |
| 10 | 70(0) | 45(0) | 2.5(0) | 39.40 | 39.63 |
| 11 | 80 | 55(1) | 2.5(0) | 37.32 | 37.07 |
| 12 | 70(0) | 45(0) | 2.5(0) | 40.09 | 39.63 |
| 13 | 70(0) | 55(1) | 2(−1) | 34.49 | 34.69 |
| 14 | 80(1) | 35(−1) | 2.5(0) | 35.74 | 35.64 |
| 15 | 80(1) | 45(0) | 2(−1) | 36.63 | 36.68 |
| 16 | 60(−1) | 35(−1) | 2.5(0) | 37.02 | 37.27 |
| 17 | 60(−1) | 45(0) | 3(1) | 36.99 | 36.94 |
2.6 Enrichment of DMY from the DES extraction solution of vine tea
Before the separation experiments, all of the macroporous resins were pretreated according to our previous reference method.26 The resins (0.5 g) were accurately weighed and placed into a 5 mL disposable syringe, and eluted with 10 mL deionized water. Then, 1 mL of vine tea DES extraction solution was added to adsorb on the resins overnight. Subsequently, the resins were washed with sufficient deionized water (25 mL), and then eluted with 25 mL of 95% aqueous ethanol (v/v). The ethanolic fraction was collected, and the DMY concentration was determined by HPLC as described in section 2.4. The solution was diluted, and the recoveries of DMY were calculated and compared.2.7 FT-IR and SEM analysis
The functional groups of the extraction solvents and their corresponding extracts were analyzed by FT-IR spectroscopy (Thermo Nicolet is10). After extraction, all sample residues were washed with water three times, and then dried in an oven at 50 °C until a constant weight was achieved. The dried vine tea residue powders before and after extraction were separately fixed on aluminum stabs with a thin gold layer. The microscopic structure was observed by a scanning electron microscope (SEM) (Hitachi S-3400W, Tokyo, Japan).2.8 Assays for XO activity in vitro
| Relative enzyme activity (%) = (K/K0) × 100% | (1) |
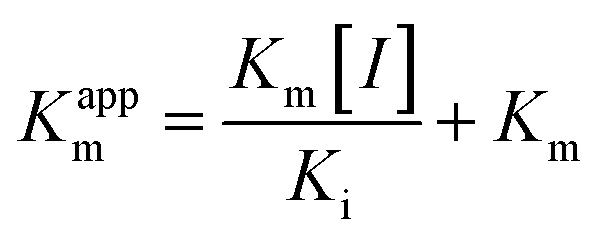
In the same way, the concentration of XO was fixed at 0.025 U mL−1, and the ΔOD293 of the reaction systems containing different concentrations of DMY were determined with the increase of the substrate concentration. According to the Lineweaver–Burk relationship in the double reciprocal form eqn (2), the competitive inhibition mechanism was analyzed and the inhibitory constants were calculated:
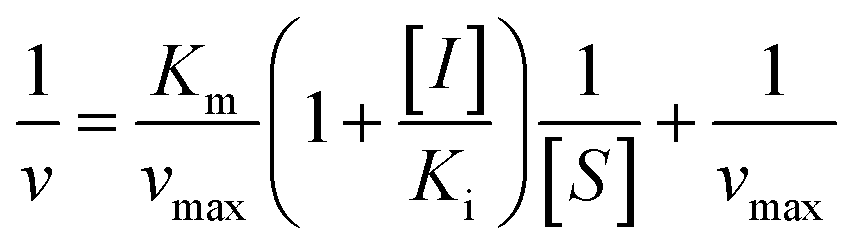 | (2) |
 | (3) |
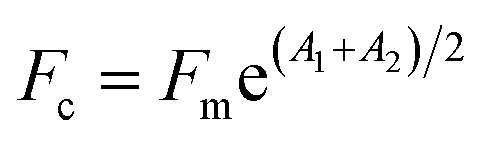
In order to remove the interference of the UV absorption of DMY on the fluorescence intensity of XO, the fluorescence value was corrected by the following equation:27
 | (4) |
000 steps (including 5000 steps of fastest descent method and 5000 steps of conjugate gradient method). Then, the system was slowly heated to 300 K in 50 ps. After heating, the system was balanced at 50 ps under the NPT assembly. Finally, the 100 ns molecular dynamics simulation was carried out in the NPT assembly with a time step of 2 fs. Finally, some system properties, such as the root mean square deviation (RMSD), radius of gyration (Rog), root mean square fluctuation (RMSF) and solvent accessible surface area (SASA), were obtained from the trajectory file analysis.3 Results and discussion
3.1 Initial screening of the DES
Many studies have shown that the physicochemical properties of DES had a great influence on the extraction rate of flavonoids from natural plants.29,30 In this work, in order to screen out the most effective DES, 32 types of menthol, thymol and N444Br -based DES were analyzed for the DMY extraction yield (Table 1). According to the principle of “like dissolves like”, DMY is hydrophobic,31 so a hydrophobic hydrogen bond receptor was selected. Theoretically, the increased hydrophobicity of menthol, thymol and N444Br-based DES could obtain higher yields of DMY. However, we observed that the yield of DMY was generally low in DES with thymol as the hydrogen bond receptor (Table 1), which may be due to the lower viscosity of thymol-based DESs in comparison with N444Br-based DESs and DL-menthol-based DESs. This property does not lead to a strong damage effect in plant cells, resulting in the difficult release of active substances. The results showed that, compared with other DES, N444Br-pyruvic acid (PA) DES had the largest extraction yield of DMY (388.49 mg g−1 DW vine tea). Therefore, DES can be used as an ideal substitute for an organic solvent to extract DMY from vine tea. The high extraction efficiency is attributed to the hydrophobic properties of DES, which can damage plant cell membranes. This is in line with the known mechanism of cell damage by organic solvents. According to the above experimental results, N444Br-PA was selected as the best extractant for subsequent experiments.3.2 Single-factor experiments
In order to evaluate the effect of single factors on the DMY extraction yield and explore the suitable range of each variable, a series of single factor design experiments were conducted. In general, the water contents in DES are a key factor in the mass energy transfer.32 When fixing other variables (liquid–solid ratio of 10 mL g−1, extraction time of 2 hours, and shaker temperature of 30 °C), the DMY contents were measured by changing the water contents of DES (0%, 10%, 20%, 30%, 40%, 50%, 60%, 70, 80%, and 90%). The yield of DMY reached the maximum when the water contents were 70%, and then decreased with increasing water contents at 80% (Fig. 1a). Therefore, the N444Br-based DES water contents were set to range from 60 to 80% (Fig. 2a). Previous studies have demonstrated that the water contents in DES may be used for tuning and controlling their properties, but maintaining properties and features.33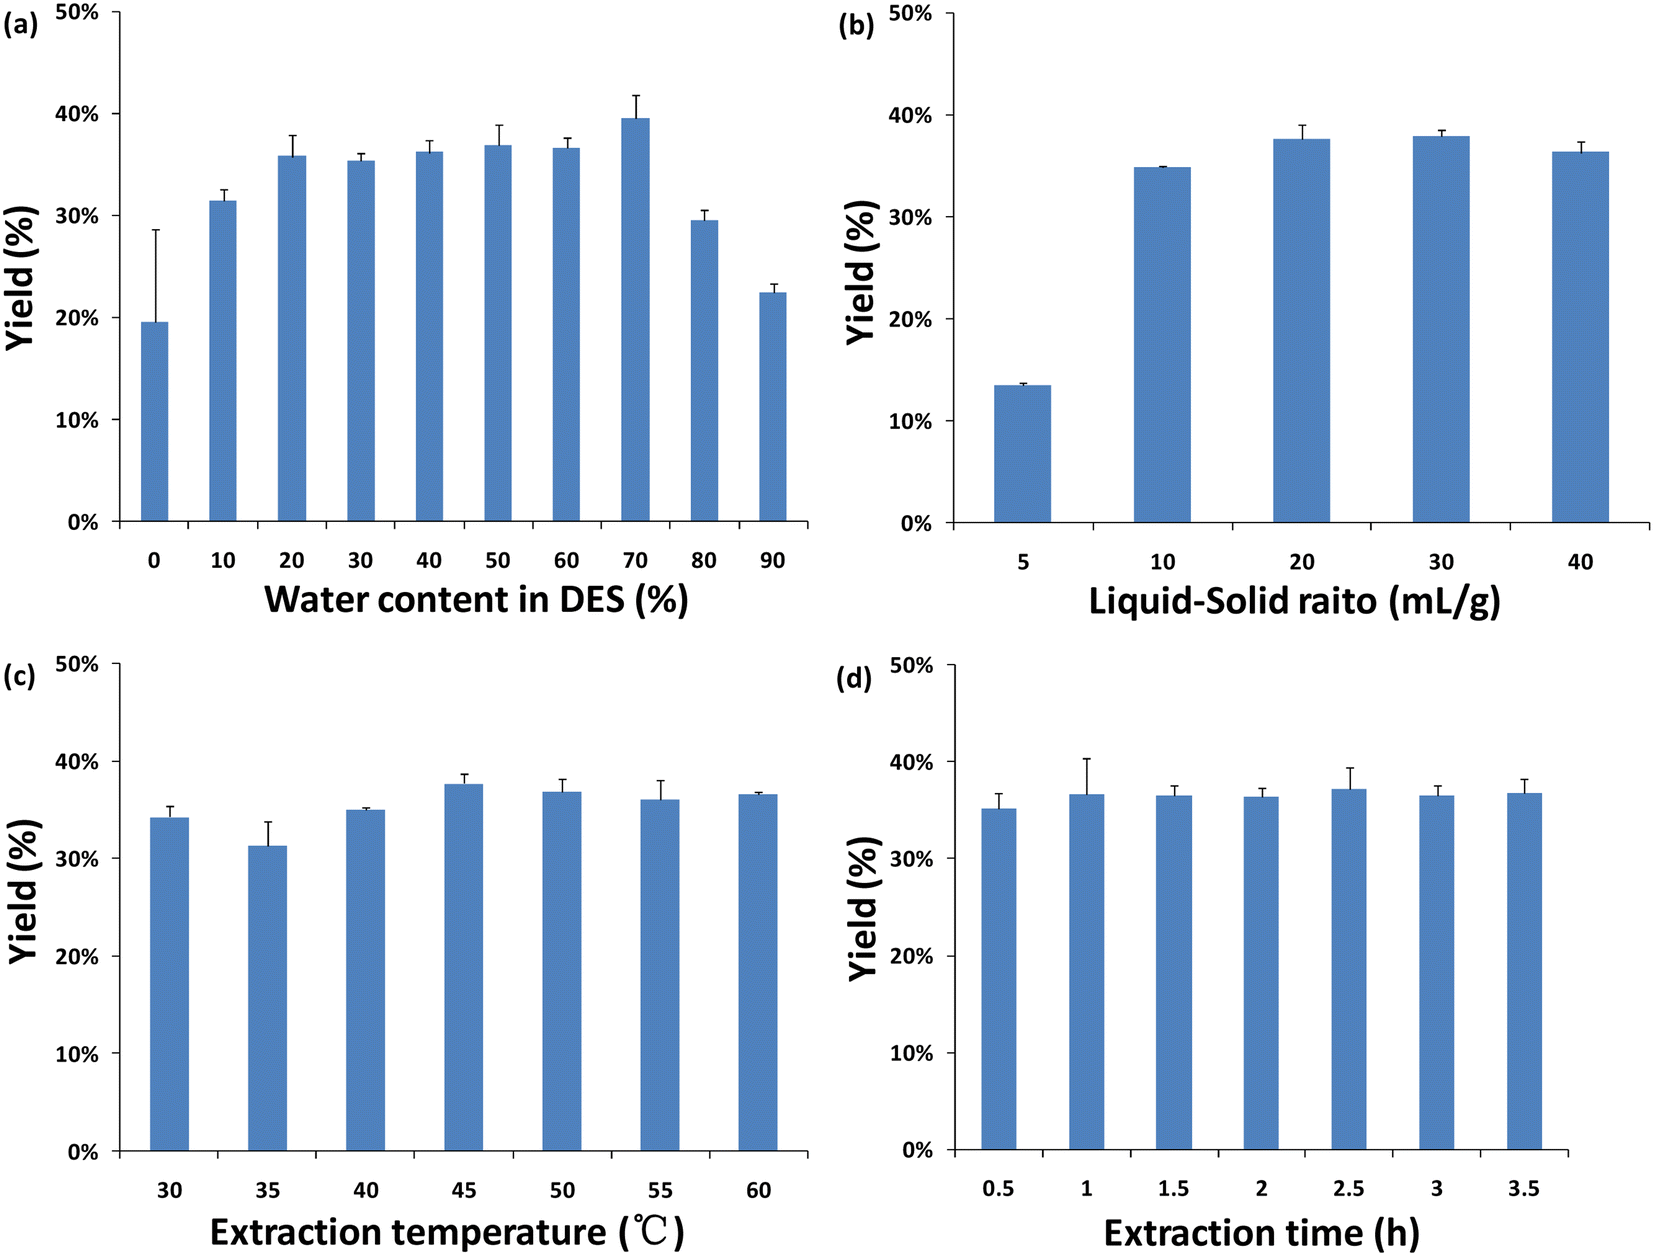 | ||
| Fig. 1 The results of the single-factor experiment for DMY extraction from vine tea: water content in DES (a), liquid–solid ratio (b), extraction temperature (c), and extraction time (d) (n = 3). | ||
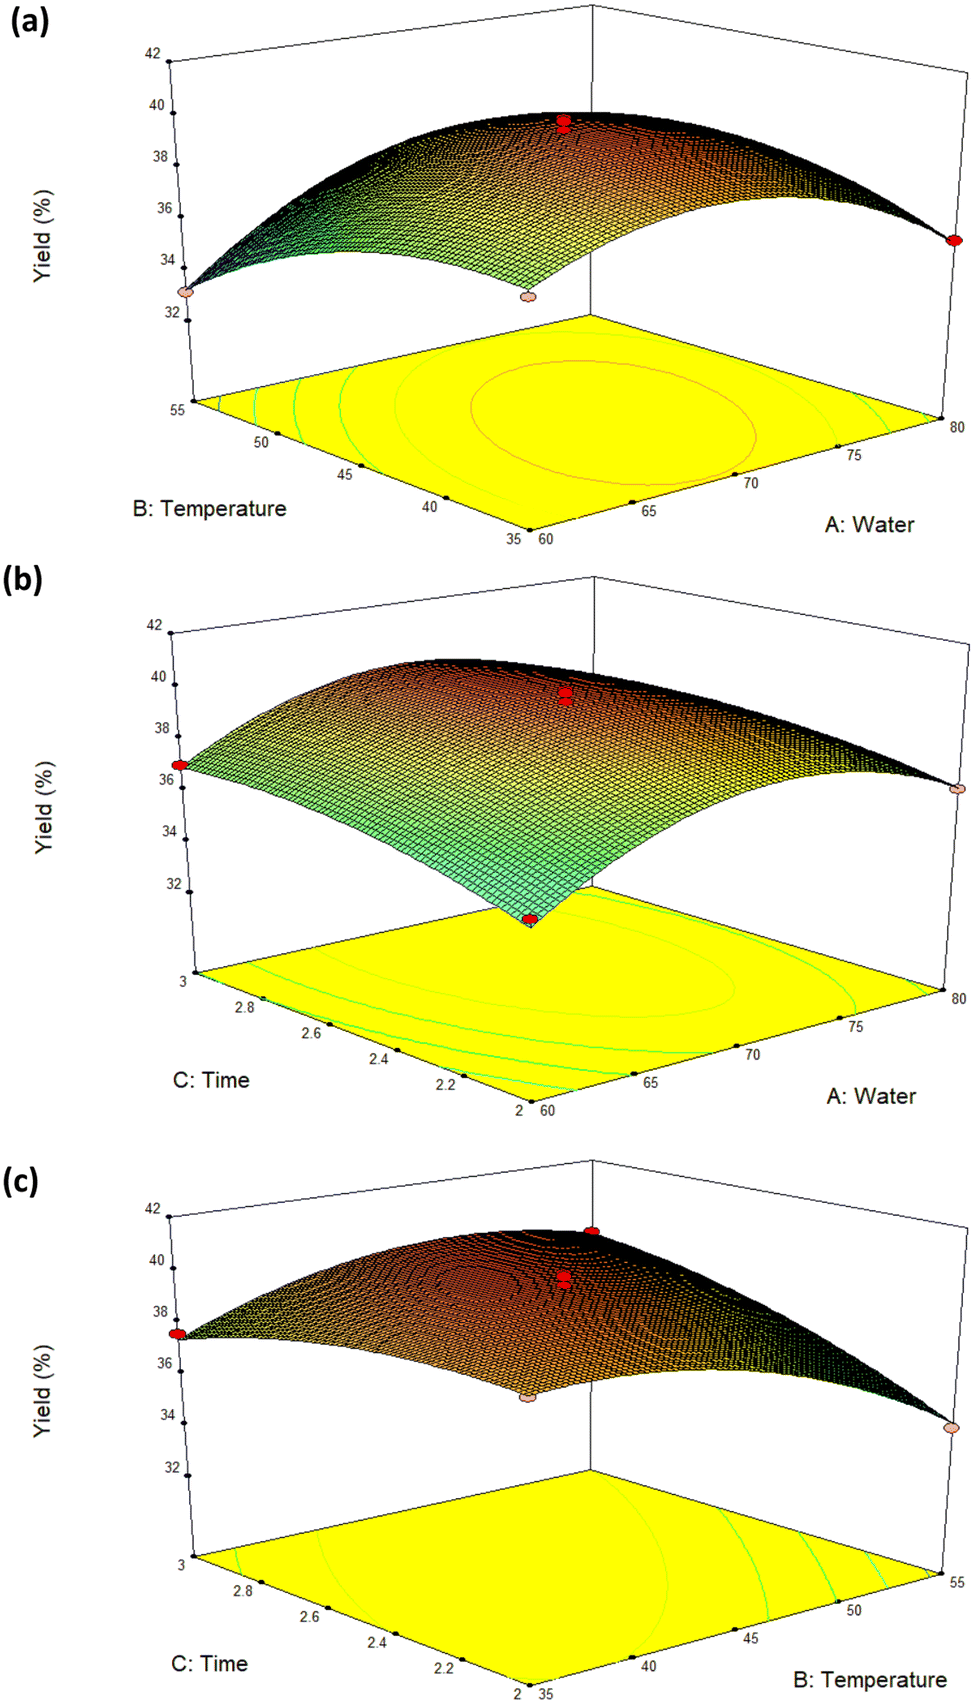 | ||
| Fig. 2 Response surface plots showing the effects of variables on the yield. | ||
The ratio of liquid to solid is also an important factor in extraction, which is related to the transfer of the mass and energy in the extraction process. The yield of DMY was determined by changing the liquid–solid ratio (10, 20, 30, 40 and 50 mL g−1) and fixing other variables (N444Br-PA water contents fixed at 70%, shaking time and temperature fixed at 2 h and 30 °C, respectively). It can be found from Fig. 1b that when the liquid–solid ratio reaches 20 mL g−1, the yield of DMY reaches a plateau. Furthermore, with the increase of the liquid–solid ratio, the extraction performance will not be further improved. Therefore, we fixed the liquid–solid ratio of 20 mL g−1 in the subsequent experiments from the perspective of the solvent usage and energy saving.
Besides the water contents of DES and the liquid–solid ratio, the extraction temperature is also a factor to consider. The DMY yield was measured by changing the temperature of the shaker (30, 35, 40, 45, 50, 55 and 60 °C), and fixing the other variables of the water contents of DES, extraction time and liquid–solid ratio at 70%, 2 hours and 20 mL g−1, respectively. The results showed that the extraction yield increased gradually with the increase of the extraction temperature (Fig. 1c), and reached the highest value when the extraction temperature reached 45 °C. Afterwards, the extraction yield decreased slightly with the temperature continuing to increase. It was possible that the increase of the extraction temperature would cause other reactions between the dissolved substances at the same time, so the extraction temperature range was set from 35 to 55 °C.
Finally, the extraction time on the extraction efficiency was also studied. The DMY yield was measured by changing the shaker time (0.5, 1, 1.5, 2, 2.5, 3 and 3.5 h), while other variables (extraction temperature, liquid–solid ratio and DES water contents) were fixed at 45 °C, 20 mL g−1, and 70%, respectively. It was found that a sufficient extraction yield could be achieved within 3 h without any auxiliary extraction means (see Fig. 1d). Therefore, the range of time in DES for RSM was set from 2 to 3 h.
3.3 Model fitting and RSM analysis
According to the single-factor test results, a total of 17 test sites (including 3 factors and 3 levels) were optimized by BBD on RSM, among which 14 were factorial tests and 5 were central point tests. Three factors, namely water contents (A), temperature (B), and time (C), were taken as independent variables, and the yield of DMY was taken as the response value. The experimental design and results are shown in Table 2. The experimental values of DMY ranged from 34.49–40.09 (mg g−1 DW), indicating that the optimization of the extraction parameters was of great significance to obtain the maximum extraction yield of DMY.The coefficient R2 = 0.9814 implied an excellent fitting correlation between the model and the experiment values, and most of the variabilities were explained. The variance analysis of the RSM model is shown in Table 3. The F-value indicates the significance of each controlled factor on the tested model.34,35 High F-values and very low p-values for the responses indicate the significance of each controlled factor on the tested model.7,36 The F-value obtained from the model is 41.1, whereas the p-value was found to be p < 0.0001, which verified the effectiveness of the suggested model in the prediction and optimization of the extraction parameters.37 Furthermore, the method was verified by predictive analysis. It was found that the experimental values were within the confidence interval and the standard error of prediction was small, which demonstrated the accuracy of the model again. In addition, from Table 3, it could be observed that the DMY yield was primarily affected by A, B, C, AB, BC A2, B2 and C2. The linear effects of A, B, C, interaction effects of AB and BC, and the quadratic effects of A2 and B2 were highly significant on the DMY yields (p < 0.01).
| Source | Sum of squares | df | Mean square | F value | p-value prob > F |
|---|---|---|---|---|---|
| Model | 64.16 | 9 | 7.13 | 41.1 | < 0.0001 |
| A-water | 2.45 | 1 | 2.45 | 14.14 | 0.0071 |
| B-temperature | 3.39 | 1 | 3.39 | 19.56 | 0.0031 |
| C-time | 3.78 | 1 | 3.78 | 21.8 | 0.0023 |
| AB | 7.48 | 1 | 7.48 | 43.12 | 0.0003 |
| AC | 0.36 | 1 | 0.36 | 2.08 | 0.1929 |
| BC | 8.64 | 1 | 8.64 | 49.83 | 0.0002 |
| A2 | 24.39 | 1 | 24.39 | 140.62 | < 0.0001 |
| B2 | 8.45 | 1 | 8.45 | 48.73 | 0.0002 |
| C2 | 2.12 | 1 | 2.12 | 12.21 | 0.0101 |
| Residual | 1.21 | 7 | 0.17 | ||
| Lack of fit | 0.42 | 3 | 0.14 | 0.69 | 0.6028 |
| Pure error | 0.8 | 4 | 0.2 | ||
| Cor total | 65.37 | 16 |
The regression equation of the response values was obtained as follows:
| Y = 2.960A − 0.482B + 6.531C + 0.014AB − 0.060AC + 0.294BC − 0.024A2 − 0.014B2 − 2.837C2 − 63.463 | (5) |
A three-dimensional response surface diagram (as shown in Fig. 2a–c) can be used to illustrate the impact of the interactions of the extraction factors on the DMY extraction yield. When the slope of the curve is gentle, it indicates that the interaction has little influence on the response value. When the surface slope is steep, this interaction has a great influence on the response value. Therefore, a significant interaction effect (p = 0.0003) between the water contents in DES and temperature (AB) on the DMY yield can be seen (Fig. 2a). In addition, the temperature and time (BC) exhibited an evident interaction effect (p = 0.0002) on the DMY yield (Fig. 2c).
Moreover, it could be observed that the water contents of DES (A) and temperature (B) showed a positive impact on the yield response within the initial range, which was consistent with the results of previous studies.38 Adequate water contents in DES enhanced the mass and energy transfer by decreasing the viscosity of DES, and also increased the yields of the active compounds.39 Meanwhile, the higher temperature increased the yield by accelerating the movement of molecules in the extraction system.
3.4 Validation of the optimization of the N444Br-based DES process
The adequacy of the process optimization based on DES was studied by using a desirability function method. According to the model prediction, the optimal extraction conditions were as follows: shaking temperature of 46.40 °C, extraction time of 2.80 hours, water contents of 71.18%. The predicted result was 39.82 mg g−1. Under the optimal conditions, the average experimental results of 40.1 mg g−1 were highly consistent with the predicted value of the RSM model, further suggesting the suitability of RSM to optimize the extraction rate of DMY by the DES-based extraction process.3.5 Comparison of the N444Br-based OE and other solvents-based OE (OS-OE)
A comparative study was performed to investigate the effectiveness of the N444Br-PA-based OE and EtOH-OE in obtaining the DMY extractant. From Fig. 3, the extraction yield of DMY by the N444Br-PA-based OE was demonstrated to be slighter higher than other reference extraction methods.7 It suggested that N444Br-PA-based OE was an effective procedure for DMY extraction from vine tea, and the DES aqueous solution played a critical role in this process.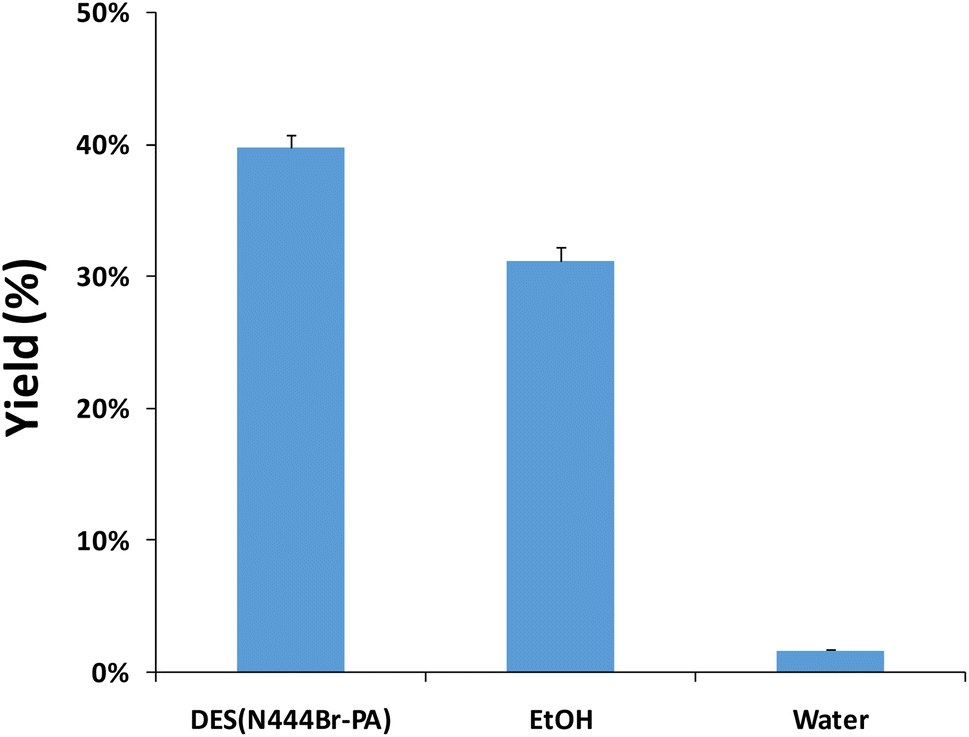 | ||
| Fig. 3 Comparative DMY obtained by various solvent-based OS procedures (n = 3). | ||
Currently, natural hydrophobic DESs have been successfully exploited for the highly efficient separation and recovering of active compounds from medicinal plants or crop byproducts.40 Wang et al.41 reported that hydrophobic DES (D,L-menthol:D,L-lactic acid, 1:2) had the best extraction effect on the selected hydrophobic compounds. Furthermore, hydrophobic deep eutectic solvents were applied to remove ginkgolic acids from the crude extract of Ginkgo biloba leaves.42 In this study, a novel and eco-friendly N444Br-PA-based OS obtained higher contents of DMY from vine tea than other solvents-based OS. In addition, except for water, EtOH-based OS was conducive to the extraction of DMY (Fig. 3). Zhang et al.7 investigated the effects of methanol on total flavonoids, DMY, myricitrin and myricetin of vine tea. They found that the content of DMY in methanol extracts of vine tea was higher, but the extraction amount was much lower than our results. Generally, the physical and chemical properties of target compounds and solvents have an important influence on the extraction and recovery of target compounds. DMY is easily soluble in alcohol and other organic solvents, but difficult to dissolve in cold water,43,44 so organic solvents are traditionally used for extraction.
3.6 FT-IR and SEM analysis
FT-IR spectra of the three extraction solvents (water, ethanol and DES) and their extracts are shown in Fig. 4a and b. In general, similar FT-IR spectra indicate similar composition of the samples under study, while the FT-IR spectra of different solvent extracts were significantly different. Fig. 4a shows the FT-IR spectra of water, EtOH and N444Br-PA, all of which have wide absorption peaks at 3500–3200 cm−1, which is the stretching vibration of the intermolecular hydrogen bond –OH.45 By comparing the FT-IR of the three extracts (Fig. 4b), it was found that the absorption peaks of the EtOH and water extracts were stronger than those of the N444Br-PA extract at 3300 cm−1, and the absorption peaks of the water extract showed an obvious red shift from 3428.94 cm−1 to 3444.38 cm−1. Moreover, by comparing the FT-IR spectra of the N444Br-PA extract and N444Br-PA solvent (Fig. 4c), the differences were mainly observed in the range of 1600–1450 cm−1, including the peak shape and position. This region is mainly the vibration of the benzene ring C![[double bond, length as m-dash]](https://www.rsc.org/images/entities/char_e001.gif) C skeleton, and DMY has two phenolic hydroxyl benzene rings (A- and B-rings). Thus, the FT-IR spectrum of the N444Br-PA extract changes in this region, which also reveals that N444Br-PA has a good extraction effect on DMY. However, there was no significant change in the water extract, indicating that the content of DMY in the water extract was low. The peak shape of the ethanol extract also changed in this region, with little change in peak position.
C skeleton, and DMY has two phenolic hydroxyl benzene rings (A- and B-rings). Thus, the FT-IR spectrum of the N444Br-PA extract changes in this region, which also reveals that N444Br-PA has a good extraction effect on DMY. However, there was no significant change in the water extract, indicating that the content of DMY in the water extract was low. The peak shape of the ethanol extract also changed in this region, with little change in peak position.
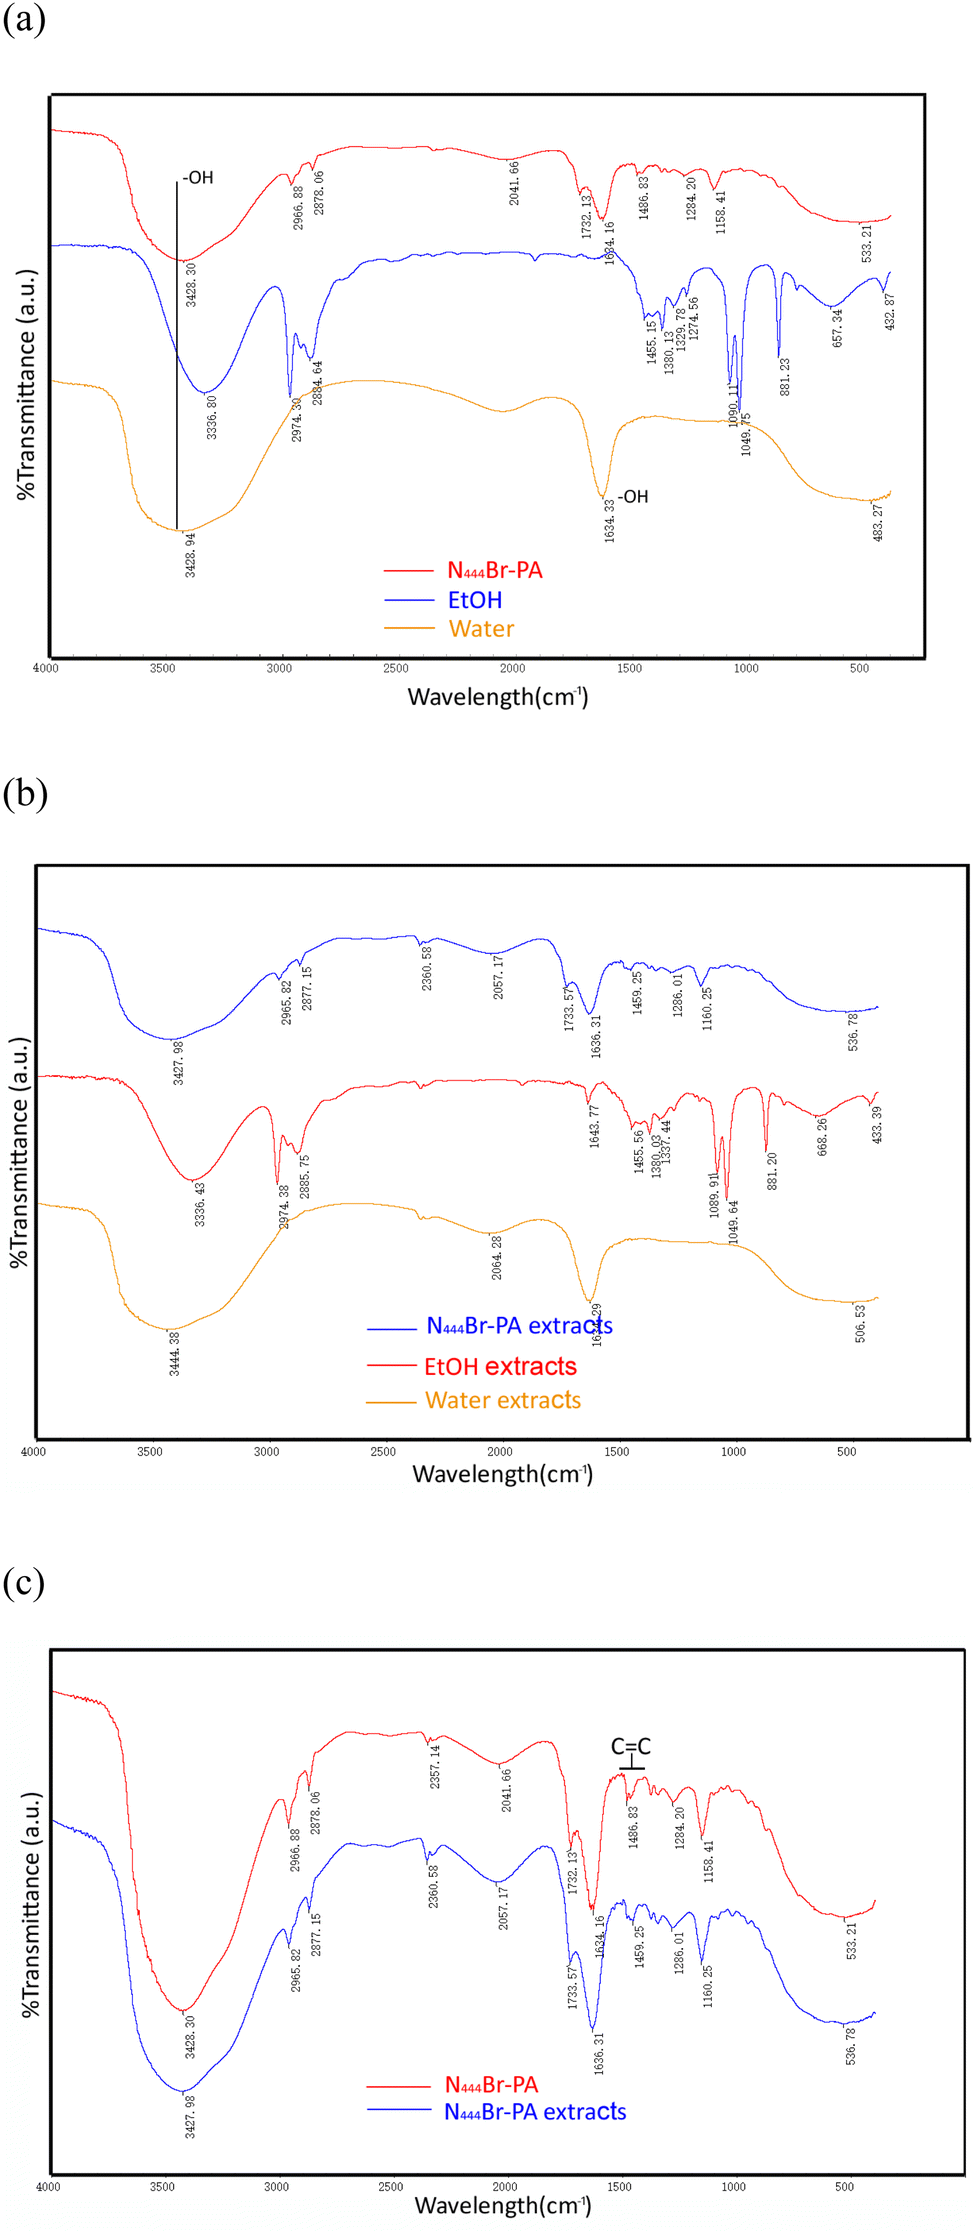 | ||
| Fig. 4 FT-IR spectra of three extraction solvents (a) and their corresponding extractions (b). FT-IR spectra of N444Br-PA and N444Br-PA-based OS extracts (c). | ||
SEM was used to observe the influence of solvents on the surface structure of the plant cell wall after extraction with water, EtOH and DES (see Fig. 5). As can be seen, compared with the raw material of vine tea without extraction (control), the extraction solvent produced significant microscopic morphological changes on the surface structure of the cell wall. Before extraction, the surface of vine tea samples was circular and blocked without pores. After extraction with water, ethanol and DES, more voids and cracks appeared on the surface, which accelerated the dissolution rate of the effective substances. Many studies have reported that cellular destruction releases more active compounds from the plant matrix.46,47 DES, as an effective cell wall-breaking solvent, can cause a pressure difference between the inside and outside of the cell, making the cell burst and releasing the intracellular material. This study is consistent with previous studies; for example, DES can extract cumin (Cuminum cyminum L.) seed essential oil by breaking the cell structure.11 Similarly, DES (ChCl-MaA) intensified the destruction of the cell wall structure, thereby allowing for greater release of antioxidants from partridge leaf tea (Mallotus furetianus L.).38
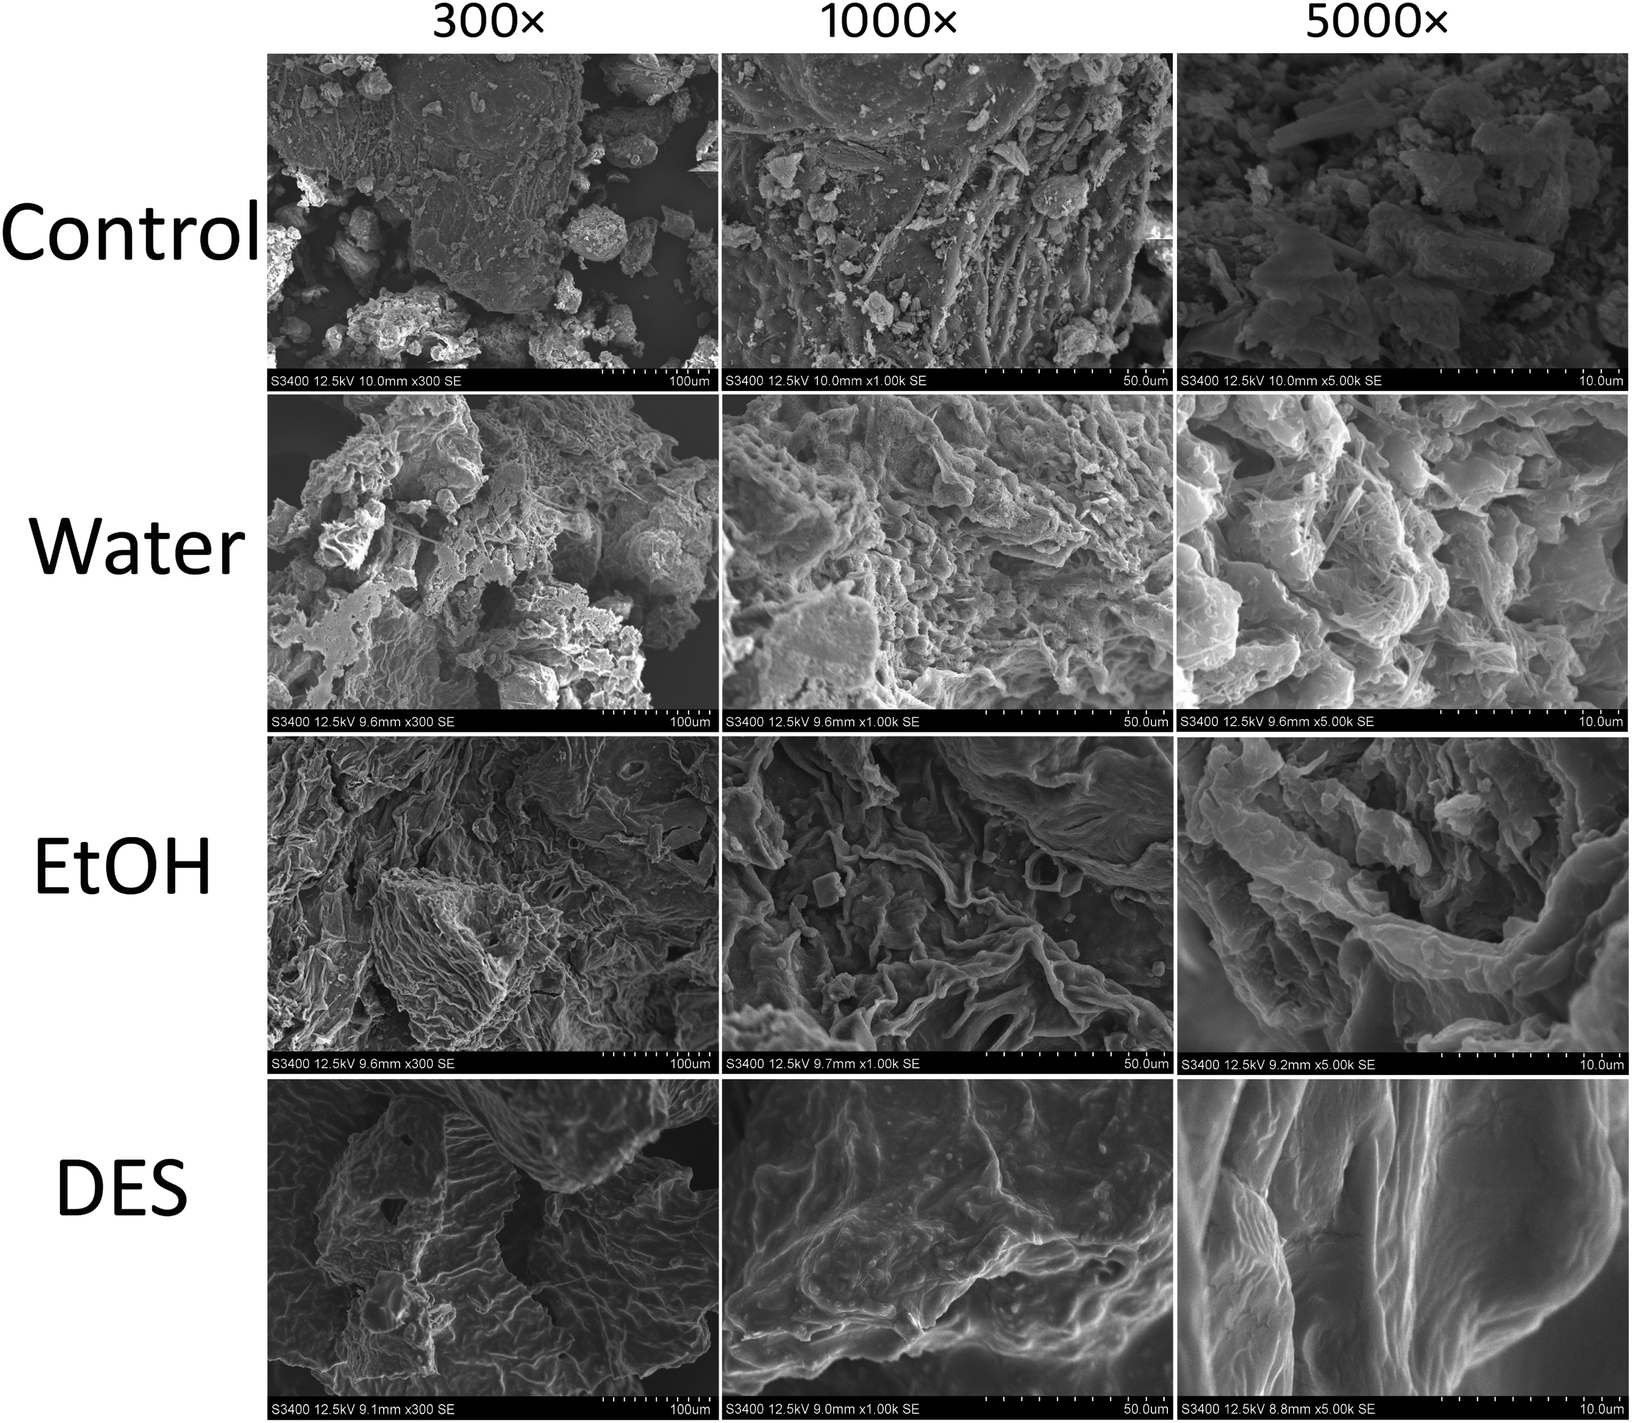 | ||
| Fig. 5 SEM analysis of the raw vine and vine residues after oscillation-assisted extraction using different solvents. | ||
3.7 Recovery of DMY after DES extraction processing
Paradoxically, a solvent with a very low vapor pressure is both disadvantageous and advantageous for extraction. In the extraction process, there is no need to consider the possible evaporation of the solvent due to the temperature increase. At the same time, it also brings difficulties to the subsequent solvent recovery. As mentioned above, the low vapor pressure of DES makes it impossible to evaporate. In addition, a strong intermolecular interaction occurred between DMY and DES, resulting in high extraction efficiency. Therefore, higher DMY extraction means better interaction between DMY and DES. Thus, the separation of DMY from the DES extraction solution may be a challenge.Macroporous resin has several remarkable advantages, including simple operation, low-cost, good selectivity and easy regeneration, and it has been successfully applied for the enrichment and separation of natural products from complex extracts.26,48 In this study, nine different macroporous resins (XAD1600N, XAD16, XAD1180, XAD7HP, D101, S-8, AB-8, DM301, and X-5) were compared, and dynamic adsorption experiments were carried out in a syringe at room temperature. It should be noted that XAD1600N, XAD16, XAD1180, D101, and X-5 are non-polar resins, AB-8 and XAD7HP are weakly polar resins, DM-301 is a moderately polar resin, and S-8 is a polar resin. Here, the ratio of solid to liquid between the resin and extract was 1:2 (W/V), the adsorption time was 2 hours, and the initial sample loading concentration was 306.52 μg mL−1. The recovery of DMY was calculated according to the concentration before and after adsorption (%). The results showed that the recovery rate of DMY (%) was DM301 > XAD1600N > XAD7HP > XAD1180 > D101 > AB-8 > XAD16 > S-8 > X-5 (Fig. 6a). Among them, the adsorption performance of the medium polar macroporous resin (DM301) was better than that of the polar macroporous resin (S-8). Therefore, the macroporous resin can effectively adsorb the target components, while the polar components of the extract can be eluted by deionized water. After that, most of the target compounds can be obtained by elution with ethanol. In conclusion, the enrichment and separation of DMY in the extract of vine tea can be convenient, rapid and efficient by using macroporous resin.
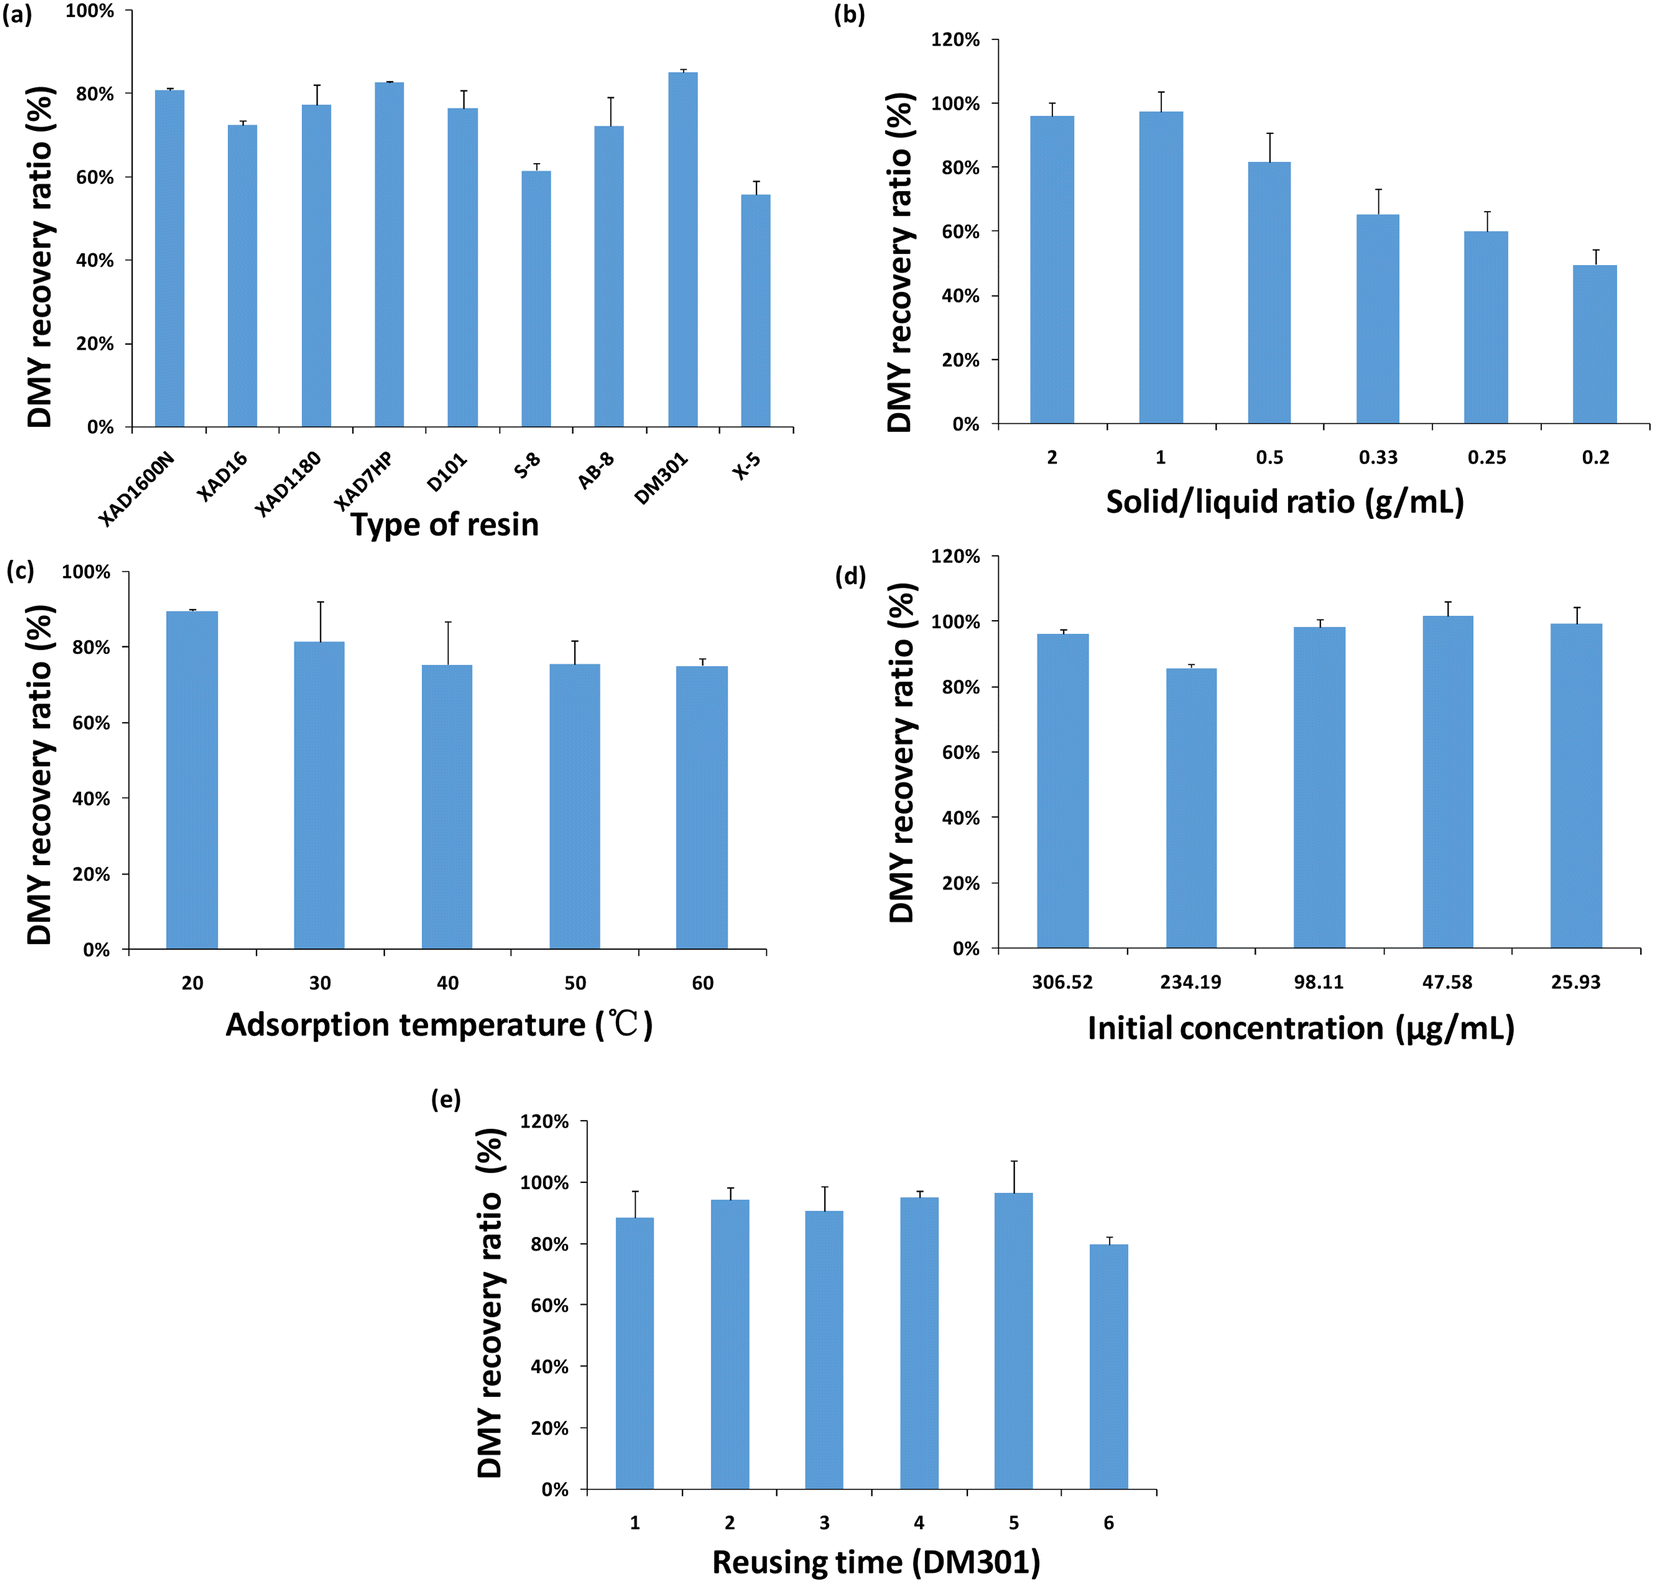 | ||
| Fig. 6 DMY recovery ratio from N444Br-PA-based OS extract on different resins (n = 3). Effects of solid/liquid ratio (b), adsorption temperature (c) and initial concentration (d) on the DMY recovery ratio of DM301 resin and N444Br-PA-based OS extract (n = 3). (e) Effect of reuse times on the DMY recovery ratio of DM301 (n = 3). | ||
According to the above results, the adsorption conditions of DM301 were also investigated, including the solid–liquid ratio, initial concentration and the influence of temperature on the adsorption (Fig. 6b–d). As is well known, the solid–liquid ratio is usually an important adsorption parameter. When the solid–liquid ratio was 0.2–2 g mL−1 and the initial sample concentration was 306.52 μg mL−1, and the adsorption temperature was 20 °C, the effect of the adsorption behavior was investigated.
As can be seen from Fig. 6a, the recovery ratio increases with the increase of the solid–liquid ratio. When the solid–liquid ratio reaches 1, the recovery ratio reaches the maximum (97%). When the initial sample concentration was 306.52 μg mL−1 and the adsorption temperature was 20 °C, the adsorption behavior of the macroporous resin in the range of 0.2–2 g mL−1 solid–liquid ratio was investigated. The recovery ratio increases with the increase of the solid–liquid ratio. When the solid–liquid ratio reaches 1 g mL−1, the recovery ratio reaches the maximum (97%). As another key condition, the study of the temperature effect was conducted at 20–60 °C when the solid–liquid ratio was 1 g mL−1 and the initial sample concentration was 306.52 μg mL−1. The results are shown in Fig. 6c. When the temperature increases, the recovery ratio decreases slightly. The degree of adsorption reduction is less than 5%, indicating that temperature is not an important factor affecting adsorption, so the adsorption process should be an exothermic process. Finally, a series of different initial concentration samples (306.52–25.93 μg mL−1) were selected for further study. The fixed solid–liquid ratio was 1 g mL−1 and the adsorption temperature was 20 °C. As shown in Fig. 6d, the recovery ratio clearly increased firstly and then decreased with the decrease of the initial concentration. When the loading concentration was 47.58 μg mL−1, the recovery ratio of the target DMY was the highest. When the sample concentration was too high, it would increase the interaction between the samples or competitive resin adsorption sites, attenuating the adsorption between DMY and resin.
In conclusion, the importance of macroporous resin recovery is as follows: solid–liquid ratio > initial concentration > adsorption temperature. Under the optimal conditions, the maximum recovery ratio of DMY by DM301 could reach almost 100%.
In addition, through six repeated adsorption and desorption experiments, we studied the reuse time of macroporous resin DM301 on the adsorption performance under optimal conditions, as shown in Fig. 6e. It was found that the recovery ratio of DMY was basically unchanged in the first five times, remaining at 95–100%. Meanwhile, the color and state of the DM301 resin did not change significantly. With the increase of the reuse time, the recovery performance of the resin decreased significantly in the sixth reuse time, and the recovery rate decreased to 87.62%.
3.8 Inhibition kinetics of DMY on XO
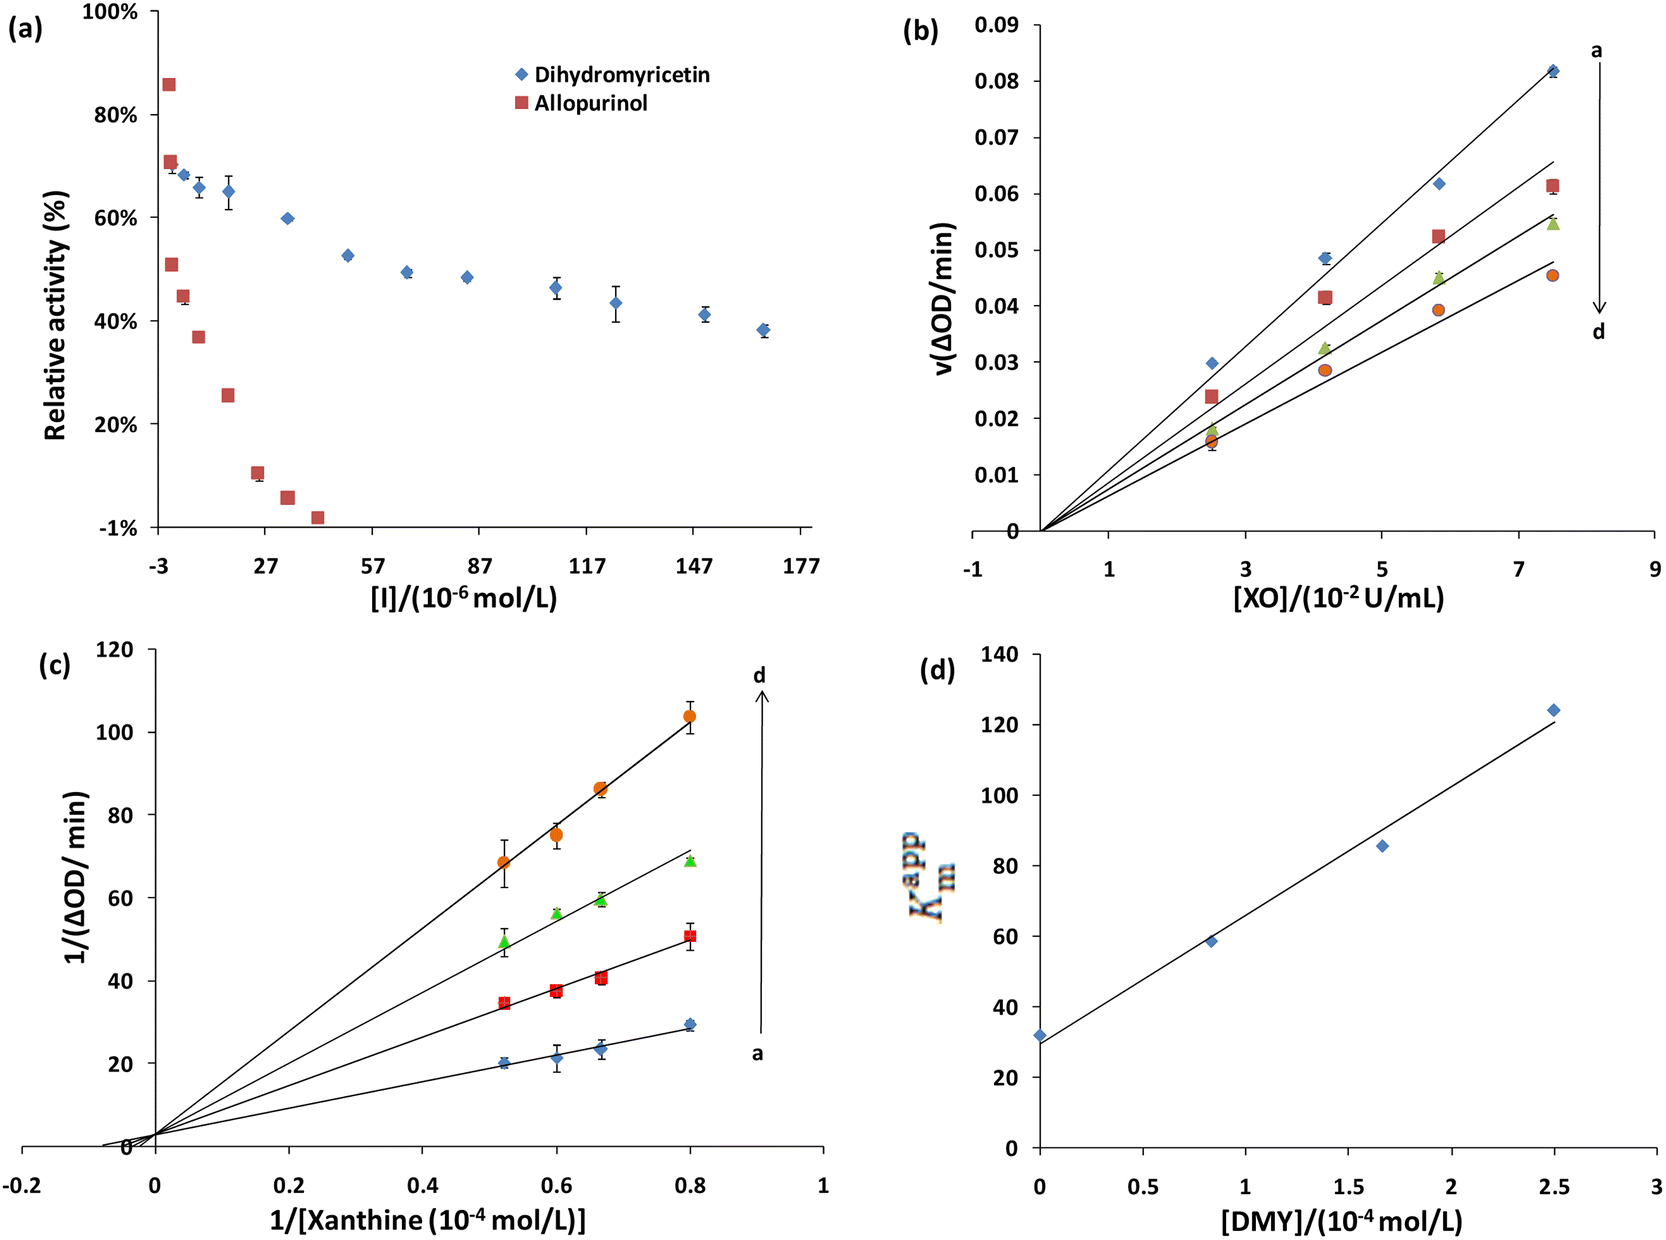 | ||
| Fig. 7 (a) Inhibitory effect of DMY against XO; (b) enzyme kinetics study of DMY against XO; c (DMY) = 0, 0.83, 1.25, and 1.67 × 10⁻⁴ mol L−1 for curves a → d, respectively; (c) Lineweaver–Burk plots of DMY against XO; c (DMY) = 0, 0.83, 1.25, and 2.5 × 10⁻⁴ mol L−1 for curves a → d, respectively; (d) Dixon plot of DMY against XO. | ||
According to the different inhibition mechanisms, reversible inhibition can be divided into competitive inhibition, non-competitive inhibition, and mixed inhibition. The Lineweaver–Burk method was applied to determine the type of inhibition, that is, according to the intersection position of the fitting curve of 1/V to 1/[S] on the coordinate axis under different concentrations of inhibitors. Fig. 7c shows that the fitting lines for different concentrations of DMY intersect on the Y-axis, and the slope of the line increases with the increase of the DMY concentration. This indicates that the maximum enzymatic reaction rate (Vmax) remains unchanged. Furthermore, the apparent Michelin constant (Kappm) keeps increasing, indicating that DMY is a competitive XO inhibitor (Qiu et al., 2009).53 According to eqn (2) and (3), the inhibition constant Ki of DMY on XO was calculated as Ki = (2.96 ± 0.54 × 10⁻³ mol L−1) (n = 3), and the obtained line was linear (Fig. 7d), indicating that DMY had only one or a class of inhibition sites on XO.
3.9 Fluorescence quenching of XO by DMY
Collision quenching, molecular rearrangement, energy transfer, excited state reaction and the formation of the ground state complex can cause the reduction of the quantum yield of the fluorophore, namely fluorescence quenching (Paul et al., 2013).54 A fluorescence quenching experiment can be applied to study the interaction between DMY and XO. Under the same experimental conditions, DMY has no fluorescence emission peak, so it will not affect the experimental results. By adding DMY to the XO solution, the fluorescence intensity of XO decreased gradually (Fig. 8a). When the concentration of DMY reached 13.33 × 10⁻³ mol L−1, about 44% of the fluorescence was quenched, indicating that DMY could quench/replace the XO.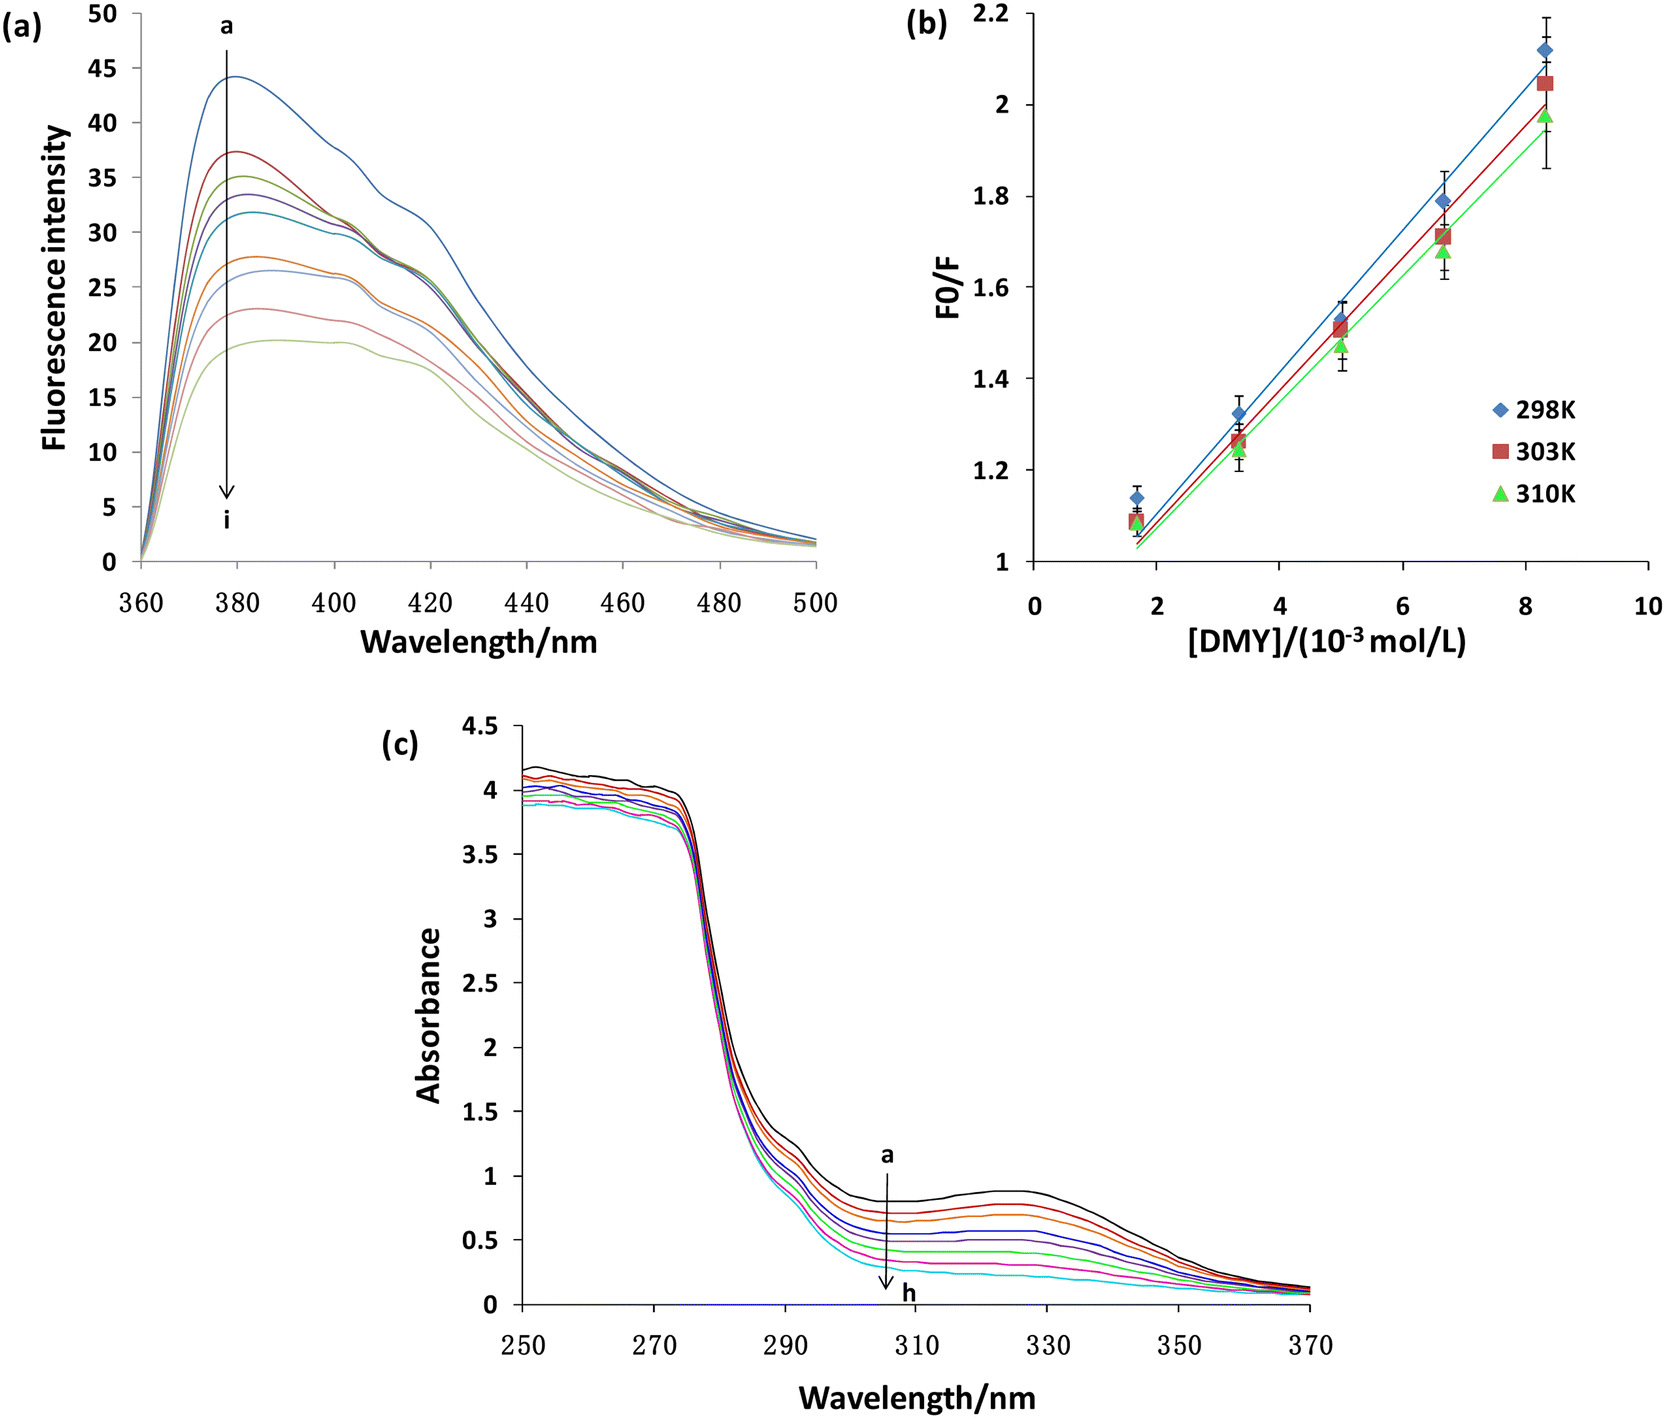 | ||
| Fig. 8 (a) Fluorescence quenching of XO with different concentrations of DMY at 303 K. c (XO) = 1 × 10⁻⁴ mol L−1, and c (DMY) = (0, 1.67, 3.33, 5, 6.67, 8.33, 10, 11.67, 13.33 × 10⁻³ mol L−1 for curves a → i, respectively. (b) Stern–Volmer plots for the fluorescence quenching of XO by DMY at three different temperatures (298, 303, and 310 K). (c) UV-vis spectra of XO (1 × 10⁻⁴ mol L−1) in the titration of DMY (T = 298 K, pH = 6.8). c (DMY) = 0, 1.67, 3.33, 5, 6.67, 8.33, 10, 11.67, 13.33 × 10⁻³ mol L−1 corresponding to curves a → h. | ||
Static and dynamic quenching are two main forms of fluorescence quenching. The former refers to the interaction between the quenching molecules and fluorescent molecules to form non-fluorescent complexes. As the temperature increased, the stability of the complex decreased, so the quenching degree and the quenching constant decreased. The latter refers to the collision between the quenching molecules and fluorescent molecules, resulting in energy loss or transfer, which leads to fluorescence quenching of fluorescent molecules. As the temperature increases, the molecular motion intensifies, the quenching degree increases, and the quenching constant increases. The Stern–Volmer equation can be used to analyze the fluorescence quenching mode:
| F0/Fc = 1 + Kqτ0[Q] = 1 + Ksv[Q] | (6) |
| T (K) | Ksv (×103 L mol−1) | Ra | Ka (×104 L mol−1) | N | Rb | ΔH° (kJ mol−1) | ΔG° (kJ mol−1) | ΔS° (J mol−1 K−1) |
|---|---|---|---|---|---|---|---|---|
| a Ra and Rb are the correlation coefficients for the Ksv and Ka values, respectively. | ||||||||
| 298 | 0.153 | 0.981 | 4.05 ± 0.17 | 1.33 ± 0.59 | 0.991 | 36.02 ± 0.16 | −71.32 ± 0.16 | 0.36 ± 0.16 |
| 303 | 0.143 | 0.987 | 4.51 ± 0.23 | 1.39 ± 0.67 | 0.981 | −73.12 ± 0.16 | ||
| 310 | 0.137 | 0.988 | 5.02 ± 0.21 | 1.44 ± 0.70 | 0.992 | −75.64 ± 0.16 | ||
For static quenching, the formula for calculating binding constant Ka and the number of binding sites n is as follows:51
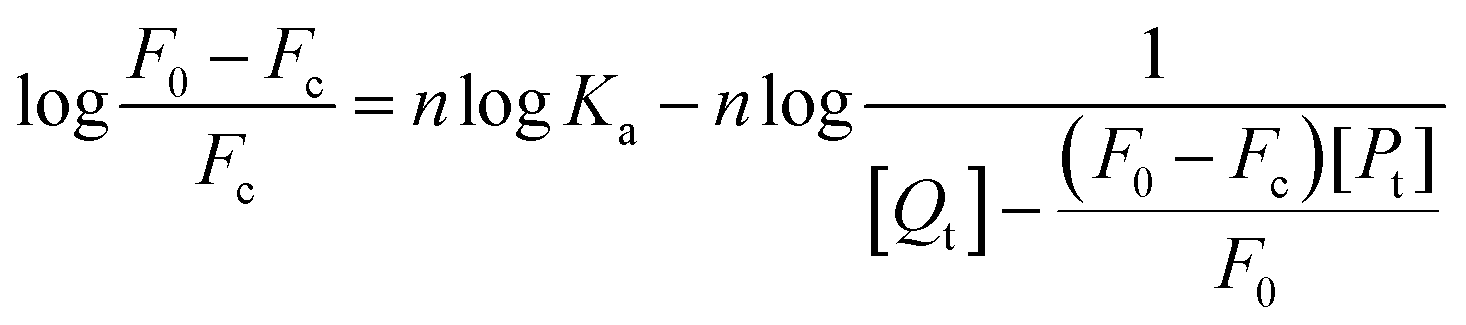 | (7) |
The fluorescence quenching mechanism of XO was further studied by UV-vis absorption spectroscopy. In general, the dynamic quenching does not change the absorption spectrum of the fluorophore, but only affects the excited state of the fluorophore. Meanwhile, the formation of the ground state complex often results in the shift of the absorption spectrum of the fluorophore.56 With the increase of DMY contents, the absorbance decreases continuously with a slight red shift (Fig. 8b). Moreover, a new absorption peak is formed near OD330, and the absorbance increases with the increase of the DMY contents, indicating the formation of new substances or compounds (Fig. 8b). Therefore, the change of the UV-vis spectrum further indicates that DMY and XO forms complex or new substances, and fluorescence quenching belongs to static quenching.
Thermodynamic parameters can be used to determine the main force types between DMY and XO. Thermodynamic parameters, such as the enthalpy change (ΔH°), entropy change (ΔS°) and free energy change (ΔG°), in the complex formation process were calculated by eqn (8) and (9) to evaluate the main force between the inhibitor and XO:57
 | (8) |
| ΔG° = ΔH° − TΔS° | (9) |
3.10 Molecular docking
Molecular docking can visually display the mode of binding between DMY and XO (Fig. 9a), which is an effective computational procedure to study the interactions between the ligand and receptor.58–60 As shown in Fig. 9b and c, DMY binds to a hydrophobic and hydrophilic cavity at XO, which is mainly composed of hydrophobic residues (such as Leu41, Phe604, Leu27, and Leu605) and hydrophilic residues (such as Lys269, Asp594, and Arg32). The ligand benzene ring can form an accumulated hydrophobic effect with the hydrophobic residues, and the ligand hydroxyl oxygen can form a hydrogen bond with multiple residues' side chains around. Therefore, hydrophobicity, hydrogen bonding and electrostatic interaction simultaneously hold ligand molecules together. The docking results also show that the free energy of DMY and XO is −153.34 kJ mol−1, which indicate that they have a good binding ability.61 The interaction energy is higher than the experimental binding energy (−71.32 ± 0.16 kJ mol−1, 298 K), which may be due to the fact that the simulation is performed in a vacuum and lacking the desolvation energy. Therefore, the good binding ability of DMY and XO interferes with the conformational dynamics of XO, so that the substrate xanthine cannot be further catalyzed to uric acid.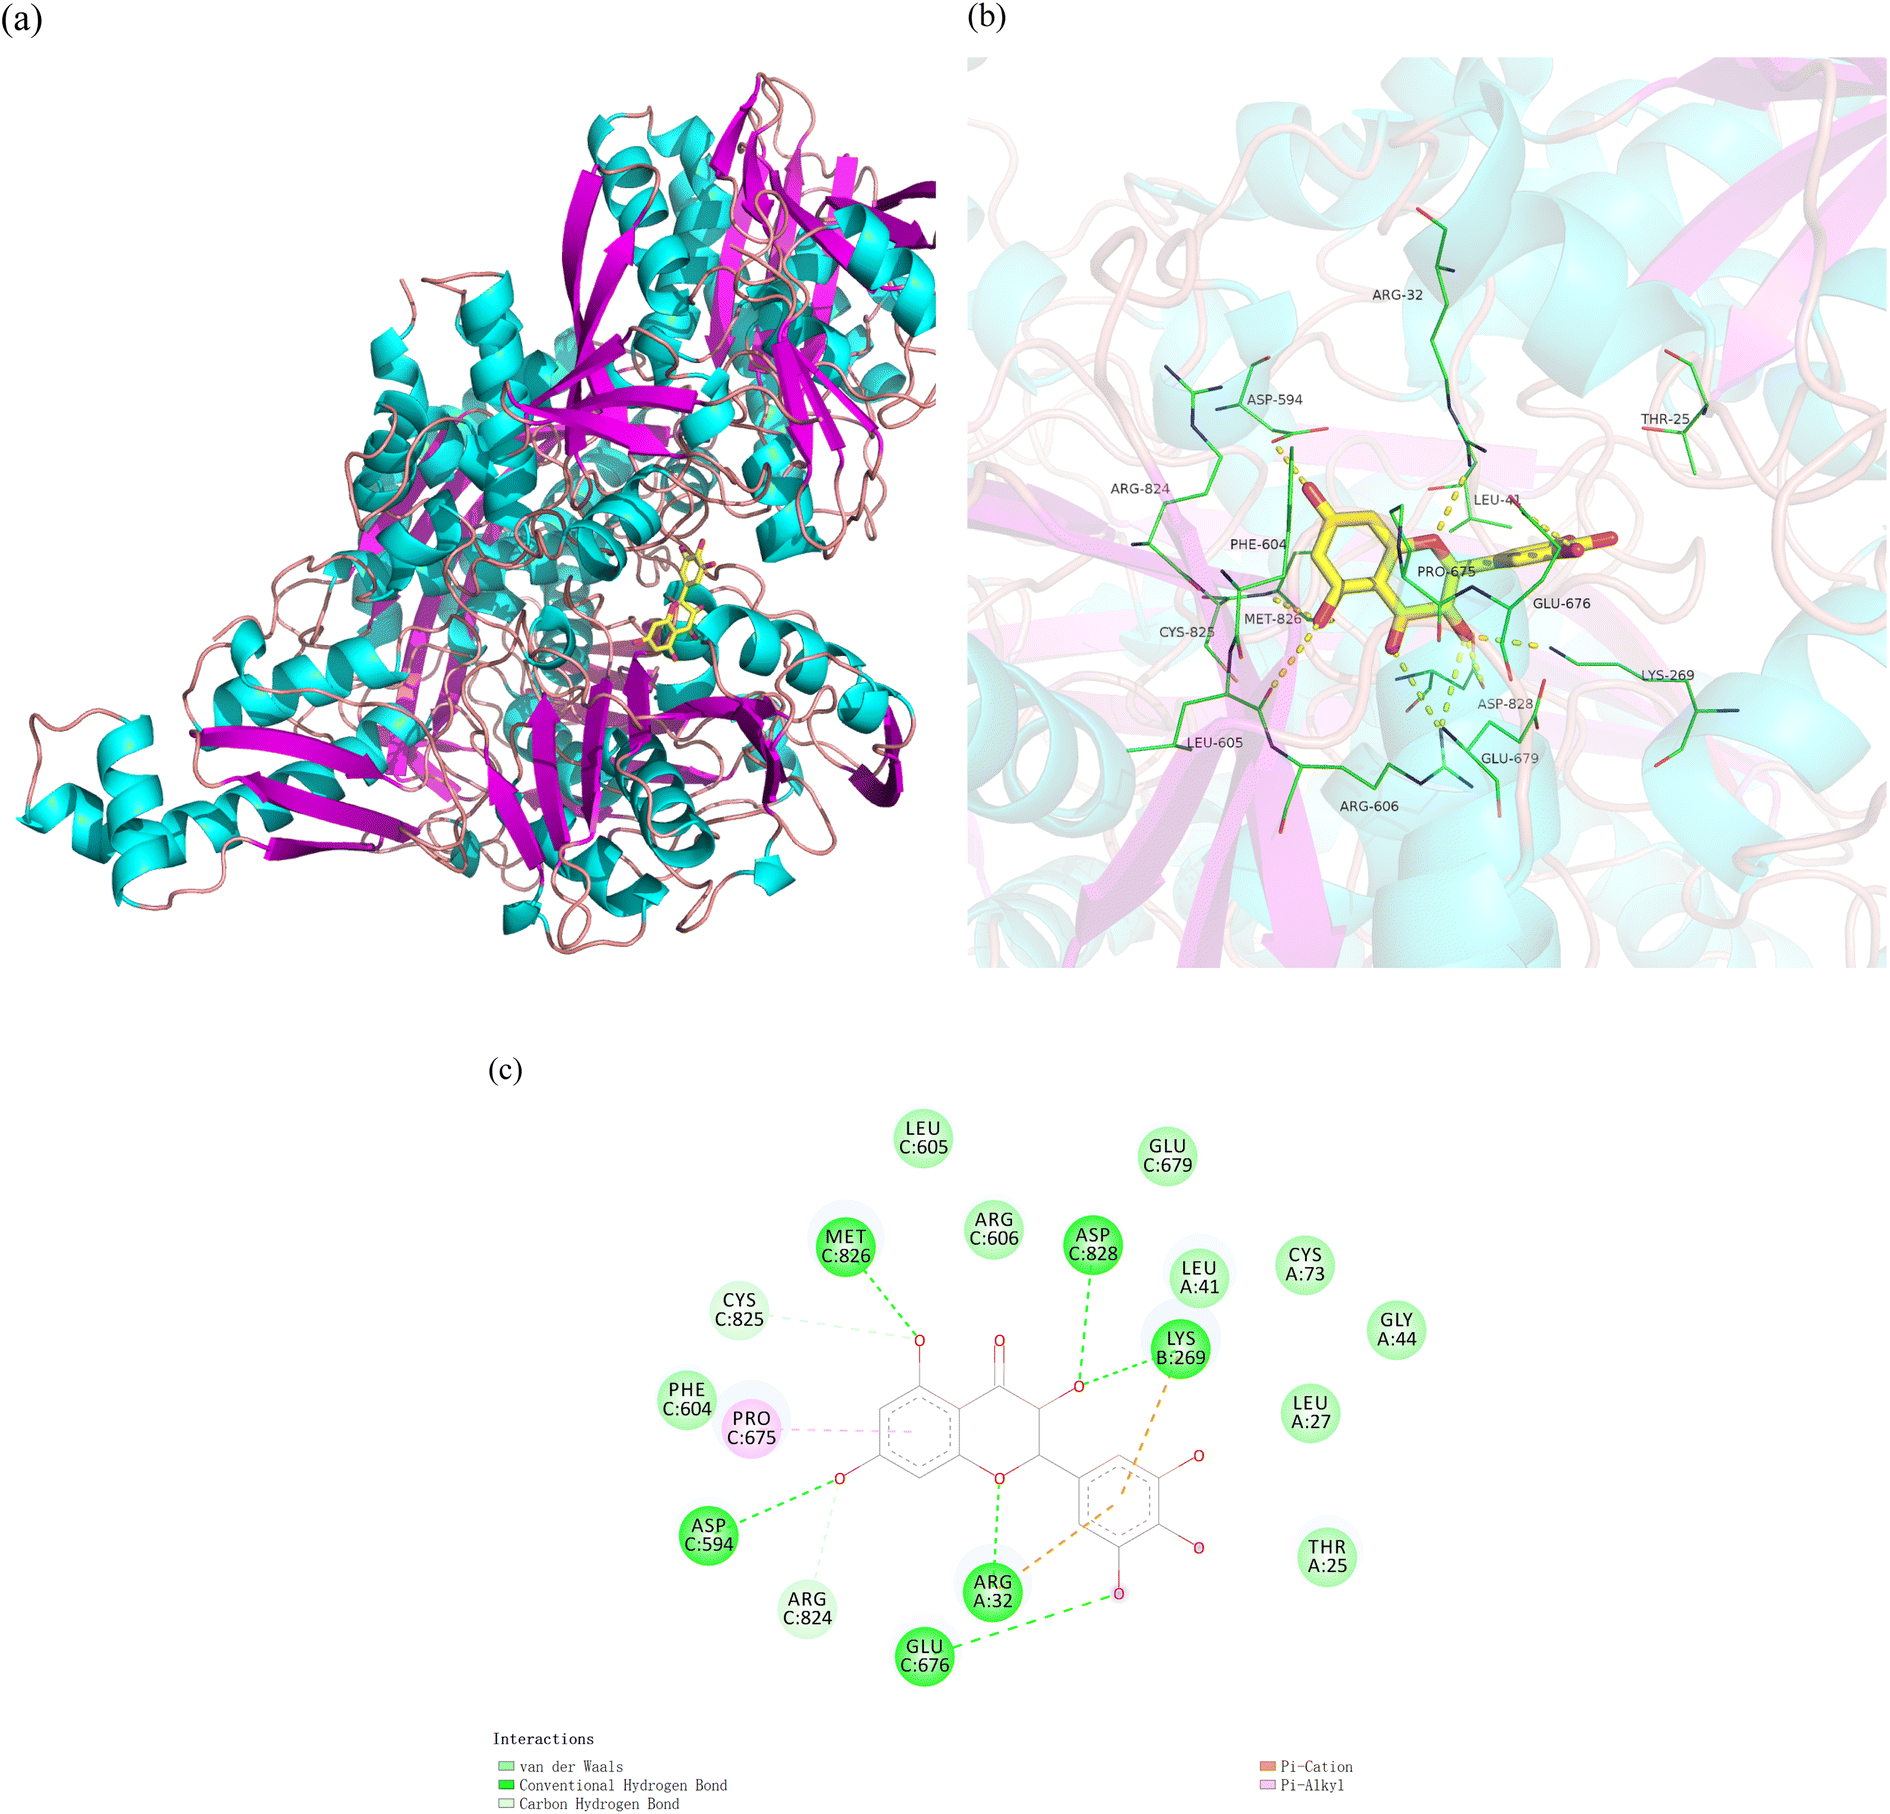 | ||
| Fig. 9 Molecular simulation results: docking model of the best binding orientation for DMY with XO (a), major binding of amino acid residues of XO interacting with DMY for 3D (b) and 2D (c) interaction diagrams. | ||
3.11 MD simulation
MD simulation was generally used to analyze the conformational changes and stability of biomolecules over a period of time as a supplement and verifying the docking results. The RMSD value can reflect the stability of the system during the simulation process. As shown in Fig. 10a, the RMSD of the XO molecule oscillated slightly at the beginning, and then it was stable below 2 Å. The RMSD of the DMY–XO complex increased slightly, but the overall RMSD was still stable and finally stabilized at 2 Å. The DMY–OX curve has an upward sloping trend, which indicates that some significant conformation movement has occurred.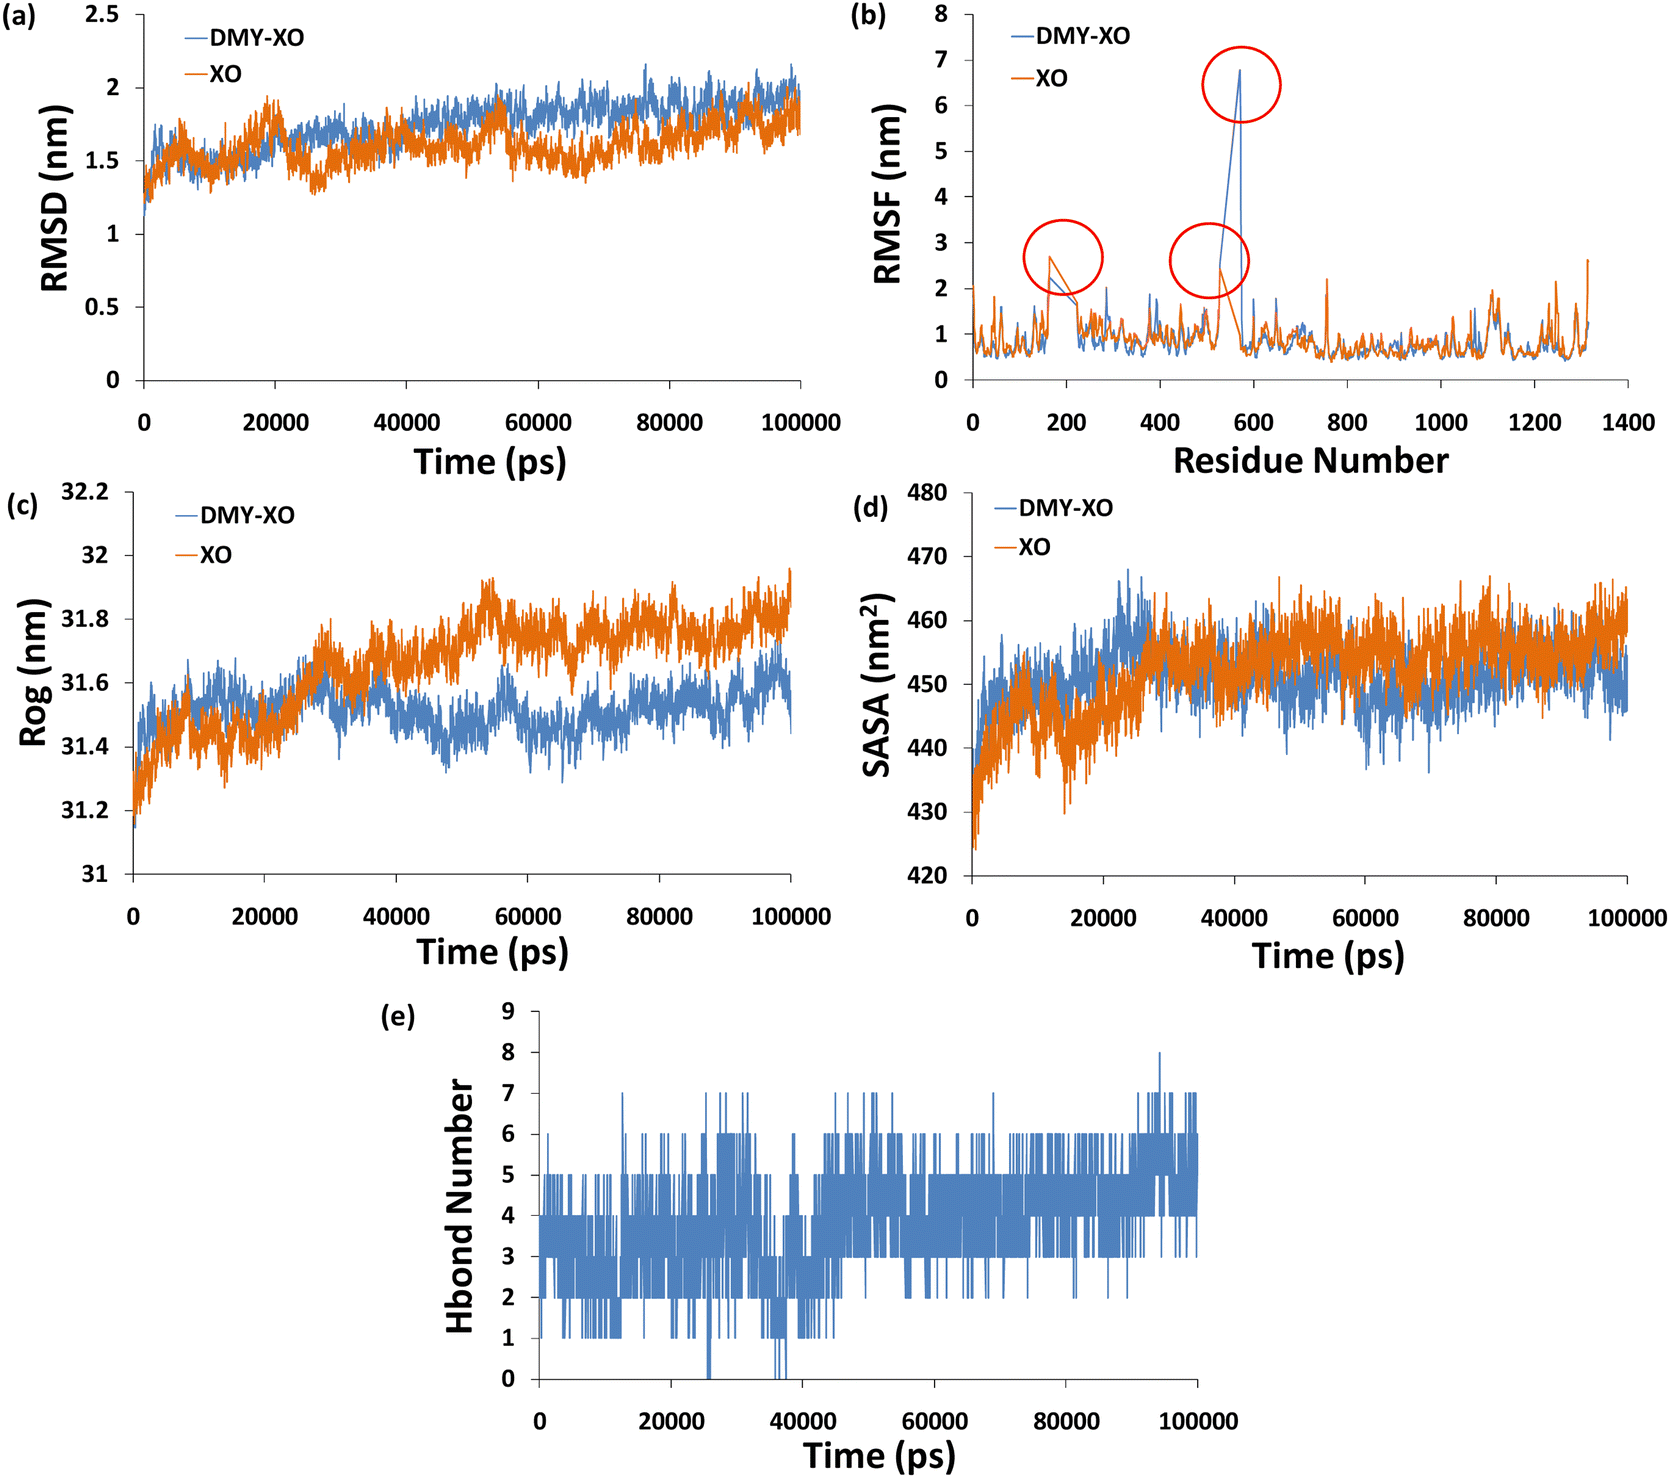 | ||
| Fig. 10 MD simulation performed by the amber18 package at 300 K during 100000 ps simulation times. (a: Root mean squared fluctuation (RMSF) against the residue numbers of Tyr alone and XO–DMY complex. b: Root mean squared deviation (RMSD) for the DMY–XO complex and XO. c: Changes in the radius of gyration (Rog) for XO and the DMY–XO complex. d: Solvent accessible surface area (SASA) analysis of DMY bound XO. e: Intermolecular hydrogen bonds formed of XO and DMY.). | ||
RMSF reflects the freedom of movement of each atom in the molecule (fluctuation). On the whole, the RMSF fluctuation of the two systems is relatively low, and basically maintained below 2 Å (Fig. 10b). The red circle in Fig. 10b is the junction of chain and chain, not the fluctuation of residues in the chain, so they fluctuate a lot. However, the loop regions ranging from 850–950, 650–750, and 250–350 showed high fluctuations (Fig. 10b), which may be because the amino acid residues at these points were involved in conformational modifications to ensure the stable binding of XO and DMY.62
Rog is a physical quantity describing the compactness of proteins. The smaller the radius, the more compactness it is, which means the more stable the protein structure is. The Rog of XO increases slightly and stabilizes at 31.9 Å. The Rog of the DMY–XO system fluctuated slightly, but was lower than that of the free protein system (Fig. 10c), which indicates that the combination of small molecules makes the protein conformation more compact and stable. This also explains that the inhibitory effect of DMY on OX lies in the formation of complexes.
SASA is another indicator of macromolecule stability by calculating the surface area of the macromolecule protein in contact with the solvent.63 The SASA of the two systems was roughly the same, but there were slight differences (Fig. 10d). In contrast, the solvent reachable area is lower in the DMY–XO systems, proving that binding small molecules does not change the overall conformation of the protein. However, it will affect the microenvironment and lead to changes in SASA to some extent, which is consistent with the results of Rog.
Hydrogen bonds play an important role in the binding of ligands to proteins. The number of hydrogen bonds between DMY and XO in the dynamics process is shown in Fig. 10e. The number of hydrogen bonds between the complex ranges from 0 to 8. In most cases, there are about 5 hydrogen bonds, which indicates that the complex has good hydrogen bond interactions (electrostatic interaction), which supported the results from the thermodynamic parameter analysis.
Therefore, it can be concluded that the binding of DMY with OX had an impact on the conformation of OX to make it loose. Some amino acid residues had obvious fluctuations due to the interaction between DMY and OX, and the complex had good hydrogen bond interaction.
4 Conclusions
In this study, a method was developed to extract DMY from vine tea by DES with different hydrogen bond donors and acceptors. The results showed that DES with N444Br:PA (1:2) had higher extraction efficiency. In addition, single factor experiment and RSM were used to investigate and optimize the extraction conditions. Compared with traditional alcohol and water extraction, DES extraction not only can obtain a higher yield, but is also a more green and safe process. Furthermore, the recovery of the target compound was studied, and it was found that solvent extraction combined with macroporous resin adsorption can achieve the enrichment and separation of DMY from vine tea. Moreover, DMY exhibited a decent inhibiting effect and reversible competitive inhibition characteristics against XO. DMY might well be a potential competitor to the substrate, as determined by spectral analysis and computational chemistry. In summary, this work can provide a simple, efficient and environmentally friendly method for the extraction and separation of DMY from vine tea, which also provides an alternative reference for the extraction and separation of natural products from other biological resources. At the same time, a new application of DMY against XO was found, which has potential applications in medicine and other industries.
Data availability
Data can be made available upon reasonable request.Conflicts of interest
The authors declare no competing financial interests.Acknowledgements
This work was supported by the Zhejiang Provincial Science and Technology Project (no. 2021F1065-8) and the Zhejiang Provincial Public Welfare Technology Application and Research Project of China (no. LGN21C020004).References
- L. Wang, Y. Zhou, Y. Wang, Y. Qin, B. Liu and M. Bai, Two green approaches for extraction of dihydromyricetin from Chinese vine tea using β-Cyclodextrin-based and ionic liquid-based ultrasonic-assisted extraction methods, Food Bioprod. Process., 2019a, 116, 1–9 Search PubMed.
- D. Liu, Y. Mao, L. Ding and X. A. Zeng, Dihydromyricetin: A review on identification and quantification methods, biological activities, chemical stability, metabolism and approaches to enhance its bioavailability, Trends Food Sci. Technol., 2019, 91, 586–597 CrossRef CAS PubMed.
- R. C. V. Carneiro, L. Ye, N. Baek, G. H. A. Teixeira and S. F. O'Keefe, Vine tea (Ampelopsis grossedentata): A review of chemical composition, functional properties, and potential food applications, J. Funct. Foods, 2021, 76, 104317 CrossRef CAS.
- J. Xu, X. Li, Y. Xu, A. Wang, Z. Xu, X. Wu, D. Li, C. Mu and L. Ge, Dihydromyricetin-Loaded Pickering Emulsions Stabilized by Dialdehyde Cellulose Nanocrystals for Preparation of Antioxidant Gelatin–Based Edible Films, Food Bioprocess Technol., 2021, 14, 1648–1661 CrossRef CAS.
- W. Routray and V. Orsat, Microwave-Assisted Extraction of Flavonoids: A Review, Food Bioprocess Technol., 2012, 5, 409–424 CrossRef CAS.
- L. P. Ruan, B. Y. Yu, G. M. Fu and D. N. Zhu, Improving the solubility of ampelopsin by solid dispersions and inclusion complexes, J. Pharmaceut. Biomed., 2005, 38(3), 457–464 CrossRef CAS PubMed.
- H. Zhang, G. Xie, M. Tian, Q. Pu and M. Qin, Optimization of the Ultrasonic-Assisted Extraction of Bioactive Flavonoids from Ampelopsis grossedentata and Subsequent Separation and Purification of Two Flavonoid Aglycones by High-Speed Counter-Current Chromatography, Molecules, 2016, 21(8), 1096 CrossRef PubMed.
- E. L. Smith, A. P. Abbott and K. S. Ryder, Deep eutectic solvents (DESs) and their applications, Chem. Rev., 2014, 114(21), 11060–11082 CrossRef CAS PubMed.
- Q. Zhang, O. V. K. De, S. Royer and F. Jérôme, Deep eutectic solvents: syntheses, properties and applications, Chem. Soc. Rev., 2012, 41(21), 7108–7146 RSC.
- L. Wang, Y. Wang, Y. Qin, B. Liu and Y. Zhou, Extraction and Determination of Protein from Edible Oil Using Aqueous Biphasic Systems of Ionic Liquids and Salts, Food Bioprocess Technol., 2022b, 15, 190–202 Search PubMed.
- Y. Zhao, P. Wang, W. Zheng, G. Yu, Z. Li, Y. She and M. Lee, Three-stage microwave extraction of cumin (Cuminum cyminum L.) Seed essential oil with natural deep eutectic solvents, Ind. Crop. Prod., 2019, 140, 111660 CrossRef CAS.
- H. Zhu, J. Zhang, C. Li, S. Liu and L. Wang, Morinda citrifolia L. leaves extracts obtained by traditional and eco-friendly extraction solvents: Relation between phenolic compositions and biological properties by multivariate analysis, Ind. Crop. Prod., 2020, 153, 112586 CrossRef CAS.
- S. Vladimir-Knežević, M. Perković, K. Zagajski Kučan, M. Mervić and M. Rogošić, Green extraction of flavonoids and phenolic acids from elderberry (Sambucus nigra L.) and rosemary (Rosmarinus officinalis L.) using deep eutectic solvents, Chem. Pap., 2021, 76, 341–349 CrossRef.
- L. Duan, W. Zhang, Z. Zhang, E. Liu and L. Guo, Evaluation of natural deep eutectic solvents for the extraction of bioactive flavone C-glycosides from Flos Trollii, Microchem. J., 2018, 145, 180–186 CrossRef.
- L. Yi, J. Feng, M. Gauthier and W. Li, Effect of the addition of deep eutectic solvent to the anthracene separation, J. Mol. Liq., 2021, 339, 116762 CrossRef CAS.
- T. Rodrigues Arruda, P. Fontes Pinheiro, P. Ibrahim Silva and P. Campos Bernardes, Exclusive Raw Material for Beer Production? Addressing Greener Extraction Techniques, the Relevance, and Prospects of Hops (Humulus lupulus L.) for the Food Industry, Food Bioprocess Technol., 2022, 15, 275–305 CrossRef CAS.
- X. Li and K. H. Row, Development of deep eutectic solvents applied in extraction and separation, J. Sep. Sci., 2016, 39(18), 3505–3520 CrossRef CAS PubMed.
- F. Borges, E. Fernandes and F. Roleira, Progress towards the discovery of xanthine oxidase inhibitors, Curr. Med. Chem., 2002, 9(2), 195–217 CrossRef CAS PubMed.
- R. Kumar, S. S. Darpan and R. Singh, Xanthine oxidase inhibitors: a patent survey, Expert Opin. Ther. Pat., 2011, 21(7), 1071–1108 CrossRef CAS PubMed.
- Y. Wang, G. Zhang, J. Yan and D. Gong, Novel insights into the inhibitory mechanism of kaempferol on xanthine oxidase, J. Agric. Food Chem., 2015, 63, 526–534 CrossRef CAS PubMed.
- J. Yan, G. Zhang, Y. Hu and Y. Ma, Effect of luteolin on xanthine oxidase: Inhibition kinetics and interaction mechanism merging with docking simulation, Food Chem., 2013, 141(4), 3766–3773 CrossRef CAS PubMed.
- P. Cos, L. Ying, M. Calomme, J. P. Hu, K. Cimanga, B. Van Poel, L. Pieters, J. A. Vlietinck and D. Vanden Berghe, Structure–activity relationship and classification of flavonoids as inhibitors of xanthine oxidase and superoxide scavengers, J. Nat. Prod., 1998, 61, 71–76 CrossRef CAS PubMed.
- Z. Lu, J. Yu, S. Chen and Y. Yao, Effect of dihydromyricetin from cany tea on acute gouty arthritis model rats, Chin. J. Mod. Appl. Pharm., 2015, 32(4), 396–399 CAS.
- L. F. Wu, L. Li, S. J. Chen, L. Wang and X. Lin, Deep eutectic solvent-based ultrasonicassisted extraction of phenolic compounds from Moringa oleifera L. leaves: Optimization, comparison and antioxidant activity, Sep. Purif. Technol., 2020, 247, 117014 CrossRef CAS.
- A. K. Dwamena, Recent advances in hydrophobic deep eutectic solvents for extraction, Separations, 2019, 6(1), 9 CrossRef CAS.
- Y. Zhou, L. Wang, L. Chen, T. Liu, R. Sha and J. Mao, Enrichment and separation of steroidal saponins from the fibrous roots of Ophiopogon japonicas using macroporous adsorption resins, RSC Adv., 2019, 9, 6689 RSC.
- G. W. Zhang, N. Zhao and L. Wang, Probing the binding of vitexin to human serum albumin by multispectroscopic techniques, J. Lumin., 2011, 131(5), 880–887 CrossRef CAS.
- L. Wang, Y. Qin, Y. Wang, Y. Zhou, B. Liu, M. Bai, X. Tong, R. Fang and X. Huang, Inhibitory mechanism of two homoisoflavonoids from Ophiopogon japonicus on tyrosinase activity: insight from spectroscopic analysis and molecular docking, RSC Adv., 2021a, 11, 34343 Search PubMed.
- M. Xu, L. Ran, N. Chen, X. Fan, D. Ren and L. Yi, Polarity-dependent extraction of flavonoids from citrus peel waste using a tailor-made deep eutectic solvent, Food Chem., 2019, 297, 124970 CrossRef CAS PubMed.
- M. Alrugaibah, Y. Yagiz and L. Gu, Use natural deep eutectic solvents as efficient green reagents to extract procyanidins and anthocyanins from cranberry pomace and predictive modeling by RSM and artificial neural networking, Sep. Purif. Technol., 2021, 255, 117720 CrossRef CAS.
- B. Liu, J. Du, Z. Jie, C. Chen and S. Niu, Characterization and antioxidant activity of dihydromyricetin–lecithin complex, Eur. Food Res. Technol., 2009, 230(2), 325–331 CrossRef CAS.
- Z. Wei, X. Qi, T. Li, M. Luo, W. Wang, Y. Zu and Y. Fu, Application of natural deep eutectic solvents for extraction and determination of phenolics in Cajanus cajan leaves by ultra performance liquid chromatography, Sep. Purif. Technol., 2015, 149, 237–244 CrossRef CAS.
- S. Rozas, C. Benito, R. Alcalde, M. Atilhan and S. Aparicio, Insights on the water effect on deep eutectic solvents properties and structuring: The archetypical case of choline chloride + ethylene glycol, J. Mol. Liq., 2021, 344, 117717 CrossRef CAS.
- L. Huiping, Z. Guoqun, N. Shanting and L. Yiguo, Technologic parameter optimization of gas quenching process using response surface method, Comput. Mater. Sci., 2007, 38(4), 561e570 CrossRef.
- M. Bimakr, R. A. Rahman, A. Ganjloo, F. S. Taip, L. M. Salleh and M. Z. I. Sarker, Optimization of Supercritical Carbon Dioxide Extraction of Bioactive Flavonoid Compounds from Spearmint (Mentha spicata L.) Leaves by Using Response Surface Methodology, Food Bioprocess Technol., 2012, 5, 912–920 CrossRef CAS.
- R. H. Myers, D. C. Montgomery, C. M. Anderson-Cook, 2016. Response surface methodology: process and product optimization using designed experiments, 4th edn, John Wiley & Sons, Hoboken, New Jersey, 709–712 Search PubMed.
- M. Oroian, F. Ursachi and F. Dranca, Ultrasound-assisted extraction of polyphenols from crude pollen, Antioxidants, 2020, 9, 322 CrossRef CAS PubMed.
- R. Wang, R. He, Z. Li, S. Li, C. Li and L. Wang, Tailor-made deep eutectic solvents-based green extraction of natural antioxidants from partridge leaf-tea (Mallotus furetianus L.), Sep. Purif. Technol., 2021b, 275, 119159 Search PubMed.
- I. Drevelegka and A. M. Goula, Recovery of grape pomace phenolic compounds through optimized extraction and adsorption processes, Chem. Eng. Process, 2020, 149, 107845 CrossRef CAS.
- A. Kalyniukova, J. Holusa, D. Musiolek, J. Sedlakova-Kadukova, J. Plotka-Wasylka and V. Andruch, Application of deep eutectic solvents for separation and determination of bioactive compounds in medicinal plants, Ind. Crop. Prod., 2021, 172, 114047 CrossRef CAS.
- T. Wang, Q. Wang, Q. Guo, P. Li and H. Yang, A hydrophobic deep eutectic solvents-based integrated method for efficient and green extraction and recovery of natural products from Rosmarinus officinalis leaves, Ginkgo biloba leaves and Salvia miltiorrhiza roots, Food Chem., 2021c, 130282 Search PubMed.
- Q. H. Dong, J. Cao, R. Wu, T. T. Shi, W. Zhang, F. L. Cao, G. B. Wang and E. Z. Su, Efficient removal of ginkgolic acids from Ginkgo biloba leaves crude extract by using hydrophobic deep eutectic solvents, Ind. Crop. Prod., 2021, 166, 113462 CrossRef CAS.
- P. Zhang, S. Cai, L. Song, L. Zhang, H. Fan, L. Zhou, R. Lin, G. Yang, X. Bian, W. Wang and J. Zhang, Solubility of dihydromyricetin in ethanol and water mixtures from 288.15 to 323.15K, J. Mol. Liq., 2015, 211, 197–202 CrossRef CAS.
- Y. Deng, L. Guo, H. Cai, L. Chen, S. Tan, B. Zhang, P. Fang, D. Xiang, H. Li, G. He and M. Yan, Dihydromyricetin affect the pharmacokinetics of triptolide in rats, Xenobiotica, 2020, 50, 332–338 CrossRef CAS PubMed.
- L. J. Rather, Q. Zhou, A. Ali, Q. Mohd, R. Haque and Q. Li, Valorization of natural dyes extracted from mugwort leaves (Folium artemisiae Argyi) for wool fabric dyeing: optimization of extraction and dyeing processes with simultaneous coloration and bio-functionalization, ACS Sustainable Chem. Eng., 2020, 8, 2822–2834 CrossRef CAS.
- P. Xie, L. Huang, C. Zhang, Y. Deng, X. Wang and J. Cheng, Enhanced extraction of hydroxytyrosol, maslinic acid and oleanolic acid from olive pomace: Process parameters, kinetics and thermodynamics, and greenness assessment, Food Chem., 2019, 276, 662–674 CrossRef CAS PubMed.
- P. Pontes, I. A. Shiwaku, G. J. Maximo and E. Batista, Choline chloride based deep eutectic solvents as potential solvent for extraction of phenolic compounds from olive leaves: extraction optimization and solvent characterization, Food Chem., 2021, 352, 129346 CrossRef PubMed.
- M. Moreno-González and M. Ottens, A Structured Approach to Recover Valuable Compounds from Agri-food Side Streams, Food Bioprocess Technol., 2021, 14, 1387–1406 CrossRef.
- U. Takahama, Y. Koga, S. Hirota and R. Yamauchi, Inhibition of xanthine oxidase activity by an oxathiolanone derivative of quercetin, Food Chem., 2011, 126, 1808–1811 CrossRef CAS PubMed.
- Y. Wang, G. Zhang, J. Yan and D. Gong, Inhibitory effect of morin on tyrosinase: Insights from spectroscopic and molecular docking studies, Food Chem., 2014, 163, 226–233 CrossRef CAS PubMed.
- M. Fan, G. Zhang, J. Pan and D. Guo, An inhibition mechanism of dihydromyricetin on tyrosinase and the joint effects of vitamins B6, D3 or E, Food Funct., 2017, 8(7), 2601–2610 RSC.
- L. Han, C. Fang, R. Zhu, Q. Peng, D. Li and M. Wang, Inhibitory effect of phloretin on α-glucosidase: Kinetics, interaction mechanism and molecular docking, Int. J. Biol. Macromol., 2017, 95, 520–527 CrossRef CAS PubMed.
- L. Qiu, Q. H. Chen, J. X. Zhuang, X. Zhong, J. Zhou, Y. Guo and Q. Chen, Inhibitory effects of α-cyano-4-hydroxycinnamic acid on the activity of mushroom tyrosinase, Food Chem., 2009, 112(3), 609–613 CrossRef CAS.
- B. K. Paul, D. Ray and N. Guchhait, Unraveling the binding interaction and kinetics of a prospective anti-HIV drug with a model transport protein: results and challenges, Phys. Chem. Chem. Phys., 2013, 15(4), 1275–1287 RSC.
- L. Wang, Y. Qin, Y. Wang, B. Liu and Y. Zhou, A pair of homoisoflavonoid analogues (6-aldehydo-isoophiopogonanone A/6-aldehydo-isoophiopogonanone B) from Ophiopogon japonicas as a tyrosinase inhibitor: inhibitory activity, conformational change and mechanism, Eur. Food Res. Technol., 2022a, 248, 553–565 Search PubMed.
- S. Li, J. Pan, G. Zhang, J. Xu and D. Gong, Characterization of the groove binding between di-(2-ethylhexyl) phthalate and calf thymus DNA, Int. J. Biol. Macromol., 2017, 101, 736–746 CrossRef CAS PubMed.
- C. Zhang, G. Zhang, Y. Liao and D. Gong, Myricetin inhibits the generation of superoxide anion by Reduced form of xanthine oxidase, Food Chem., 2017, 221, 1569–1577 CrossRef CAS PubMed.
- E. Yuriev and P. A. Ramsland, Latest developments in molecular docking: 2010–2011 in review, J. Mol. Recognit., 2013, 26, 215–239 CrossRef CAS PubMed.
- O. Trott and A. J. Olson, AutoDock Vina: improving the speed and accuracy of docking with a new scoring function, efficient optimization, and multithreading, J. Comput. Chem., 2010, 31, 455–461 CAS.
- C. Yuan, D. S. Thomas, J. M. Hook, G. Qin, K. Qi and J. Zhao, Molecular Encapsulation of Eucalyptus staigeriana Essential Oil by Forming Inclusion Complexes with Hydroxypropyl-β-Cyclodextrin, Food Bioprocess Technol., 2019, 12, 1264–1272 CrossRef CAS.
- Z. Wang, J. Liu, X. Zhong, J. Li, X. Wang, L. Ji and X. Shang, Rapid Characterization of Chemical Components in Edible Mushroom Sparassis crispa by UPLC-Orbitrap MS Analysis and Potential Inhibitory E ects on Allergic Rhinitis, Molecules, 2019b, 24, 3014 Search PubMed.
- E. Mutt and R. Sowdhamini, Molecular Dynamics Simulations and Structural Analysis to Decipher Functional Impact of a Twenty Residue Insert in the Ternary Complex of Mus musculus TdT Isoform, PLoS One, 2016, 11, e0157286 CrossRef PubMed.
- L. Yuno, L. Joong-Jae, K. Songmi, L. Sang-Chul, J. Han, H. Woosung, P. Keunwan, K. H. Jung, C. Hae-Kap, K. Dongsup, K. Hak-Sung and W. L. Keun, Dissecting the critical factors for thermodynamic stability of modular proteins using molecular modeling approach, PLoS One, 2014, 9(5), e98243 CrossRef PubMed.
| This journal is © The Royal Society of Chemistry 2022 |