
 Open Access Article
 This Open Access Article is licensed under a Creative Commons Attribution-Non Commercial 3.0 Unported Licence
Detection and discrimination of sulfur dioxide using a colorimetric sensor array†
Chaoqiang Dinga,
Yan Rena,
Xinyang Liua,
Jingjing Zenga,
Xinping Yua,
Daxiang Zhoua and
Yanjie Li *ab
*ab
aCollege of Biology and Food Engineering, Chongqing Three Gorges University, Wanzhou, Chongqing 404100, P. R. China. Fax: +86 23 5810 2522; Tel: +86 23 5810 2522
bEngineering Technology Research Center for the Development and Utilization of Characteristic Biological Resources in Northeast Chongqing, Chongqing Three Gorges University, Wanzhou, Chongqing 404100, P. R. China. E-mail: 20060016@sanxiau.edu.cn
First published on 13th September 2022
Abstract
Discrimination and detection of sulfur dioxide residues in foods using a simple colorimetric array have been achieved. The difference maps before and after the reaction showed that the specific color fingerprint was related to the amount of sulfur dioxide. The results of principal component analysis (PCA), hierarchical clustering analysis (HCA) and linear discriminant analysis (LDA) demonstrated that the as-fabricated colorimetric sensor array have good performance for the discrimination of sulfur dioxide and other interferents, as well as different concentrations of sulfur dioxide. Moreover, the array has been successfully applied to determine the concentration of sulfur dioxide residues in real samples and revealed good accuracy, precision and repeatability.
1. Introduction
Sulfur dioxide in food mainly comes from permissible, legal, direct addition and sulfur-fumigation. Sulfur-fumigation, a process of Traditional Chinese Medicine (TCM) to prolong the storage period, mainly protects herbs from insects and molds.1 In addition, sulfur-fumigation can also improve the appearance of TCM or foods through a whitening effect. Excessive sulfur dioxide residues lead to potential health risks through excessive or irregular use of sulfur-fumigation. Studies that indicate the excessive residues of sulfur dioxide not only induce respiratory system damage,2 but also irreversible damage to reproductive system,3 digestive system,4 circulatory system,5 nervous system6 and immune system,7 and even life-threatening.8 More significantly, residual sulfur dioxide is prone to chemical reactions with ketones and hydroxyl groups in some herbs and foods, resulting in the loss of active ingredients.9,10As consumers pay more and more attention to food and drug safety, there are more and more calls to cancel sulfur-fumigation. Since the Chinese Pharmacopeia 2005 version, sulfur-fumigation had been prohibited for all herbals during storage and processing.11 Further, the residue limit standard for sulfur dioxide was firstly stipulated for herbals and tablets in China Pharmacopoeia 2010 edition (2nd supplement).12 Likewise, according to GB 5009.34-2016 Chinese National Food Safety Standard-Determination of sulfur dioxide in foodstuffs, sulfur-fumigation was currently only permitted for several foods, and the maximum residue limit (in terms of residual sulfur dioxide) was clearly stated.13 However, the attractive appearance of raw herbs is easier to close the deal and bring additional benefits, and improper use, abuse and even illegal use of sulfur-fumigation are still not uncommon. In particular, in addition to TCM, it has been reported that the sulfur-fumigation process has been illegally used in many foods and food ingredients (e.g., star anise, pepper, wolfberry, ginger, fungus and tremella).10,14
Currently, the pharmacopoeias and food laws of many countries and regions have stipulated the limits of sulfur dioxide residues and recommended a variety of detection methods for sulfur dioxide residue, such as spectrophotometry,15 acid–base titration,16 fluorescence method,17,18 gas chromatography-mass spectrometry,19 high-performance liquid chromatography,20 electrochemical analysis,21 enzyme-linked immunosorbent assays22 and Fourier-transform infrared spectroscopy.23 Although the above-mentioned means exhibit high sensitivity and selectivity, their popularization and application are generally limited by high costs, unfriendly portability, complex sample pretreatment, and specialized technical training in some developing countries and regions.
Besides that, on-site detection has always been a difficult problem and challenge for the above conventional analysis methods. Therefore, it is necessary to develop a simple, sensitive and easy on-site detection approach for sulfur dioxide residues.
Based on the principle of bionics,24 a typical colorimetric sensor array is designed as follows: a series of specific chromatic reactions are selected or designed to form a cross-responsive colorimetric array, and the detection of the analytes is achieved through the corresponding color fingerprints. At present, some studies reported that the colorimetric sensor array has been successfully used for the detection of pesticide residue and the analysis of sensory quality in food.25–29
In this work, an improvised and inexpensive colorimetric sensor array for detecting sulfur dioxide was developed on the base of six specific and high-sensitive color reactions. The assessment of availability and practicability of the colorimetric array was reached through principal component analysis (PCA), hierarchical cluster analysis (HCA) and linear discriminant analysis (LDA). And the determination of sulfur dioxide content in real samples was achieved by the method of fitting curve.
2. Experimental details
2.1 Reagents and materials
All chemicals from commercial sources are of analytical grade and used as received without further purification unless otherwise specified. Sulfur dioxide detection kits (in view of hydrochloric para-rosaniline method) were purchased from Ruixin Technological Instrument Co., Ltd (Shanghai, China). Sodium sulfite, brilliant green, malachite green, basic fuchsin, O-phthalaldehyde, ammonium acetate, 1,10-phenanthroline, ferric chloride, hexadecyl trimethyl ammonium bromide (CTAB), phosphate-buffered saline (PBS), borax, sodium acetate, acetic acid, sodium hydroxide and absolute alcohol were provided by Aladdin Biochemical Technology Co., Ltd (Shanghai, China). Deionized water was used throughout this work.1.0 mL brilliant green (80 μg mL−1) and malachite green (46.34 μg mL−1) were prepared separately by directly dissolving in PBS (10 mM, pH 7.0). 0.5 mL basic fuchsin (55 μg mL−1) was diluted to 2.0 mL with borax buffer (1.47 mM, pH 9.16). 0.5 mL o-phthalaldehyde (1.34 × 10⁻² μg mL−1) and 0.5 mL ammonium acetate (3.85 × 10⁻³ μg mL−1) were mixed and diluted to 2.0 mL with potassium dihydrogen phosphate buffer (4 mM, pH 6.6). A mixture of 0.3 mL 1,10-phenanthroline (3.6 × 10⁻³ μg mL−1), 0.05 mL ferric chloride (3.24 × 10⁻³ μg mL−1) and 0.5 mL CTAB (0.5%) was diluted to 2.0 mL with sodium acetate anhydrous solution (0.5 mM, pH 5.5). The reagents of the sulfur dioxide detection kit were dissolved in PBS (10 mM, pH 7.0) according to the kit instructions. Sodium sulfite was dissolved in deionized water (5.0 g L−1) before use and immediately mixed with formaldehyde (1% final concentration). Note that all the reagents mentioned above were freshly prepared before the experiments to minimize their potential effects of hydrolysis.
Fritillaria cirrhosa D. Don is a common edible and medicinal plant in many countries and regions. Fritillaria samples without sulfur dioxide residue were purchased from a local traditional Chinese medicine (TCM) pharmacy in Chongqing, China, and analyzed by iodine titration (according to Chinese National Standard GB 5009.34-2016) and proven to meet the requirements.13
2.2 Instrumentation
Image acquisition of the array was performed with a smartphone (Apple iPhone 13). Pipettors were bought from Eppendorf (Hamburg, Germany). A Costar 96-well EIA plate was purchased from Corning Inc. (Corning, NY, USA). BSA224S-CW electronic analytical balance was provided by Sartorius Scientific Instrument Co., LTD (Goettingen, Germany). BA-FZL6 automatic distiller was from Bayue Instrument Co., LTD (Changsha, China). L50-50-20 LED array light sources were purchased from Machine Vision Light Sources Co., LTD (Guangzhou, China).2.3 Array response
Excess sulfur dioxide residues in food usually come from exogenous addition and sulfur-fumigation, etc. Generally, the residues of TCM and food raw material are mainly sulfur dioxide and sulfate substances after sulfur-fumigation. Residual sulfur dioxides are partially transformed to sulfites when encountering moisture from raw materials. Consequently, it is necessary to transform the remaining sulfur dioxide to sulfite through a hydration reaction before detection. Being very unstable, sulfite was protected by adding 1% formaldehyde and detected as soon as possible. The response points on the array were designed based on six specific color reactions that could occur with sulfite in conventional spectrophotometry.30–35 These specific reactions were shown in Fig. S1.† The residual amount of sulfur dioxide represents the sum of the residual amounts of sulfur dioxide and sulfite in the samples.2.4 Array analysis procedure
As shown in Fig. 1, the array analysis system consists of an array plate, an imaging system, and a personal computer. The supplementary light of the image is achieved through an LED array light source during image acquisition. The dimensions of each hole on the plate are 6 mm in diameter and 8 mm in height. The composition of the developed 1 × 6 array was summarized in Table S1.† The workflow of the array was as follows: 200 μL of each control solution was added to each well on the 1 × 6 array (point-to-point, one reaction corresponds to one well on the array) according to Table S1† and the “before” images were obtained by smartphone. A series of work solutions with final concentrations of 0, 1, 3, 5, 7, 10, 50, 100, 500 and 1000 μg mL−1 of sulfur dioxide were prepared (formulated with sodium sulfite). Similarly, work solutions were performed the same process as control solutions and the “after” images were acquired. Five replicates were performed separately. The correction of the image before and after the reaction and the removal of the background noise were performed through geometric correction and filtering. A normalized array image was generated by taking the spectral mean of the central region of each detected unit on the array as its spectral information code. The difference maps were achieved by subtracting the red, green and blue (RGB) values of the standard array images before and after. The RGB eigenvalues of each sensor unit were extracted and a 3N-dimensional difference vector was generated, where N was the total number of sensor units (for a 1 × 6 array, this difference vector was 18 dimensions). The total Euclidean distances (EDs) of the difference map were defined by the square root of the sums of the squares of the values of ΔR, ΔG and ΔB. | ||
| Fig. 1 Schematic diagram of the detection system, consisting of EIA plate-based 1 × 6 colorimetric sensor array, smartphone-based colorimetric reader and personal computer-based image data analysis system. Before image acquisition, the array plate was placed on the white bottom plate of a self-made paper darkroom. Additional illumination was provided by a LED array light source when taking photos. | ||
2.5 Analysis of real samples
1.00 g of Fritillaria was accurately weighed, crushed and transferred to 10 mL of PBS (0.01 M, pH 7.0). The supernatant of Fritillaria was collected after 2 min of shaking, 20 min of sonication, and 5 min of centrifugation at 12![[thin space (1/6-em)]](https://www.rsc.org/images/entities/char_2009.gif) 000 rpm. The detection solution of Fritillaria (i.e., real sample) was prepared by adding sulfur dioxide to final concentrations of 30, 60 and 90 μg mL−1, respectively. The spiked real samples were analyzed by the array analysis procedure described above. Simultaneously, the determination of sulfur dioxide residue of real samples was performed by iodine titration, which is the standard method documented in GB 5009.34-2016.13
000 rpm. The detection solution of Fritillaria (i.e., real sample) was prepared by adding sulfur dioxide to final concentrations of 30, 60 and 90 μg mL−1, respectively. The spiked real samples were analyzed by the array analysis procedure described above. Simultaneously, the determination of sulfur dioxide residue of real samples was performed by iodine titration, which is the standard method documented in GB 5009.34-2016.13
2.6 Data processing method and software
The image pretreatment and extraction of RGB values were performed using Matlab 2018a (Mathworks, Natick, MA, USA) and Photoshop CS4 (Adobe, San Jose, California, USA). All data statistics and diagram plotting were achieved based on SPSS 22.0 (IBM Corp., Armonk, N. Y., USA) and OriginPro 2021 Learning Edition (Origin Lab Corp., Northampton, MA, USA).3. Results and discussion
3.1 Availability assessment of array
Based on the difference map of the array's six response points, a 6 × 3-dimensional dataset was obtained by extracting the color values of the RGB space, which could be seen as a nonlinear mapping from low-dimensional space to high-dimensional space. According to Cover's theorem, linear separability is more likely to be achieved in high dimensional space, which indicates that the proposed array has a high ability to achieve differentiation.36 Therefore, the as-fabricated array has a high-resolution ability in theory, which has the ability to achieve the discrimination of slight color differences.Some components of real samples or reaction buffer solutions are likely to affect the response of the colorimetric sensor array. To evaluate the specificity of the colorimetric sensor array, several common components, including PBS, organic acids (e.g., vitamin C), amino acids (e.g., glutamic acid), sugars (e.g., glucose) and metal ions (e.g., K+ and Na+), were designate as interferents and detected by the proposed array.37,38 After adding high concentration interferents, there is no visible difference (i.e., ΔR, ΔG and ΔB approach zero) through the comparison of the array response image before and after the reaction [Fig. S2(a)†]. Compared with the difference maps of interferents, the difference maps of the mixed group (interferents & sulfur dioxide) have obvious color changes, and the colors of difference maps between mixed groups are visually consistent [Fig. S2(b)†]. Moreover, the Euclidean distance of the difference maps had no significant difference between different interferents and between different mixed groups (Fig. 2). As shown in Fig. 3, there are visible differences between the difference maps of sulfur dioxide at different concentrations, and the results of multiple repeated trials show that there is no visible color change between the difference maps of the same concentration of sulfur dioxide. It indicates that the as-fabricated sensor exhibits a good availability and has a potential application for the detection of sulfur dioxide.
 | ||
Fig. 2 Response of as-fabricated arrays to various potential interferents (final concentration of 100 μg mL−1) in the absence (orange bars) and presence (yellow bars, final concentration of 10 μg mL−1) of sulfur dioxide (![[X with combining macron]](https://www.rsc.org/images/entities/i_char_0058_0304.gif) ± S). The error bars show the standard deviation of quintuplicate experiments. Different italic letters in the figure indicate significant differences between groups at the 0.05 level using one-way ANOVA and Tukey's test. ± S). The error bars show the standard deviation of quintuplicate experiments. Different italic letters in the figure indicate significant differences between groups at the 0.05 level using one-way ANOVA and Tukey's test. | ||
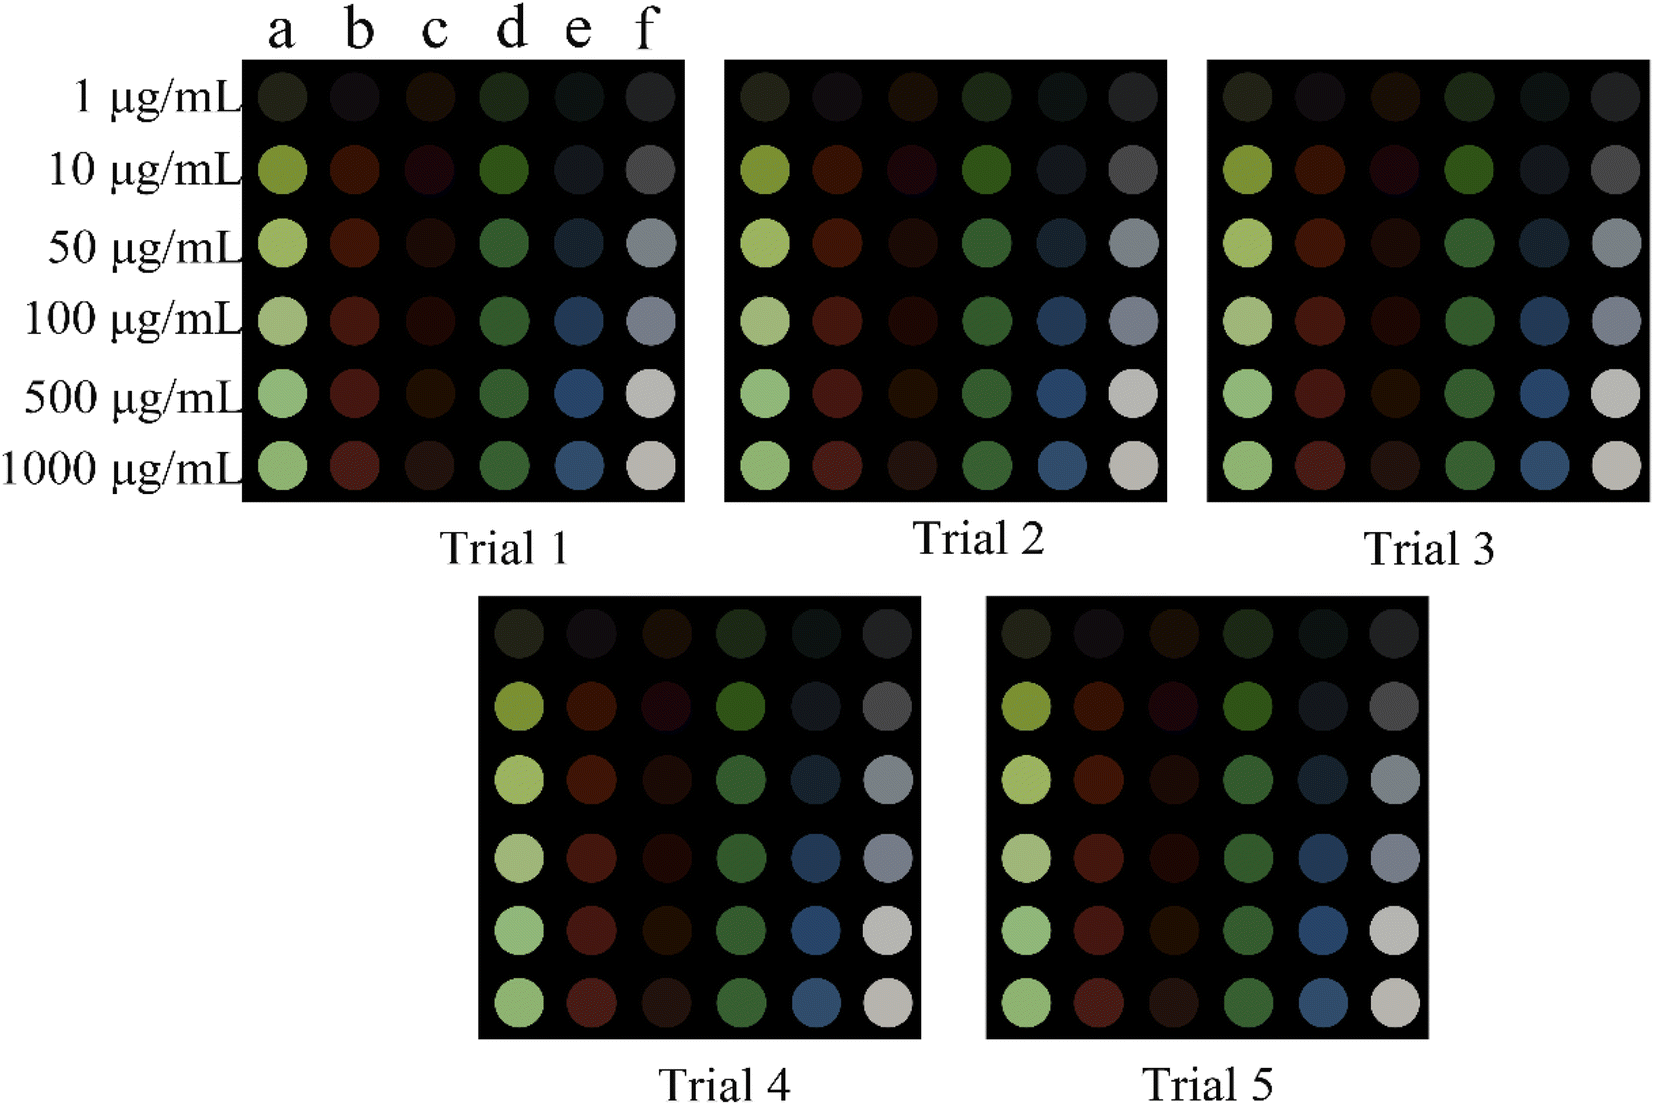 | ||
| Fig. 3 Color difference maps of the array for sulfur dioxide at different concentrations. (a) Hydrochloric para-rosaniline, (b) brilliant green, (c) malachite green, (d) basic fuchsin, (e) OPA, (f) 1,10-phenanthroline and Fe3+. All of the experiments were performed in quintuplicate. | ||
3.2 Qualitative analysis of sulfur dioxide by the array
To achieve a quantitative comparison of the color change of the array, the R, G and B value was extracted and designated as feature information. A 6 × 3-dimensional dataset was obtained and used for subsequent analysis. Because of the dispersive and nonlinear characteristics of image data, principal component analysis (PCA) and hierarchical cluster analysis (HCA) were respectively performed to explore the dispersion and aggregation tendencies of samples on account of the spatial structure of eigenvalues.39,40The scatter plot of PCA shows that there is a trend toward clusters mainly along PC1 between sulfur dioxide and other components (Fig. S3†). The PC1 and PC2 explain 99.67% and 0.20% of total variance respectively, and the total cumulative variance reaches 99.87%. From Fig. 4, similar to PCA, the diagram of HCA has the ability to completely separate interferent groups from mixed groups (contains interferents with a final concentration of 100 μg mL−1 and sulfur dioxide with a final concentration of 10 μg mL−1). Similar results were obtained by multiple random repeated sampling. In conclusion, it suggests that the array shows good specificity and selectivity.
 | ||
| Fig. 4 Dendrogram of HCA of different interferents with and without sulfur dioxide. The final concentrations of interferents (e.g., blank, Na+, K+, PBS, vitamin C, glutamic acid, glucose) and sulfur dioxide were 100 μg mL−1 and 10 μg mL−1, respectively. | ||
To evaluate the response and discrimination of capacity to the amount of sulfur dioxide, a series of sample solutions of sulfur dioxide with final concentrations of 0, 10, 50, 100, 500 and 1000 μg mL−1 were accurately prepared and measured through the array. As shown in Fig. S4,† the 2-dimensional plot of PCA shows that the samples appear a clear cluster trend, just associated with seven concentrations of sulfur dioxide. The PC1 and PC2 explain 98.63% and 1.35% of total variance respectively and the total cumulative variance reaches 99.98%. From Fig. 5, the same result is also observed through the HCA diagram. Similar results were obtained with repeated sampling. It illustrates that the as-fabricated array has the ability to discriminate different amounts of sulfur dioxide. Predictably, combined with an automatic classifier based on a pattern recognition algorithm, it reaches a rapid screening of whether the sulfur dioxide residues of real samples exceed the standard.
 | ||
| Fig. 5 Cluster diagram of the response of different sulfur dioxide concentrations. All of the experiments were performed in quintuplicate. | ||
As a common pattern recognition algorithm, the main idea of linear discriminant analysis (LDA) is as follows: the labeled training datasets are projected onto a straight line so that the data projection points of the same type of label are as close as possible and the data projection points of different types of labels are as far away as possible.41 Then, the test data sets are projected to the same line, and the label type of the test data is determined according to the position of the projection point. Unlike PCA and HCA, LDA takes full account of the label information of the sample and has the ability to achieve predictive analysis.
A series of sulfur dioxide with final concentrations of 1, 10, 50, 100, 500 and 1000 μg mL−1 were p prepared, respectively. Five samples and two samples were randomly selected from each concentration of sulfur dioxide and designated as training samples and test samples respectively. Therefore, thirty training datasets (RGB values) and twelve testing datasets (RGB values) were obtained by the as-fabricated array. As shown in Fig. 6, the test samples are successfully assigned to the training sample groups according to the different concentrations of sulfur dioxide. The prediction performance of LDA is consistent after multiple random sampling.
 | ||
| Fig. 6 Discriminant diagram of response to different sulfur dioxide concentrations. Five samples and two samples were randomly selected from each concentration of sulfur dioxide, and there were thirty training sets and twelve testing sets. | ||
3.3 Quantitative analysis of sulfur dioxide by the array
The relationship between the color changes of the array [defined by the total Euclidean distances (EDs)] and the concentrations of sulfur dioxide was observed by scatter plot. As shown in Fig. 7, EDs versus sulfur dioxide concentration shows a linear range of 1 to 1000 μg mL−1, and a good linearity range from 1 to 10 μg mL−1 (inset of Fig. 7). It indicates the as-fabricated colorimetric sensor array has the potential to achieve the quantitative analysis of sulfur dioxide through the corresponding fitting curve. A LOD of 0.406 μg mL−1 calculated by the 3σ rule was reach through the literature.42 From Chinese National Standard GB 5009.34-2016,13 the limits of detection (LOD) of sulfur dioxide are 1.5 μg mL−1 by distillation titration. In addition, by comparison with the detection limit of conventional detection methods (Table S2†). It demonstrates that the as-fabricated colorimetric sensor array has an excellent linear region at low concentration range of sulfur dioxide and a low LOD. | ||
| Fig. 7 A trend of total Euclidean distance (EDs) of the array and different concentration of sulfur dioxide ( ± S). Inset: the linear relationship in the logarithm of sulfur dioxide concentration from 1 to 10 μg mL−1. Error bars shows five parallel measurements. | ||
3.4 Comparison of detection of sulfur dioxide in real samples by the array and distillation titration
Three real samples (Fritillaria) extracts containing the final concentration of 30, 60, and 90 μg mL−1 of sulfur dioxide were prepared and tested simultaneously by the proposed array and distillation titration according to Chinese National Standard GB 5009.34-2016.13 The difference maps of spiked samples show specific color fingerprints during repeated experiments (Fig. S5†). From Fig. 8, there is no significant difference between the test results of the array and distillation titration by paired t-tests. It indicates that the as-fabricated array shows a potential application for the detection of sulfur dioxide. Although the distillation titration is simple to operate, the analysis is time-consuming and lead-containing detection reagents have the risk of environmental pollution.43 Due to simple operation, less time-consuming, good specificity and relatively low risk of environmental pollution, the as-fabricated array shows potential to replace distillation titration for sulfur dioxide detection. | ||
| Fig. 8 Comparison of colorimetric senor array and distillation titration for the detection of sulfur dioxide ( ± S). The same lowercase letter indicates that the test results of the two methods are not significantly different at the 0.05 level by paired t-test. | ||
3.5 Evaluation of accuracy, precision and repeatability
Extracts of Fritillaria with a final concentration of sulfur dioxide of 30, 60 and 90 μg mL−1 were prepared and determined quantitatively by the array and fitting curve. Samples of the same concentration were prepared in sextuplicate, and then there were a total of eighteen spiked samples. Each spiked sample was measured once to assess accuracy and precision, and a spiked sample was randomly selected from different concentration groups and measured continuously for six times to assess reproducibility. Accuracy was expressed as mean value ± standard deviation (STD/SD) and relative recovery (RR). Precision (intra-assay) and reproducibility were evaluated via relative standard deviations (RSD). As can be seen from Table 1, the results show that the recovery and RSD value of sulfur dioxide is in the range of 97–103% and 2.16–4.97%, respectively. It states clearly that the array develops a cost-effective and potential method for the quantitative analysis of sulfur dioxide in real sample with the good performance of accuracy, precision and reproducibility.| Spiked sulfur dioxide concentration (μg mL−1) | Accuracy | Precision RSD, % | Repeatability RSD, % | |
|---|---|---|---|---|
| Mean ± STD (μg mL−1) | Recover rate, % | |||
| a Note: STD, standard deviation; RSD, relative standard deviation. | ||||
| 30 | 28.86 ± 1.14 | 93.06–100.43 | 3.95 | 4.32 |
| 60 | 60.10 ± 2.75 | 95.93–105.05 | 4.58 | 3.27 |
| 90 | 91.93 ± 4.57 | 97.06–107.21 | 4.97 | 2.16 |
4. Conclusions
Excess sulfur dioxide residues in some food or TCM on the market are possibly added by sulfur-fumigation. The main residual components after sulfur-fumigation are divided into sulfur dioxide and sulfites, and sulfur dioxide is easily transformed to sulfites. Here sulfite was chosen as the detection target for the proposed array reaction.A simple, inexpensive and practical colorimetric sensor array based on commercially available reagents and six specific chemical reactions for the detection and discrimination of sulfur dioxide was developed in this work. The results of PCA and HCA reveal that the sensor array can achieve the identification and differentiation of sulfur dioxide from other potentially interferents. Moreover, semi-quantitative and quantitative detection of sulfur dioxide also has the capacity to be achieved through corresponding pattern recognition and curve fitting. And crucially, the as-fabricated array also shows potential applications for the detection of sulfur dioxide in real samples and exhibits good accuracy, precision and repeatability.
Conflicts of interest
All authors declare that we have no conflict of interest.Acknowledgements
This work was financially supported by Science and Technology Bureau of Wanzhou, Chongqing, China (No. WZSTC20210313), National Innovation and Entrepreneurship Training Program for College Students (202010643003), Natural Science Foundation of Chongqing (No. cstc2021jcyj-msxmX0924) and sharing fund of Engineering Technology Research Center for the Development and Utilization of Characteristic Biological Resources in Northeast Chongqing.References
- X. Jiang, L. F. Huang, S. H. Zheng and S. L. Chen, Phytomedicine, 2013, 20, 97–105 CrossRef CAS.
- A. Vehapoğlu, E. Çakır, S. Uzuner, F. Çalım Ö and H. Yazan, Turkish archives of otorhinolaryngology, 2020, 58, 286–288 CrossRef PubMed.
- E. I. Zaki, A. R. El-Mahdy, H. M. El-Gamal and A. S. El-Seedy, Cell. Mol. Biol., 2021, 67, 66–75 CrossRef PubMed.
- J. Jiang, S. Xiao, S. Yan, J. Zhang and X. Xu, J. Ethnopharmacol., 2020, 249, 112377 CrossRef CAS PubMed.
- J. Y. Zhan, P. Yao, C. W. Bi, K. Y. Zheng, W. L. Zhang, J. P. Chen, T. T. Dong, Z. R. Su and K. W. Tsim, Phytomedicine, 2014, 21, 1318–1324 CrossRef CAS PubMed.
- Y. Huang, H. Zhang, B. Lv, C. Tang, J. Du and H. Jin, Antioxid. Redox Signaling, 2022, 36, 256–274 CrossRef CAS.
- T. D'Amore, A. Di Taranto, G. Berardi, V. Vita, G. Marchesani, A. E. Chiaravalle and M. Iammarino, Compr. Rev. Food Sci. Food Saf., 2020, 19, 2701–2720 CrossRef PubMed.
- H. Feng, J. Liu, A. Qaitoon, Q. Meng, Y. Sultanbawa, Z. Zhang, Z. P. Xu and R. Zhang, TrAC, Trends Anal. Chem., 2021, 136, 116199 CrossRef CAS.
- M. Kong, H. H. Liu, J. Wu, M. Q. Shen, Z. G. Wang, S. M. Duan, Y. B. Zhang, H. Zhu and S. L. Li, J. Ethnopharmacol., 2018, 212, 95–105 CrossRef CAS PubMed.
- C. Y. Wu, M. Kong, W. Zhang, F. Long, J. Zhou, S. S. Zhou, J. D. Xu, J. Xu and S. L. Li, Food Chem., 2018, 239, 953–963 CrossRef CAS PubMed.
- Chinese Pharmacopeia Commission, Pharmacopoeia of the People's Republic of China, Chinese Medical Science and Technology Press, Beijing, China, 2005 Search PubMed.
- Chinese Pharmacopeia Commission, Pharmacopoeia of the People's Republic of China, Chinese Medical Science and Technology Press, Beijing, China, 2010 Search PubMed.
- National Health and Family Planning Commission of China, National Food Safety Standard-Determination of Sulfur Dioxide in Foodtuffs GB 5009.34-2016, Standards Press of China, Beijing, China, 2017 Search PubMed.
- D. Han, T. Luo, L. Zhang, J. Wu, H. Wu, Z. Wu, J. Li, J. Wang and X. Pan, Food Sci. Nutr., 2020, 8, 2827–2838 CrossRef CAS PubMed.
- A. Skok, Y. Bazel and A. Vishnikin, J. Sulfur Chem., 2022, 43, 443–471 CrossRef CAS.
- L. A. N. Dayao, C. C. Liu, S. Y. Hsu, L. L. Tayo, W. J. Ju and L. M. Fu, Anal. Chim. Acta, 2019, 1071, 44–52 CrossRef CAS PubMed.
- Q. Hu, R. Guo, L. Zhang, Q. Liu, S. Cai and W. Lin, Luminescence, 2021, 36, 1006–1012 CrossRef CAS PubMed.
- X. Bao, X. Cao, Y. Yuan, B. Zhou and C. Huo, J. Agric. Food Chem., 2021, 69, 4903–4910 CrossRef CAS PubMed.
- C. Kang, D. Zhao, L. Kang, S. Wang, C. Lv, L. Zhou, J. Y. Jiang, W. Yang, J. Li, L. Q. Huang and L. Guo, Front. Plant Sci., 2018, 9, 790 CrossRef.
- B. Lajin and W. Goessler, Anal. Chim. Acta, 2019, 1092, 1–8 CrossRef CAS PubMed.
- H. Park, H. D. Lim, H.-K. Lim, W. M. Seong, S. Moon, Y. Ko, B. Lee, Y. Bae, H. Kim and K. Kang, Nat. Commun., 2017, 8, 14989 CrossRef.
- Y. Lv, R. Wu, K. Feng, J. Li, Q. Mao, H. Yuan, H. Shen, X. Chai and L. Li, J. Nanobiotechnol., 2017, 15, 35 CrossRef PubMed.
- H. Yan, P. H. Li, G. S. Zhou, Y. J. Wang, B. H. Bao, Q. N. Wu and S. L. Huang, Food Chem., 2021, 341, 128241 CrossRef CAS PubMed.
- N. A. Rakow and K. S. Suslick, Nature, 2000, 406, 710–713 CrossRef CAS PubMed.
- M. R. Mirghafouri, S. Abbasi-Moayed, F. Ghasemi and M. R. Hormozi-Nezhad, Anal. Methods, 2020, 12, 5877–5884 RSC.
- Y. Zhu, J. Wu, L. Han, X. Wang, W. Li, H. Guo and H. Wei, Anal. Chem., 2020, 92, 7444–7452 CrossRef CAS PubMed.
- L. Yan-Qi and F. Liang, Chin. J. Anal. Chem., 2020, 48, 1448–1457 Search PubMed.
- S. Sun, S. Qian, J. Zheng, Z. Li and H. Lin, Analyst, 2020, 145, 6968–6973 RSC.
- S. Qian, Y. Wang and H. Lin, Talanta, 2018, 181, 305–310 CrossRef PubMed.
- Z. Ma, L. Gu, L. Zeng and J. Li, Sci. Technol. Food Ind., 2012, 33, 72–74 Search PubMed.
- S. K. Goyal, J. Environ. Monit., 2001, 3, 666–670 RSC.
- X. Bao, X. Cao, Y. Yuan, B. Zhou and C. Huo, Journal of Agricultural, 2021, 69, 4903–4910 CAS.
- N. Huo, D. Li, S. Zheng and W. Deng, Chem. Eng. J., 2022, 432, 134317 CrossRef CAS.
- Y. Xiong, Q. Wang, X. Li, S. Fang and M. Duan, Chromatographia, 2018, 81, 1003–1011 CrossRef CAS.
- A. Shahvar, M. Saraji, H. Gordan and D. Shamsaei, Talanta, 2019, 197, 578–583 CrossRef CAS PubMed.
- T. M. Cover, IEEE Trans. Electron. Comput., 1965, 3, 326–334 Search PubMed.
- M. Sundhoro, S. R. Agnihotra, B. Amberger, K. Augustus, N. D. Khan, A. Barnes, J. BelBruno and L. Mendecki, Food Chem., 2021, 344, 128648 CrossRef CAS PubMed.
- M. Bener, F. B. Şen and R. Apak, Spectrochim. Acta, Part A, 2020, 226, 117643 CrossRef CAS PubMed.
- D. Cozzolino, A. Power and J. Chapman, Food Anal. Methods, 2019, 12, 2469–2473 CrossRef.
- D. Granato, J. S. Santos, G. B. Escher, B. L. Ferreira and R. M. Maggio, Trends in Food Science Technology, 2018, 72, 83–90 CrossRef CAS.
- H. Ma, J. Yan, Y. Li, C. Zhang and H. Lin, Acta Geophys., 2019, 67, 109–121 CrossRef.
- Y. H. Lin and W. L. Tseng, Chem. Commun., 2009, 43, 6619–6620 RSC.
- B. Lajin and W. Goessler, Anal. Chim. Acta, 2019, 1092, 1–8 CrossRef CAS PubMed.
Footnote |
| † Electronic supplementary information (ESI) available. See https://doi.org/10.1039/d2ra04251g |
| This journal is © The Royal Society of Chemistry 2022 |