
 Open Access Article
 This Open Access Article is licensed under a Creative Commons Attribution-Non Commercial 3.0 Unported Licence
A new fluorescent boronic acid sensor based on carbazole for glucose sensing via aggregation-induced emission†
Mandana Oloub a,
Rahman Hosseinzadeh*a,
Mahmood Tajbakhsha and
Maryam Mohadjeranib
a,
Rahman Hosseinzadeh*a,
Mahmood Tajbakhsha and
Maryam Mohadjeranib
aDepartment of Organic Chemistry, Faculty of Chemistry, University of Mazandaran, Babolsar, Iran. E-mail: r.hosseinzadeh@umz.ac.ir
bDepartment of Molecular and Cell Biology, Faculty of Basic Sciences, University of Mazandaran, Babolsar, Iran
First published on 14th September 2022
Abstract
A water-soluble fluorescent sensor based on carbazole pyridinium boronic acid (CPBA) was designed and synthesized. Its structure has been confirmed by CHN and 1H and 13C NMR, FT-IR, and MS spectral data. Fluorescence studies of the synthesized chemosensor CPBA showed a selective ratiometric fluorescent response for glucose among different monosaccharides. The results specified that CPBA is a pH-sensitive sensor that behaves differently in the absence and presence of glucose in the pH range 4–10. The pH, DLS, Job's plot, UV-visible, and fluorescence titration studies showed that the selectivity of CPBA towards glucose is through the aggregation-induced emission (AIE) phenomenon. The fluorescence emission intensity of CPBA changes by more than 2100 fold by adding glucose, whereas it is 2 fold for fructose. The calculated binding constant value of CPBA for glucose (K = 2.3 × 10⁶ M−1) is 85 times greater than for fructose, indicating the high affinity of the sensor for glucose.
1. Introduction
Life depends on the existence of carbohydrates. Even though monosaccharides are essential for functioning of living systems, they can also cause severe diseases. In tissues and cells, glucose is the most abundant source of energy.1 Diabetes mellitus, which is a serious global health issue brought about by impaired glucose feedback regulation, can lead to many complications such as heart disease, kidney failure, and blindness.2,3The development of an efficient glucose detection system offers a capable approach to monitoring diabetes. Methods including enzyme-based sensors and electrochemical techniques have been applied for monitoring D-glucose.4,5 Most of these processes rely heavily on the properties of the supporting material for the immobilization of the enzyme glucose oxidase (GOx). Because environmental changes can readily denature enzymes, in addition to providing a suitable immobilization environment, supporting material should have a sustained biological activity.6,7 However, synthesized chemical sensors have been much more stable and widely used to detect carbohydrates. Since boronic acids form reversible five- or six-membered cyclic boronic esters with cis-1,2- or 1,3-diols of carbohydrates, the fabrication of boronic acid fluorescent sensors has received considerable interest among scientists recently.8
In general, it is known that the sensitivity and selectivity of monoboronic acids are superior towards fructose compared to glucose.1,9 Introducing multiple boronic acid groups in the structure of receptors is an approach to increasing the glucose selectivity. However, it is associated with some limitations, including difficult synthesis procedures, low water-solubility of some sensors, difficulty in fluorescence imaging for fluorescence quenched analytes, and the possibility of interference of analogues with the determination of the real sample.10 Boronic acid-based supramolecular assemblies are another approach to increasing the glucose selectivity. In these aggregation-based probes, two mechanisms mainly work (1) aggregation-caused quenching (ACQ), whereby fluorogens can emit a strong fluorescence in monomeric form but progressively lose fluorescence when they are in aggregate states; and (2) aggregation-induced emission (AIE) that fluorogen at dilute concentration is almost nonemission, but strong emission will be observed in the aggregate state.11
Carbazole has a rigid, planar structure with excellent optical and electronic donor properties.12 It has many applications in dye-sensitized solar cells, OLED applications, and detection of ions.13–15 Moreover, carbazole has been used widely as AIEgene.16,17 However, its application is limited in biological systems due to poor water solubility and short excitation and emission wavelengths.18 These disadvantages can be overcome by synthesizing water-soluble carbazole derivatives, which are capable exhibit an excimer emission wavelength in the visible region.
In continuation of our studies to develop efficient chemosensors for monosaccharides,19–21 here we report the synthesis of an amphiphilic monoboronic acid chemosensor (Fig. 1, CPBA) that demonstrates a selectively ratiometric AIE-based fluorescent response for glucose. It contains a hydrophilic part (pyridinium bromide) attached to a boronic acid receptor and a hydrophobic part (carbazole) as a fluorophore.
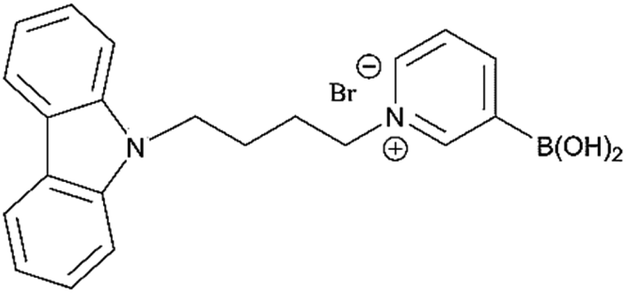 | ||
| Fig. 1 CPBA. | ||
2. Results and discussion
2.1. Synthesis and characterization
The sensor CPBA was designed and prepared according to the synthetic route in Scheme 1. Carbazole was simply treated with 1,4-dibromobutane in the presence of K2CO3 to generate bromobutyl carbazole (BBC). Although pyridine-3-ylboronic acid (PBA) is commercially available, it was synthesized from 3-bromopyridine and triisopropylborate in the presence of nBuLi followed by acid hydrolysis. Finally, BBC was treated with PBA in dry acetonitrile and THF to perform CPBA. The structure of CPBA is confirmed by CHN analysis and 1H and 13C NMR, FT-IR, and MS spectral data. At the 1H NMR spectrum, all expected signals were observed at appropriate chemical shifts. For example, CH2 hydrogens connected to the pyridinium ring are observed at a higher chemical shift (δ = 4.31 ppm) due to pyridinium's positive charge of nitrogen compared to the CH2 hydrogens attached to Br at BBC (δ = 3.41 ppm). In addition, observing the peak of 345.2 in the MS spectrum and also its fragmented peak of 301.1 (relating to B(OH)2 elimination)22 confirm the successful synthesis of CPBA (ESI)†.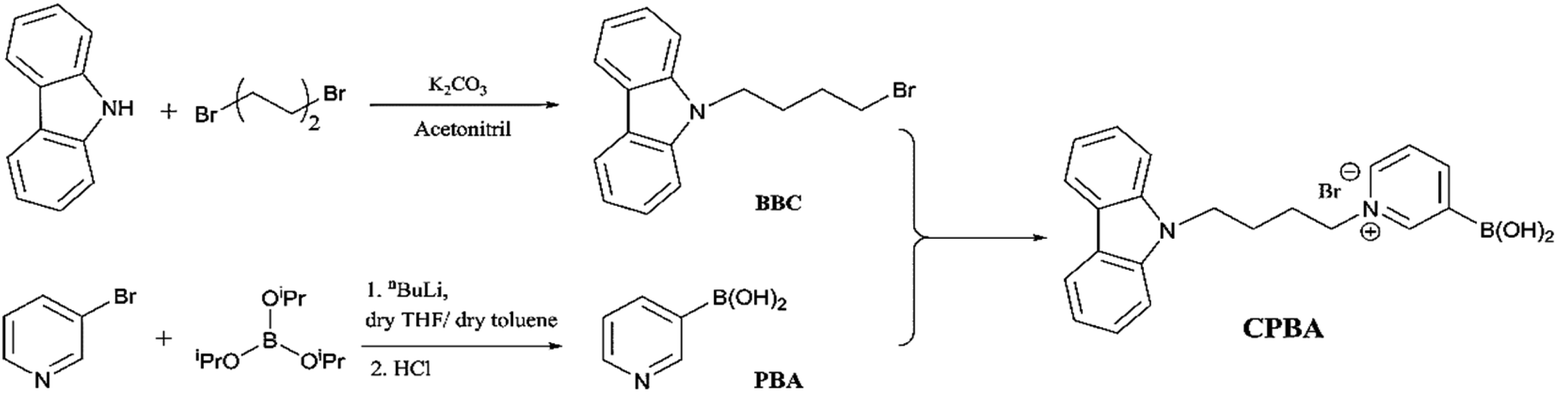 | ||
| Scheme 1 Synthetic route for CPBA. | ||
2.2. Optical properties
After the preparation and characterization of CPBA, the applicability of the sensor for monosaccharides was tested using fluorescent titration. For this purpose, aqueous solutions of CPBA and monosaccharides in distilled water (pH: 6.5) have been used. CPBA as a monoboronic acid showed enhanced fluorescence properties toward monosaccharides. As expected, fructose displayed the highest fluorescence enhancement (Fig. S1, ESI).† However, while no excimer emission was observed for the tested monosaccharides in the pH range 4–10, glucose in an alkaline medium shows significant excimer emission (Fig. 2, S2 and S4, ESI)†.The boronate formation of chemosensor depends on the hydroxide ion concentration. This pH-dependent property can influence the interaction of boronic acid group with monosaccharides.23 Therefore, the influence of pH variations on CPBA fluorescence characteristics was examined. Fluorescent emission of CPBA and CPBA in the presence of fructose and glucose at different pH values showed an excimer emission development only for the adding glucose at pH values greater than 8.5, indicating the selectivity of the chemosensor toward glucose (Fig. S2 a, b, and c, ESI).† The plot of the excimer to monomer emission intensity ratio in buffer solutions in various pH in the absence and presence of glucose is shown in Fig. 2a. In the absence of glucose, no excimer emission is seen. With adding glucose at a pH greater than 8.5, a significant excimer emission develops. This finding is in agreement with the result reported by James et al., which correlated the excimer emission to the particle/aggregate sizes observed for boronic acid sensor solutions with the addition of glucose.24 As depicted in Fig. 2b at pH 9.5, CPBA forms the maximum aggregates (mean size = 3450 nm), leading to a strong enhancement of excimer to monomer emission intensity ratio. Pyridinium cation–π interactions could be responsible for the aggregation of CPBA.25–27 Addition of glucose to CPBA solution leads to generating new aggregates from complexation of CPBA and glucose, resulting to stacking of the carbazole fluorophores and therefore displaying a large excimer emission. At lower pH CPBA produces smaller aggregates, and no excimer emission is observed. CPBA exists as free boronic acid at pH 4.0, which can make aggregates through hydrogen bonding. With increasing the pH, the boronic acids turn into ionized boronate groups, resulting in increased degrees of ionization and hydrophilicity. Hence aggregates formed through hydrogen bonding at low pH will dissociate into molecularly dissolved monomers. With increasing pH, aggregates would be dissociated by boronate formation and regenerated by complexation with glucose.28 To determine the optimum CPBA concentration and the real-time glucose response, the fluorescent titration of CPBA in the presence of glucose was studied. The results exhibited the highest aggregation occurring at a concentration of 0.05 mM of CPBA in 25 min incubation (Fig. S3, ESI).† This information was used for monosaccharide fluorescent titration in carbonate buffer at pH = 9.5. During adding the saccharide solutions into the probe, an excimer emission at 517 nm was observed only by adding of glucose (Fig. 3 and S4, ESI).† However, the highest observed monomeric fluorescence intensity occurred with adding fructose, which exhibits the highest affinity for monoboronic acids (Fig. 3a).29 The excimer intensity (I517) changed significantly from 0 to 160 by adding glucose (Fig. 3b). Approximately 5 mM of glucose was sufficient to saturate the emission intensity change.
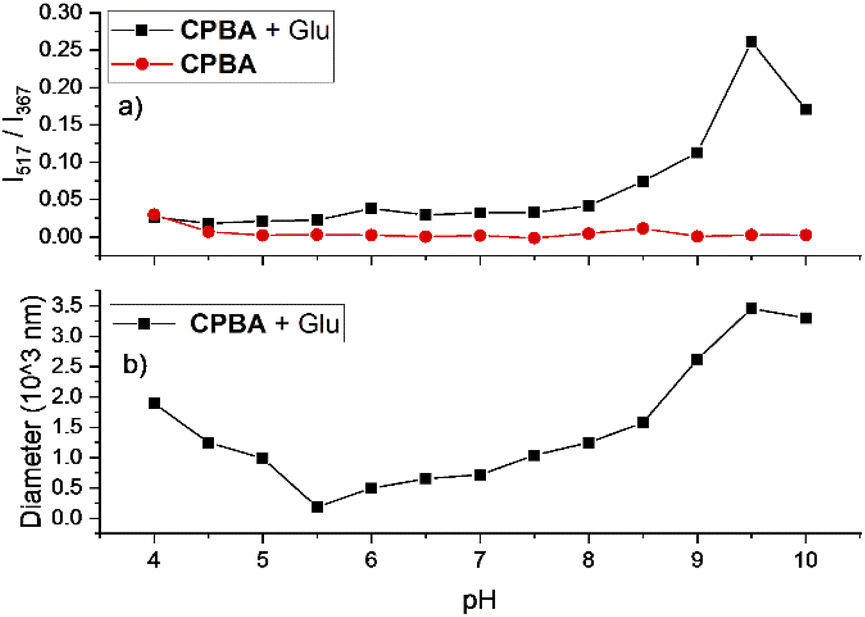 | ||
| Fig. 2 (a) Excimer to monomer emission intensity ratio (I517nm/I367nm) of CPBA in the absence and presence of glucose; (b) particle diameter of CPBA in the presence of glucose [CPBA] = 0.05 mM, [glucose] = 5 mM. Particle diameter was measured by dynamic light scattering (DLS). | ||
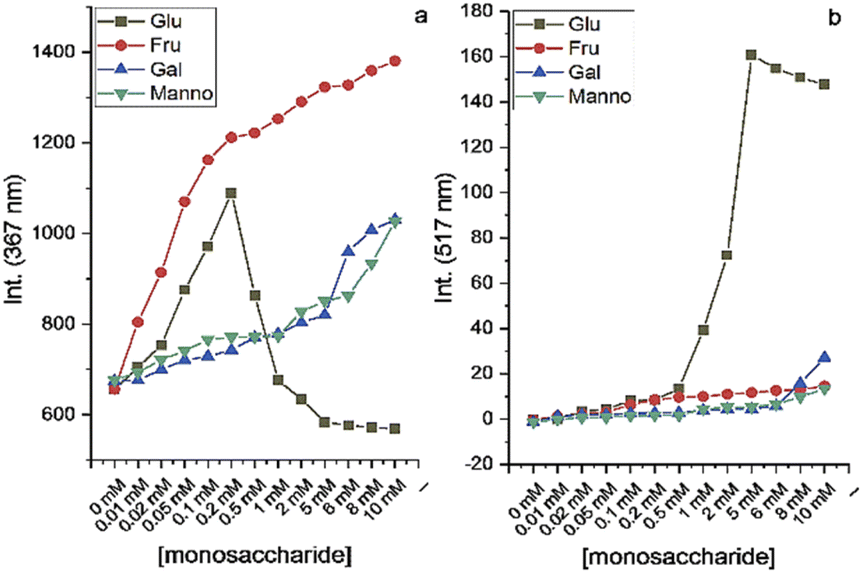 | ||
| Fig. 3 Fluorescent emission of CPBA (0.05 mM) at 367 and 517 nm in the presence of different concentrations of glucose, fructose, galactose and mannose (0–10 mM) in carbonate buffer with pH = 9.5 and λex = 260 nm after 25 min. | ||
By performing interference experiments in carbonate buffer solution, we evaluated the selectivity of CPBA for glucose over other saccharides. Fig. S5 (ESI)† shows the excimer to monomer intensity ratio of CPBA in the presence of fructose, galactose, mannose, and mannitol with and without glucose. The excimer to monomer intensity ratio of CPBA with monosaccharides in the presence of glucose indicates the capability of CPBA in the selective detection of glucose.
The Job's plot based on fluorescence emission spectra indicated x = 0.4 for glucose and x = 0.5 for fructose (Fig. S6, ESI),† resulting in the 2![[thin space (1/6-em)]](https://www.rsc.org/images/entities/char_2009.gif) :1 and 1:1 stoichiometric ratio of CPBA with glucose and fructose, respectively.13 The fitting of eqn (1) presented by Thordarson for the H2G system (2:1, Host:Guest) to the titration data and assuming K2 ≫ K1 and K = K1 × K2, demonstrates a linear relationship with a correlation coefficient of R2 = 0.9930 for the addition of glucose with binding constant K = 2.3 × 10⁶ M−1 (Fig. S7a, ESI).† Similarly, fitting the Benesi–Hildebrand expression (eqn (2)) for the HG system, the emission at 367 nm varied with fructose addition in a linear relationship with n = 1, R2 = 0.9946, and K = 2.7 × 10⁴ M−1, confirming the 1:1 complexion between fructose and CPBA (Fig. S7b, ESI†).30
:1 and 1:1 stoichiometric ratio of CPBA with glucose and fructose, respectively.13 The fitting of eqn (1) presented by Thordarson for the H2G system (2:1, Host:Guest) to the titration data and assuming K2 ≫ K1 and K = K1 × K2, demonstrates a linear relationship with a correlation coefficient of R2 = 0.9930 for the addition of glucose with binding constant K = 2.3 × 10⁶ M−1 (Fig. S7a, ESI).† Similarly, fitting the Benesi–Hildebrand expression (eqn (2)) for the HG system, the emission at 367 nm varied with fructose addition in a linear relationship with n = 1, R2 = 0.9946, and K = 2.7 × 10⁴ M−1, confirming the 1:1 complexion between fructose and CPBA (Fig. S7b, ESI†).30
| Ix/I0 = 1 + (a × K[sensor]2)/(1 + K[sensor]2) | (1) |
| (Imax − I0)/(Ix− I0) = 1 + 1/(K xn) | (2) |
The limit of detection was calculated to be 5.9 × 10⁻⁷ mol L−1 using LOD = 3δ/S, where δ is the standard deviation of 5 blank solutions, and S is the slope between I/I0 at 517 nm versus concentration of glucose (Fig. S7a, ESI)†.
The excimer emission at 517 nm could be due to the carbazole stacking pattern induced by complexation of glucose with CPBA. Fig. 4 shows a schematic illustration of the 1:2 glucose:CPBA aggregate. The cationic pyridinium moiety in CPBA leads to aggregation of chemosensor via cation–π interaction, while by adding glucose a new aggregate generates. The π–π stacking of carbazole rings is assumed to be responsible for the observed new aggregate, which results in excimer emission at 517 nm. As evidence for these observations, the fluorescence of CPBA in solvents with different polarities and its absorption titration with glucose were measured. The enhanced fluorescence of chemosensor appeared in non-polar solvents exhibits the formation of a high cation–π stacking interaction (Fig. S8, ESI),† which is in accordance with the results reported by James et al.27 The UV-vis absorption spectra of CPBA upon adding glucose was measured (Fig. S9, ESI).† With addition of 40–100 eq. of glucose, the isosbestic point was observed around 290 nm, indicating the conversion of aggregation forms.31 It could mean that gradually the primary aggregations assembled from pyridinium cation–π stacking convert to the new aggregate induced by π–π stacking of carbazole rings. In addition, the redshift in the absorption spectra at high glucose concentrations indicates π–π stacking interactions of carbazoles, which is in consistence with the observed results in fluorescence emission.32
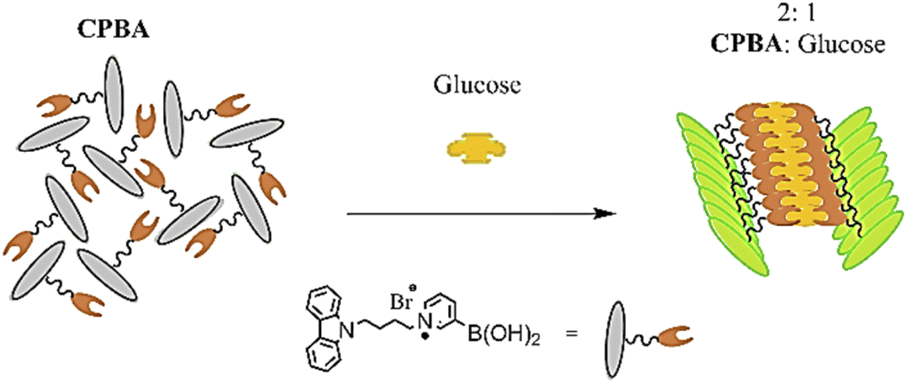 | ||
| Fig. 4 Schematic representation of CPBA interaction with glucose. | ||
Finally, the role of 1:2 stoichiometric ratio in glucose sensing, which is believed to be the key point of forming carbazole π–π stacking and thus showing excimer emission, was studied by looking at the response of CPBA to mannitol. Mannitol, which is known to form 1:2 complexes with boronic acids, exhibited an excimer emission at 517 nm, as predicted (Fig. S10, ESI).† However, when the concentration of mannitol increased above 1 mM, the excimer emission reduced, and monomer fluorescence was retrieved. It appears that at high concentrations of mannitol, the 1:1 complex with CPBA is preferable over the 1:2 complex with CPBA.24
3. Experimental
3.1. Instrumentation
Silica gel plates were used in thin-layer chromatography (Merck, Kieselgel 60 Å, 0.25 mm thickness with the F254 indicator) and an Electrothermal Engineering IA9100 apparatus was used to measure melting points. Low-temperature reactions were carried out using an Operon IMC-90 immersion cooler. Measurements of pH were done using a digital Metrohm 744 pH meter. A Costech-ECS 4010 CHNSO Analyzer was used to evaluate the elemental analyses. 1H and 13C NMR spectra were recorded by the Bruker Ultrashield 400 MHz Avance III spectrometer with tetramethylsilane (TMS) as an internal standard. A Bruker TENSOR 27 spectrometer was used to record Fourier transform infrared (FT-IR) spectra with KBr pellets and the mass spectra were measured with an MSD Agilent 5975C mass spectrometer. Monitoring the UV-vis analyses and the fluorescence experiments were done by the use of JASCO V-750 spectrometer and the JASCO FP-8300 spectrophotometer, respectively and DLS data were obtained by Cordovan Technologies vasco.3.2. Chemicals and materials
The chemicals including reagents, monosaccharides, and solvents were provided from Merck and FLUKA Companies and were utilized without further purifications. Pyridine-3-ylboronic acid (PBA),1 9-(4-bromobutyl)-9H-carbazole (BBC),2 and 1-(4-(9H-carbazol-9-yl)butyl)-3-boronopyridin-1-iumbromide (CPBA) were synthesized according to literature with modification.3.3. The synthetic procedures and characterizations
:1). After 24 h the mixture was allowed to cool down to room temperature and the solvent was concentrated under vacuum. Unreacted carbazole was filtered off and the residue was purified by column chromatography (n-hexane: ethyl acetate, 9:1) to obtain BBC as white needles (m. p. 105–106 °C). 1H NMR (CDCl3, 400 MHz): δ (ppm) = 8.14 (d, J = 7.6 Hz, 2H), 7.51 (ddd, J = 8.2, 7.2, 1.2 Hz, 2H), 7.43 (d, J = 8.4 Hz, 2H), 7.28 (ddd, J = 7.8, 7.0, 0.8 Hz, 2H), 4.38 (t, J = 7.2 Hz, 2H), 3.41 (t, J = 6.4 Hz, 2H), 2.13–2.06 (m, 2H), 1.98–1.91 (m, 2H).4. Conclusions
CPBA, as an amphiphilic chemosensor was simply synthesized from pyridine-3-ylboronic acid and 9-(4-bromobutyl)-9H-carbazole. The synthesized CPBA was applied as a selective ratiometric fluorescent chemosensor toward glucose. The amphiphilicity of this sensor, which contains a carbazole fluorophore and a pyridinium boronic acid receptor, was designed for two reasons: (1) synthesis of a water-soluble sensor which can be applied in biological media, (2) a sensor capable of producing glucose-induced aggregation, resulting in excimer emission in the visible wavelength range. Various techniques were used to confirm the 1:2 stoichiometric ratio of CPBA and glucose, which proved to be responsible for the excimer emission at 517 nm through the aggregation-induced emission (AIE) phenomenon. The water solubility and excellent selectivity of CPBA to glucose in the presence of monosaccharides specified the capability of CPBA in selective detection of glucose in real-samples.
Author contributions
Mandana Oloub: methodology, investigation, analysis and interpretation of data, writing-original draft preparation. Rahman Hosseinzadeh: conceptualization, supervision, funding acquisition, interpretation of data, writing-reviewing and editing. Mahmood Tajbakhsh: interpretation of data, writing-reviewing and editing. Maryam Mohadjerani: conceptualization, interpretation of data, writing-reviewing and editing.Conflicts of interest
The authors declare that they have no known competing financial interests or personal relationships that could have appeared to influence the work reported in this paper.Acknowledgements
We gratefully acknowledge the University of Mazandaran and Iran National Science Foundation: INSF for financial support of this work.Notes and references
- S. Xu, A. C. Sedgwick, S. A. Elfeky, W. Chen, A. S. Jones, G. T. Williams, A. T. A. Jenkins, S. D. Bull, J. S. Fossey and T. D. James, Front. Chem. Sci. Eng., 2020, 14, 112–116 CrossRef CAS.
- R. Liu, L. Li, C. Shao, H. Cai and Z. Wang, J. Diabetes Res., 2022, 2022 Search PubMed.
- H. Wu, V. Norton, K. Cui, B. Zhu, S. Bhattacharjee, Y. W. Lu, B. Wang, D. Shan, S. Wong and Y. Dong, Front. Cardiovasc. Med., 2022, 9, 841928 CrossRef CAS PubMed.
- S. Qasemi and M. Ghaemy, J. Mater. Chem. C, 2020, 8, 4148–4156 RSC.
- S. Wert, H. Iken, M. J. Schöning and F. M. Matysik, Electroanalysis, 2021, 33, 1143–1151 CrossRef CAS.
- A. Pandya, P. G. Sutariya and S. K. Menon, Analyst, 2013, 138, 2483–2490 RSC.
- Z. Nasir, A. Ali, M. F. Alam, M. Shoeb and S. Nusrat Jahan, ACS omega, 2021, 6, 33554–33567 CrossRef CAS.
- G. T. Williams, J. L. Kedge and J. S. Fossey, ACS sensors, 2021, 6, 1508–1528 CrossRef CAS PubMed.
- S. Seraj, S. Rouhani and F. Faridbod, RSC Adv., 2019, 9, 17933–17940 RSC.
- Z. Bian, A. Liu, Y. Li, G. Fang, Q. Yao, G. Zhang and Z. Wu, Analyst, 2020, 145, 719–744 RSC.
- Y. Wang, J. Nie, W. Fang, L. Yang, Q. Hu, Z. Wang, J. Z. Sun and B. Z. Tang, Chem. Rev., 2020, 120, 4534–4577 CrossRef CAS PubMed.
- H.-J. Knölker and K. R. Reddy, Chem. Rev., 2002, 102, 4303–4428 CrossRef PubMed.
- Q. Zou, F. Tao, H. Wu, W. Y. William, T. Li and Y. Cui, Dyes Pigm., 2019, 164, 165–173 CrossRef CAS.
- F. G. Nesheli, M. Tajbakhsh, B. Hosseinzadeh and R. Hosseinzadeh, J. Photochem. Photobiol., A, 2020, 397, 112521 CrossRef.
- A. Sharma, D. Saklani, K. J. Thomas, S. S. Swayamprabha and J.-H. Jou, Org. Electron., 2020, 86, 105864 CrossRef CAS.
- Y. Tang and B. Z. Tang, Principles and applications of aggregation-induced emission, Springer, 2018 Search PubMed.
- W. Yang, Y. Wong, O. T. Ng, L. P. Bai, D. W. Kwong, Y. Ke, Z. H. Jiang, H. W. Li, K. K. Yung and M. S. Wong, Angew. Chem., 2012, 124, 1840–1846 CrossRef.
- J. Yin, Y. Ma, G. Li, M. Peng and W. Lin, Coord. Chem. Rev., 2020, 412, 213257 CrossRef CAS.
- R. Hosseinzadeh, M. Mohadjerani and M. Pooryousef, Luminescence, 2015, 30, 549–555 CrossRef CAS.
- R. Hosseinzadeh, M. Mohadjerani and M. Pooryousef, Anal. Bioanal. Chem., 2016, 408, 1901–1908 CrossRef CAS PubMed.
- R. Hosseinzadeh, M. Mohadjerani, M. Pooryousef, A. Eslami and S. Emami, Spectrochim. Acta, Part A, 2015, 144, 53–60 CrossRef CAS.
- K. Leduskrasts and E. Suna, RSC Adv., 2019, 9, 460–465 RSC.
- R. Melavanki, R. Kusanur, K. K. Sadasivuni, D. Singh and N. Patil, Heliyon, 2020, 6, e05081 CrossRef PubMed.
- Y.-J. Huang, W.-J. Ouyang, X. Wu, Z. Li, J. S. Fossey, T. D. James and Y.-B. Jiang, J. Am. Chem. Soc., 2013, 135, 1700–1703 CrossRef CAS PubMed.
- I. Richter, J. Minari, P. Axe, J. P. Lowe, T. D. James, K. Sakurai, S. D. Bull and J. S. Fossey, Chem. Commun., 2008, 1082–1084 RSC.
- W. Chen, S. A. Elfeky, Y. Nonne, L. Male, K. Ahmed, C. Amiable, P. Axe, S. Yamada, T. D. James and S. D. Bull, Chem. Commun., 2011, 47, 253–255 RSC.
- Y.-J. Huang, Y.-B. Jiang, S. D. Bull, J. S. Fossey and T. D. James, Chem. Commun., 2010, 46, 8180–8182 RSC.
- B. Dehghani, M. S. Hosseini and M. Salami-Kalajahi, Microchem. J., 2020, 157, 105112 CrossRef CAS.
- G. Fang, H. Wang, Z. Bian, J. Sun, A. Liu, H. Fang, B. Liu, Q. Yao and Z. Wu, RSC Adv., 2018, 8, 29400–29427 RSC.
- P. Thordarson, Chem. Soc. Rev., 2011, 40, 1305–1323 RSC.
- A. Mohd, A. A. P. Khan, S. Bano and K. Siddiqi, Arabian J. Chem., 2013, 6, 369–378 CrossRef CAS.
- Y. Zhao, P. Xu, K. Zhang, H. Schönherr and B. Song, Cell Rep. Phys. Sci., 2022, 3, 100734 CrossRef CAS.
- W. Li, D. P. Nelson, M. S. Jensen, R. S. Hoerrner, D. Cai, R. D. Larsen and P. J. Reider, J. Org. Chem., 2002, 67, 5394–5397 CrossRef CAS PubMed.
- Y. Zheng, F. Cardinali, N. Armaroli and G. Accorsi, Eur. J. Inorg. Chem., 2008, 2075–2080 CrossRef CAS.
Footnote |
| † Electronic supplementary information (ESI) available. See https://doi.org/10.1039/d2ra04110c |
| This journal is © The Royal Society of Chemistry 2022 |