 Open Access Article
Improved catalytic activity and bactericidal behavior of novel chitosan/V2O5 co-doped in tin-oxide quantum dots
Muhammad Ikram *a,
Iram Shahzadib,
Ali Haider
 c,
Shaukat Hayatd,
Junaid Haidere,
Anwar Ul-Hamid
 *f,
Anum Shahzadig,
Walid Nabgan
 h,
Sobia Dilpazir*i and
Salamat Alid
aSolar Cell Applications Research Lab, Department of Physics, Government College University Lahore, Lahore, 54000, Punjab, Pakistan. E-mail: dr.muhammadikram@gcu.edu.pk
bCollege of Pharmacy, University of the Punjab, 54000, Lahore, Pakistan
cDepartment of Clinical Sciences, Faculty of Veterinary and Animal Sciences, Muhammad Nawaz Shareef University of Agriculture, 66000, Multan, Pakistan
dDepartment of Physics, Riphah Institute of Computing and Applied Sciences (RICAS), Riphah International University, 14 Ali Road, Lahore, Pakistan
eTianjin Institute of Industrial Biotechnology, Chinese Academy of Sciences, Tianjin 300308, China
fCore Research Facilities, King Fahd University of Petroleum & Minerals, Dhahran, 31261, Saudi Arabia
gCollege of Pharmacy, University of the Punjab, 54000, Lahore, Pakistan
hDepartament d’Enginyeria Química, Universitat Rovira i Virgili, Av Països Catalans 26, 43007, Tarragona, Spain. E-mail: walid.nabgan@urv.cat
iDepartment of Chemistry, Comsats University, 45550 Islamabad, Pakistan. E-mail: sobia.dilpazir@comsats.edu.pk
First published on 16th August 2022
Abstract
The novel V2O5/chitosan (CS) co-doped tin oxide (SnO2) quantum dots (QDs) were synthesized via co-precipitation technique. The optical, structural, morphological, and catalytic properties of the concerned specimens were examined by UV-Vis, PL, FTIR, X-ray diffraction, HR-TEM, and EDS. Structural analysis through XRD confirmed the tetragonal structure of SnO2; meanwhile, HR-TEM measurements unveiled quantum dot morphology. Rotational and vibrational modes related to functional groups of (O–H, C–H, Sn–O, and Sn–O–Sn) have been assessed with FTIR spectra. Through UV-Vis spectroscopy, a reduction in band-gap (4.39 eV to 3.98 eV) and redshift in co-doped spectra of SnO2 were identified. Both CS/SnO2 and V2O5-doped CS@SnO2 showed promising catalytic activity in all media. Meanwhile, CS/SnO2 showed higher activity for use in hospital and industrial dye degradation in comparison to dopant-free Ch/SnO2. For V2O5/CS@ SnO2 QDs, inhibition domains of G –ve were significantly confirmed as 1.40–4.15 mm and 1.85–5.45 mm; meanwhile, for G +ve were noticed as 2.05–4.15 mm and 2.40–5.35 mm at least and maximum concentrations, correspondingly. These findings demonstrate the efficient role of V2O5/CS@SnO2 QDs towards industrial dye degradation and antimicrobial activity.
1. Introduction
Scientists' emphasis has changed progressively toward a clean and green environment in recent years due to extensive urbanization and industrialization. Exposure to contaminants such as oils, leather, paper pulp, dyes, metal ions, and other pollutants that are dumped into water bodies daily in today's heavily industrialized civilizations seems to have become unavoidable for people all over the world.1,2 In order to control pollutants that threaten human safety and health, it is necessary to make more optimal and cost-effective use of current resources. Water contamination is one of the most serious threats to all living things.3 A small amount (0.02%) of the total water on the planet is suitable for human consumption. Unluckily, this small amount is under tremendous threat of contamination. A report published in May 2018 by the Pakistan Council of Research in Water Resources stated that by 2025, Pakistan would have little or no clean water.4 From recent studies, clean drinking water for this country is available to less than 20% of its population. Inadvertently, the remaining 80% of the community absorbs polluted water, primarily due to sewerage, but also due to pesticides, fertilizers, and industrial drainage that are discharged into water bodies without proper treatment of excreting hazardous compounds, resulting in severe contamination of drinking water.5–7 Aside from the deaths caused by drinking polluted water, there have been several cases of tooth and bone disease, hepatitis, diarrhea, cancers, dysentery and typhoid, and other aquatic illnesses resulting from drinking contaminated water.6A variety of traditional approaches have been utilized, such as coagulation,8 evaporation,9 biological treatment,10 filtration, advanced oxidation process,11 electrochemical, photocatalysis,12 adsorption,13 and ion exchange14 for the elimination of these contaminants (color dyes) from waste-water.15 The main issue is that these traditional methods are costly as applied on large scales. Regarding this, researchers recently adopted various adsorbents, for example, zeolite, semiconductors, activated carbon, polymers, and carbon nanotube-based materials. The adsorption technique can be extensively utilized to degrade different reactive dyes in wastewater treatment.13,16–19 Proper dye treatment, including catalytic degradation and adsorption, is recommended for the removal of methylene blue (MB) dye to improve life quality. Adsorption is cost-effective; however, catalyst recovery is difficult and can result in hazardous compounds. Even while catalytic degradation is a little more costly, it is also rather simple and has the advantage of being recyclable.20 Extensively used oxides semiconductor (CeO2, TiO2, NiO, ZnO, CuO, SnO2, CaO, and Fe2O3) has been reported as novel catalysts for organic dye degradation due to their toxin-free nature, chemical stability, high activity, as well as cost benefits.21 Among all of the aforementioned, SnO2 is especially beneficial due to the fact that it is an n-type semiconductor with a large band gap (Eg) ranging from 3.6–4.37 eV.22 SnO2 possessing variety of potential applications in different fields such as photocatalysis, rechargeable, electrodes, etc.23
Chitosan (CS)-doped QDs are currently gaining tremendous attention in catalytic MB dye degradation because of their low immunogenicity, biodegradability, cost-effective biocompatibility, and non-toxic nature.24,25 Chitosan is a semi-crystalline polymer with strong hydrogen bonding between inter and intra-molecules. Chitosan is a biocompatible, stable, biodegradable, safe, and bioactive polysaccharide. Chitosan is easily possible for chemical modification due to the presence of hydroxyl (O–H) and reactive amino groups.25 Catalyst immobilization on the polymer surface may provide an additional benefit as high adsorption capacity, increased catalytic activity, and high reusability.12 Chitosan is a promising candidate (as a host polymer) for chitosan-based QDs synthesis due to the abovementioned characteristics.
Furthermore, few attempts have been conducted with the doping of SnO2 QDs by transition metals ions (TMI), including cobalt, nickel, chromium, magnesium, and vanadium (V2O5), aiming to boost SnO2 photo response from ultra-violet to visible-region.26,27 Specifically, V2O5 could be easily incorporated into SnO2 QDs as an ionic radius of (V5+/Sn4+) = 0.59/0.69 A, which is smaller than un-doped Sn4+ ion.28 The V2O5 doped SnO2 catalytic activity is expected to demonstrate promising activity due to its capacity to gain/lose oxygen. Additionally, adding different vanadium amounts in SnO2 may be efficiently extended SnO2 absorption edge in visible region; as a result, catalytic activity increases.28 Therefore, loading of V2O5 into host SnO2 is tried in the present work.
Despite its thermal stability and low reactivity, SnO2 has received little attention in antibacterial and catalytic degradation applications. To efficiently boost the uses of SnO2 nanorods (NRs) in this affection, V2O5 and chitosan have been incorporated into SnO2 lattice. In current work, we have synthesized 2 and 4% V2O5/CS co-doped SnO2 QDs using a cost-effective and ecofriendly co-precipitation process and various characterization tools employed for detailed analysis (TEM, XRD, EDS, FTIR, PL, and UV).
2. Experimental section
2.1 Materials
Stannous chloride dihydrate (SnCl2·2H2O, 98%), chitosan (C6H11NO4)n, sodium hydroxide (NaOH, 98%), and vanadium oxide (V2O5, 99.6%), sodium borohydrate (NaBH4, 99.5%) have been procured from Sigma-Aldrich.2.2 Synthesis of tin oxide
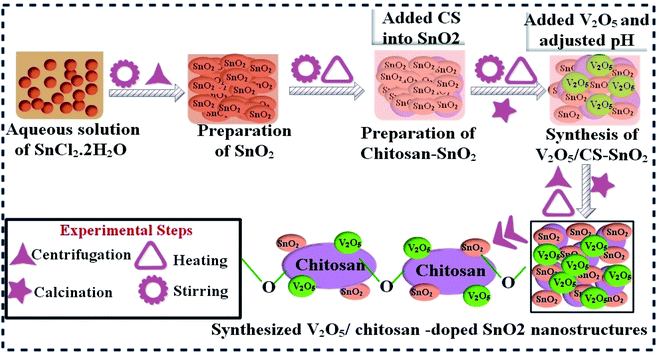
Tin oxide (SnO2) was synthesized via a doping co-precipitation approach by stirring 0.5 M SnCl2·2H2O in deionized water (100 mL) for 40 min at 80 °C. Dropwise addition of 0.5 M of NaOH solution was used to maintain the pH 12 of the stirred solution. After 2 hours of heating, the solution was collected, centrifuged at 7100 rpm and washed several times for ∼10 min. Consequently, the pellet obtained form centrifuged solution was heated (90 °C, 10 hours). Finally, SnO2 nanomaterials (NPs) were annealed at 350 °C for 120 min and ground to attain fine powder, as unveiled in Fig. 1.292.3 Synthesis of vanadium/chitosan co-doped tin oxide
Firstly, 0.564 g of chitosan (CS) was added in 40 mL of deionized water under continual magnetic stirring (30 min, 80 °C) to form a homogeneous solution. Afterward, this homogeneous solution was incorporated in SnO2 solution, as prepared above. Secondly, various amounts (2%, 4%) of V2O5 were poured into chitosan-doped SnO2 solution and stirred for 30 min. Adjusted the pH 12 using NaOH, harvested the synthesized product by centrifugation, then calcined at 350 °C for 120 min to prepare the nanocomposites powder. These synthesized samples are represented as SnO2, CS@SnO2, and V2O5 (2 and 4%), where 2% and 4% correspond to different concentrations of V2O5 doped in a fixed concentration of CS@SnO2, as revealed in Fig. 1.2.4 Isolation and identification of S. aureus and E. coli
Mastitis-positive sheep milk samples have been collected from different farms and veterinary clinics in Punjab, Pakistan, and cultured on 5% sheep blood agar (SBA). Cultured specimen plates were incubated at ∼37 °C for 12 hours. Segregated bacterial isolates were purified by streaking in triplets on MacConkey and mannitol salt agar (MCA and MSA), correspondingly at ∼pH 7. Morphological studies (Gram staining) and biochemical analysis (coagulase and catalase tests) were employed to identify isolated colonies.2.5 Antimicrobial activity
As concerned, specimens were deployed to assess bactericidal action against Gram –ve and Gram +ve bacteria via agar well diffusion procedure at cultured Petri plates swabbed with 0.5 McFarland bacterial growth.30 A sterile cork borer was utilized to prepare wells having 6 mm diameter on MCA and MSA plates; meanwhile, aseptically prepared wells were filled with varying concentrations of pristine and co-doped SnO2 (0.5 and 1.0 mg/0.05 mL) as the minimum and maximum doses, respectively, in contrast with ciprofloxacin (0.005 mg/0.05 mL) and DI water (0.055 mL) as positive and negative controls, respectively. Antimicrobial efficacy was determined through the Vernier caliper by measuring inhibition areas in millimeters (mm) after overnight incubation at ∼37 °C.312.6 Catalytic activity
The MB dye has been employed to study the catalytic activity (CA) of pure SnO2, CS@SnO2, and co-doped SnO2 QDs in a solution containing a specific amount of NaBH4 (800 μL, 400 μL) as a reducing agent, respectively. As pure and co-doped QDs added to a solution with MB and NaBH4, a promising deterioration was noticed. UV-vis absorption measurements ranging from 200 to 800 nm were used to confirm considerable dye degradation. Dye degradation is influenced by particle size; smaller particles have a higher surface-volume ratio, resulting in improved catalytic activity.12,323. Results and discussion
The synthesized CS@SnO2, and (2, 4%) V2O5/CS-doped and undoped SnO2 quantum dots (QDs) have been characterized utilizing the XRD technique and corresponding results as shown in Fig. 2a. The seven diffraction peaks with 2θ° values of 26.74°, 31.64°, 33.21°, 38.12, 51.9°, 56.64°, 62.02°, and 65.24° corresponding to pristine SnO2 crystal planes of (110), (212), (101), (200), (211), (220), (310), and (301), respectively and confirming SnO2 tetragonal structure.33 These analytical findings matched with the XRD data file of SnO2 (JCPDS No. 41-1445).34 Besides, additional diffracted peaks at 2θ° = 30° (101) and 45° (200) crystal planes indicated the presence of SnO (JCPDS-01-085-0423).35 For CS-doped SnO2 sample, a new emerging peak at ∼19.2° was found (marked by a red star).36 However, adding V2O5 (2 and 4%) into CS@SnO2 QDs, no extra peak related to V2O5 was noticed, but peak intensity was reduced compared to undoped SnO2. This preliminary confirms successfully doping (2 and 4%) V2O5 into CS@SnO2. A decrease in the intensity of the peak implies a decrease in the crystallinity of the material. Average crystallite size D for undoped and co-doped SnO2 was calculated with the Debye–Scherer formula and found to be 7.52, 9.18, 11.71, and 12.63 nm, respectively, might be close to earlier reported work.where D denotes the crystal size (nm), and k is constant relating to the crystallite shapes (0.9), wavelength for X-rays is λ
![[thin space (1/6-em)]](https://www.rsc.org/images/entities/char_2009.gif) =
= ![[thin space (1/6-em)]](https://www.rsc.org/images/entities/char_2009.gif) 1.54056 Å, θ is scattering angle (in radians), β is the full peak width at half maximum (FWHM) has the highest intensity (212),
1.54056 Å, θ is scattering angle (in radians), β is the full peak width at half maximum (FWHM) has the highest intensity (212),
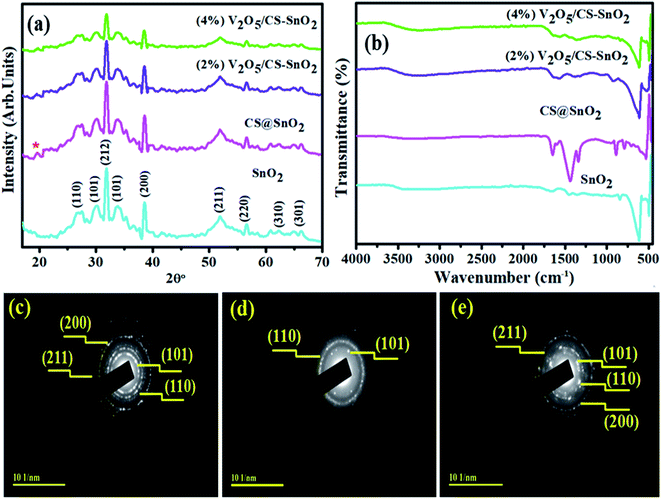 | ||
| Fig. 2 Diffraction pattern (a) FT-IR spectra (b) of SnO2, CS/SnO2 and (2, 4%) V2O5/SnO2/CS, respectively, meanwhile (c–e), SAED patterns of pristine, CS/SnO2 and co-doped SnO2. | ||
Fig. 2b demonstrated the FTIR spectrum of pristine SnO2 and (2, 4%) V2O5/CS co-doped SnO2, correspondingly ranging from 500 to 4000 cm−1. The broadband 3516 cm−1 and the band 1649 cm−1 identified in the synthesized specimens are ascribed to stretching of O–H groups, which may be caused by adsorbed water molecules vibration.37 The sharp peak at 618 cm−1 corresponds to the SnO2 framework vibrations; meanwhile,38 the peak area ∼1422 cm−1 unveiled bending vibrations of CH2.37,39,40 A small peak flexing found around 493 cm−1 is inclined to Sn–O stretching vibration. Similarly, a new peak for CS@SnO2 is found at ∼1320 cm−1 due to secondary and tertiary amide functional groups. After (2%) V2O5 incorporation in CS/SnO2 QDs, a new peak appeared at 928 cm−1 for the vanadium doped contents.41 The vibrations in co-doped spectra and changes in peak intensities again supported the substitution of V2O5/CS into SnO2 successfully. SAED (Selected Area Diffraction) images of bare SnO2, CS@SnO2, and V2O5/CS co-doped SnO2 samples are expressed in Fig. 2c–e. With diffraction planes, images of concerned specimens were indexed as (101), (110), (211), and (220), respectively, and these circular rings with bright spots demonstrated the polycrystalline nature of SnO2. With the incorporation of V2O5 and CS, the crystallinity of concerned samples was enhanced, confirmed by XRD findings, which show SnO2 tetragonal structure.
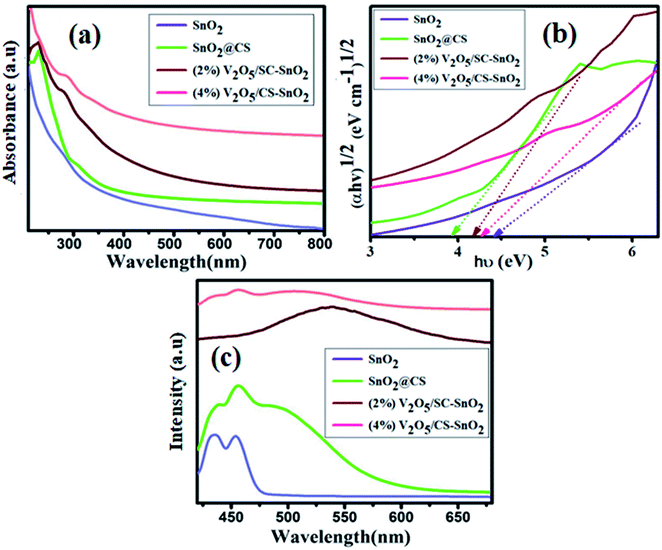
UV-vis spectra have been recorded to examine optical absorption features and the influence of CS and V2O5 on SnO2 in absorption wavelengths 300–675 nm. Characteristics peak for SnO2 was stationed ∼285 nm as unveiled in Fig. 3a and compared with pristine SnO2, slight redshift for CS@SnO2 QDs was occurred meanwhile, upon adding of (2, 4%) V2O5, sharp redshift was noticed referring to further band gap (Eg) decrease.42–44 Additionally, upon vanadium doping, the absorption improved as the concentration increased from 2 to 4%. This absorption may be ascribed to the sp-d exchange interaction between band electron and the localized d-electron of V5+ ions substituting on Sn4+ ions.45 The Eg values were determined through the Tauc plot. Meanwhile, graphs for SnO2, CS@SnO2, and co-doped SnO2 QDs were displayed for (αhv) versus (hv) as divulged (Fig. 3b). The Eg of SnO2 sample was calculated as 4.39 eV, which agreed with the values reported by Zhenxing Li et al., meanwhile, after CS and V2O5 dopants, Eg decreased up to 3.98, 4.17, and 4.29 eV, respectively, for CS@SnO2 and co-doped SnO2. This reduction in Eg may be s-d and p-d exchange interaction, giving rise to +ve and −ve correction to valence and conduction band edges, respectively, and resulting in a narrowing in Eg.45
To investigate the optical characteristics, energy levels and quantum confinement phenomena of semiconducting nanocomposites and the presence of possible defects caused by dopants and surfactants, PL spectra were obtained ranging from 420 to 600 nm with an excitation wavelength of 325 nm under an ambient condition. Furthermore, emission can be ascribed to un-resolved states as pumping promotes excitons to attain two or more than two ē–h+ pairs because of the coulomb effect, which increases photoemission. Also, lower emission corresponding results demonstrate a less intense band and indicate lower ē–h+ carrier recombination.46 Fig. 3c demonstrated the PL spectra of SnO2, CS@SnO2, and (2, 4%) V2O5/CS co-doped SnO2 QDs, respectively. The concerned samples revealed a visible emission centered about ∼434 nm. This blue emission was noticed due to electron transfer from ionized oxygen to the valence band.47,48 However, upon (2 and 4%) V2O5 doping in CS@SnO2, visible emission peak intensity (439 nm) becomes lower than pure SnO2. The oxygen transfer from the V2O5 lattice to oxygen vacancies in the SnO2 lattice may explain this.48,49 The pentavalent character of the V5+ ions loaded in vanadium-doped SnO2 lattice allows oxygen to flow from V2O5 sites, resulting in a decrease in oxygen vacancy for vanadium-infused SnO2 lattice.49
Energy dispersive X-ray spectroscopy (EDS) has been carried out for element content confirmation and additional features of as-prepared SnO2, CS@SnO2, and (2, 4%) V2O5/CS-doped SnO2 (Fig. 4a–d). EDS analysis unveiled the presence of Sn, O, C, Cl, and V peaks which described that the concerned nanoparticles are pure. Impurity peaks such as Na and Cl were detected in all synthesized materials that may come from NaOH solution used to retain pH and Cl occurred during the synthesis of SnO2 from SnCl2·H2O, respectively. Minor trace of Au peak instigated from the coating and holder utilized for the EDS observation.50 This showed the successful formation of SnO2 and co-doped SnO2 samples.
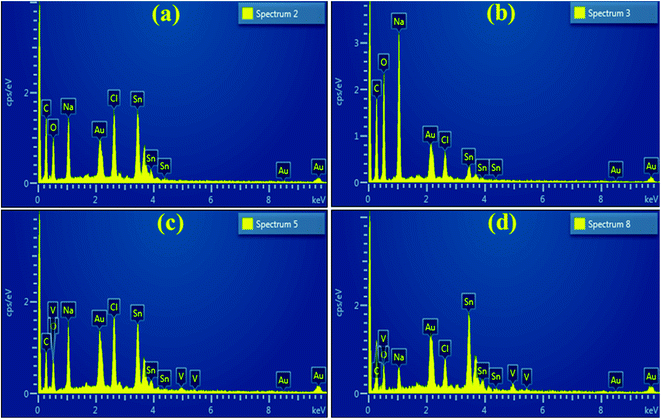 | ||
| Fig. 4 EDS profiles of SnO2 (a), CS@SnO2 (b), and 2, 4% V2O5/CS-doped SnO2 (c, d) samples, respectively. | ||
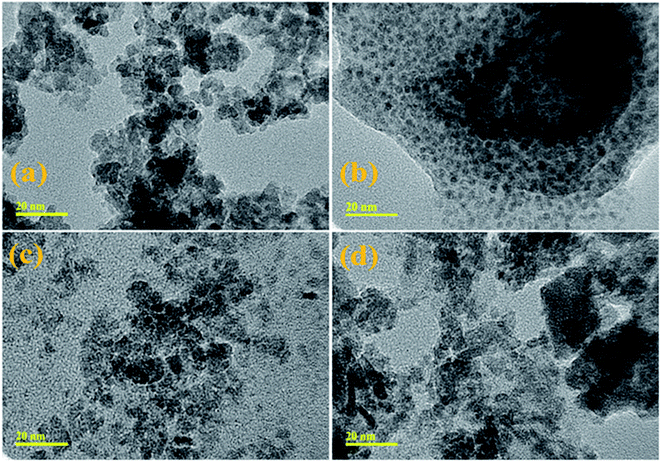
HRTEM images in Fig. 5(a–d) show the morphological features from SnO2 to 4% V2O5/CS co-doped SnO2, respectively. High-resolution TEM micrographs of synthesized samples revealed that the material has a 0D nature and confirmed the evolution of QDs, as illustrated in Fig. 5(a–d). QDs of CS-doped SnO2 are present in spherical structure (Fig. 5b) while in the presence of 2% vanadium QDs in the porous structure. The morphologies of QDs confirm that particle size increase with V2O5 incorporation into SnO2 QDs. Particle sizes of SnO2, CS/SnO2, and (2, 4%) CS/V2O5/SnO2 QDs were measured through TEM and found to be 9.21, 11.37, 13.86, 15.14 and 17.45 nm, respectively which revealed a significant increase from 9.21 to 17.45 nm. HR-TEM micrograph indicated the slight agglomeration after 4% vanadium doping, as depicted in Fig. 5d. Meanwhile, d-spacing of pure and doped samples was calculated, and these values (0.27, 0.29, 0.34 and 0.37 nm) are well-matched with XRD results (Fig. 6a–d)
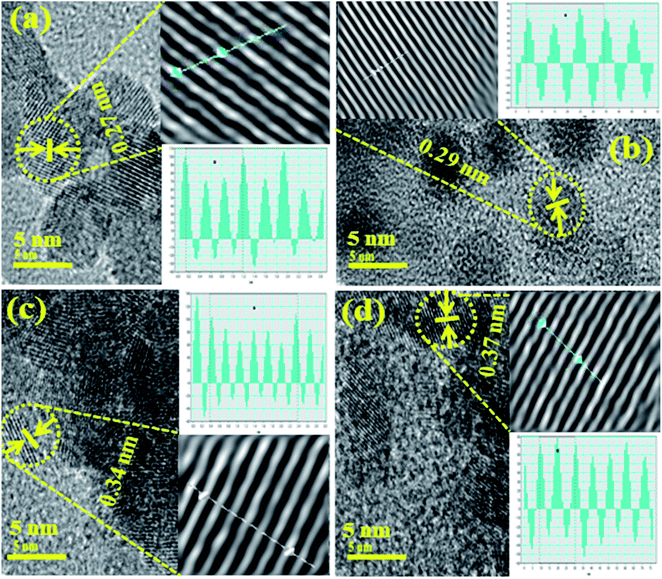 | ||
| Fig. 6 Interlayer d-spacing images of SnO2 (a), CS/SnO2 (b), and (2, 4%) V2O5/SnO2/CS (c, d), respectively, d spacing scale bar 5 nm. | ||
The in vitro bactericidal potency for un-doped SnO2, CS@SnO2, and (2, 4%) V2O5/CS-doped SnO2 QDs was evaluated via measuring inhibition areas utilizing a well diffusion procedure against Escherichia coli (E. coli) and Staphylococcus aureus (S. aureus), as revealed in Table 1. According to the findings, the concentration and inhibition zones (mm) were synergistic with each other. For V2O5/CS@ SnO2 QDs, inhibition domains of G –ve were significantly confirmed as (1.40–4.15 mm) and (1.85–5.45 mm); meanwhile, for G +ve were noticed as (2.05–4.15 mm) and (2.40–5.35 mm) at least and maximum concentrations, correspondingly. Broadly, null activity was measured for SnO2 to S. aureus at a minimum and maximum concentration. Compared to deionized water (DI) (0 mm), ciprofloxacin presented 5.35- and 6.10 mm inhibition domains against E. coli and S. aureus, respectively. The antibacterial activity is reviewed in light of the previous findings presented in Table 2.
| Samples | Inhibition zonea (mm) | Inhibition zoneb (mm) | ||
|---|---|---|---|---|
| 0.5 mg/50 μL | 1.0 mg/50 μL | 0.5 mg/50 μL | 1.0 mg/50 μL | |
| a Measurement of inhibition domains against G −ve.b Inhibition areas (mm) for G +ve. | ||||
| SnO2 | 0.80 | |||
| CS@SnO2 | 1.40 | 1.85 | 2.05 | 2.40 |
| (2%) V2O5/CS@ SnO2 | 3.35 | 3.95 | 2.55 | 3.35 |
| (4%) V2O5/CS@ SnO2 | 4.15 | 5.45 | 4.15 | 5.35 |
| Ciprofloxacin | 5.35 | 5.3 | 6.10 | 6.10 |
| DIW | 0 | 0 | 0 | |
| Nano-catalyst | Synthesis process | Dye degradation performance | Antibacterial activity | Particle size (μm) | Crystallite size (nm) | Surface area (m2 g−1) | Ref. |
|---|---|---|---|---|---|---|---|
| Ce:SnO2 NPs | Sol–gel method | ∼67.83% in 100 minutes against methyl orange | — | 0.1–0.3 | 6 | 56.33 | 63 |
| Mn:SnO2 NPs | Co-precipitation | 92% in 180 minutes for naphthol blue black | Strong activity showed in response to S. typhi and S. aureus on higher concentration | — | — | 7.73 | 64 |
| Cur–Ag–SnO2 NPs | Co-precipitation approach | 41.23% in 150 minutes by higher doping of silver against rose Bengal (RB) | 11 mm and 14 mm for C. albicans and A. flavus for higher concentration | 0.1–4.0 | 21.04 | 21.39 | 65 |
| Peel extract-doped SnO2 NPs | Green synthesis approach | 100% in 180 minutes on higher doping of extract into SnO2 against MB:MO:RhB | — | 4–8 nm | 12.1 | 7.6 | 66 |
| CS/SnO2 | Co-precipitation | Maximum degradation occurs (92% and 79%) within 100 minutes against MO and RhB | — | 11 nm | 6.7 | 89.2 | 67 |
| CS/V2O5/ SnO2 QDs | Co-precipitation | 99.89% in acidic medium against MB | 5.45 mm and 5.35 mm inhibition zone measured for E. coli and S. aureus on very low concentration | 17.45 nm | 12.63 nm | — | Present work |
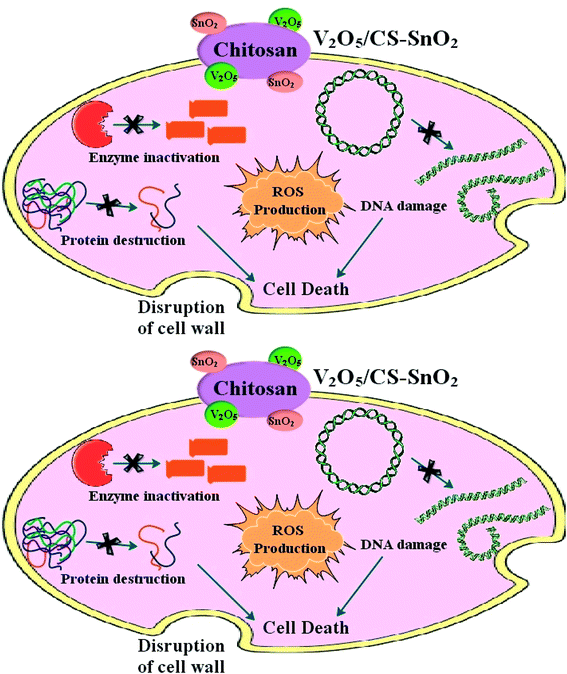
The exact mechanism of the action of the SnO2 QDs against different microbial strains (E. coli and S. aureus) is currently unknown. However, a number of mechanisms against both these bacteria have been recommended for metal oxide QDs, for example, decomposition of QDs, smaller particle size or large surface area of QDs, electrostatic interaction of QDs to the microorganisms cell wall, and reactive oxygen species (ROS) formation.51–55 According to the findings of the current investigation, one possible explanation for the antibacterial activity of SnO2 QDs is the accumulation of QDs on the surface of the bacterial cell membrane. As a consequence of QDs, ROS is produced, which interacts with the cell membrane and affects the bacterium's membrane permeability and respiratory system, ultimately leading in cell death of the bacteria.51,56–58 For instant, Khan et al. proposed that the release of Co2+ and Sn4+ may be cause for damaging mitochondria and bacterial DNA, which inactivate the bacterial enzyme and eventually lead to cell death (Fig. 7).59
3.1 Catalytic activity
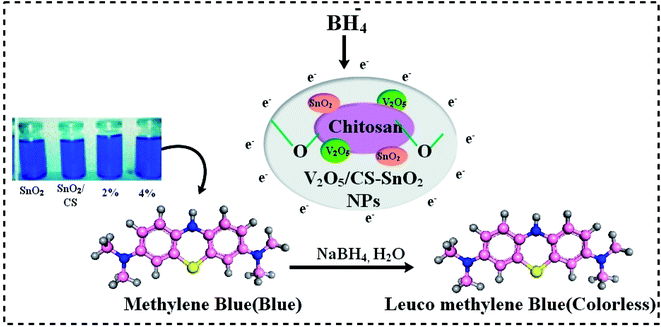
The catalytic activity of undoped, CS@ SnO2 and V2O5/CS doped QDs was carried out for the methylene blue (MB) degradation acts as an oxidizer in the manifestation of reducer NaBH4 (Fig. 9). In current work, the as-synthesized specimens act as a catalyst. This activity completely relies on the concentration of the catalyst as it strengthens the dye degradation because the catalyst always minimizes the activation energy of a chemical reaction.32 For the catalysis, 400 μL of sodium borohydride (NaBH4) was added to 3 mL aqueous MB in a quartz cell. Catalytic activity usually depends on the surface area, crystallinity, and morphology of QDs. In general, the catalyst having a wide surface area has shown higher catalytic effectiveness because the catalyst may provide more active sites,60,61 and the pH of the solution has a significant impact on degradation efficiency. In acidic media, catalytic activity was higher, which might be assigned to increased H+ ions production absorbed by the surface of the nanostructure. The number of hydroxyl groups in NaOH (basic medium) increases, causing reduced products to be oxidized and catalytic activity to be diminished. The dye degradation of (MB) was investigated using UV-vis spectroscopy during the catalysis process of pure and co-doped QDs. The SnO2, CS@SnO2, V2O5/CS doped SnO2 showed degradation of 50.29, 98.81, 58.87 and 54.87% in neutral medium (pH = 7), 48.99, 99.89, 59.45, and 47.25% in acidic medium (pH = 4), and 36.94, 99.3, 92.46, and 53.73% in basic medium (pH = 12), respectively as express in Fig. 8a, b, c. Both trapping and de-trapping for the charge carrier divulged by V2O5/Ch co-doped SnO2 catalyst may be accounted to its electronic configuration. V5+ possessing completely ‘s’ and ‘d’ orbital that are in stable form. As V trapping the electron (e−)/holes the stability may be disturbed and V dopant conquers the stable state via detrapping it and this form of trapping is termed as shallow trapping. Trapping and de-trapping boost up interfacial charge transfer phenomena leading to the excess generation of super oxide and hydroxyl radicals. Therefore it can be concluded that the prerequisite condition for the dopant to be effective lies in its optimum concentration which facilitate the formation of appropriate dopant energy levels and surface states for the smooth migration of charge carriers.62 A comparison of degradation rate (%) over the previously reported nanomaterials is displayed in Table 2.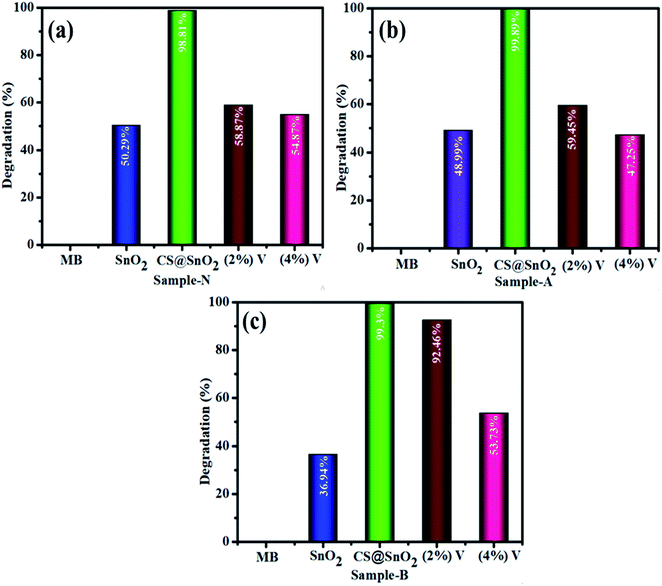 | ||
| Fig. 8 The catalytic activity of SnO2, CS@SnO2, and V2O5/CS-SnO2 with vanadium ratio (2, 4%) neutral, acidic, and basic medium (a, b and c), respectively. | ||
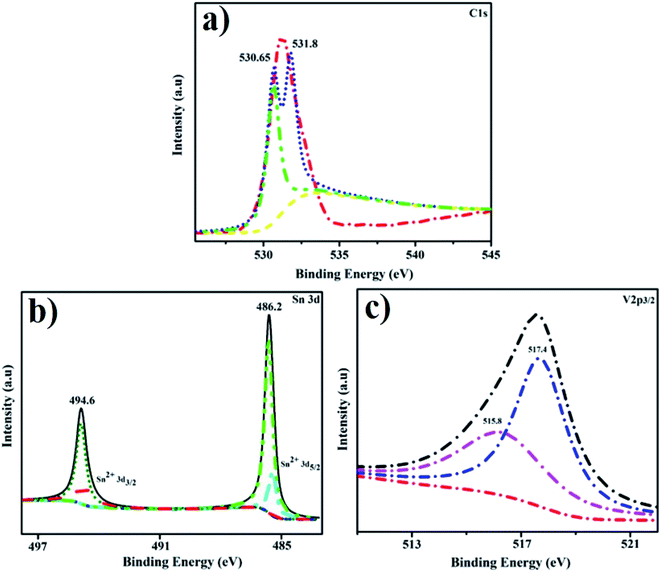
As depicted in Fig. 10a–c, XPS was used to determine the chemical structure of V2O5/Ch co-doped SnO2 to validate V2O5 doping. For doped material, the measured O 1s binding energy has a strong peak at 530.65 eV, which strongly corresponds to the value for SnO2. The second peak at 531.8 eV may be attributed to an O–C bond68 or to O2− in oxygen-deficient regions, as shown in Fig. 10(a).69 Principal highs Sn4+ 3d5/2 (486.2 eV) and Sn4+ 3d3/2 (494.6 eV) were attributed to SnO2, proving its existence.70 Moreover, the peaks of Sn2+ 3d5/2 and Sn2+ 3d3/2 were found in V2O5/Ch co-doped SnO2![[thin space (1/6-em)]](https://www.rsc.org/images/entities/char_2009.gif) samples, indicating that Sn4+ ions were partially reduced to Sn2+ during doping process, as shown in Fig. 10(b).71 The core level binding energies of the V2p3/2 spectrum shown in Fig. 10c are split into two peaks at 517.40 eV and 515.80 eV, which correspond to V5+ and V4+ species, correspondingly.72
samples, indicating that Sn4+ ions were partially reduced to Sn2+ during doping process, as shown in Fig. 10(b).71 The core level binding energies of the V2p3/2 spectrum shown in Fig. 10c are split into two peaks at 517.40 eV and 515.80 eV, which correspond to V5+ and V4+ species, correspondingly.72
4. Conclusion
In current study, we have effectively prepared pure SnO2 and 2, 4% V2O5/CS co-doped SnO2 QDs for catalytic activity and bactericidal action using a co-precipitation approach. XRD analysis of synthesized samples confirmed that the tetragonal structure and crystallite size increased (7.52 to 12.63 nm) upon co-dopants in SnO2. The SnO2 presence was confirmed through Sn–O stretching vibration in FTIR. The absorption increased upon doping; therefore, a reduction in band gap energy was observed from 4.39–4.29 eV with 4% V2O5/CS doping in SnO2. HR-TEM and EDS analysis confirmed the formation of the quantum dots and the SnO2 QDs. The results found to be synergistic with the concentration and inhibition zones (mm) identified. The CS@SnO2 sample demonstrated promising degradation against MB dye in all three media (neutral, acidic, and basic) 98.81, 99.89, and 99.3%, respectively, compared to pristine and (2, 4%) V2O5/CS co-doped SnO2. The current study V2O5/CS co-doped SnO2 showed good antibacterial and catalytic efficacy in treating industrially polluted wastewater and biomedical applications.Conflicts of interest
Manuscript is free from conflicts of interest.Acknowledgements
The authors thank HEC, Pakistan, for funding NRPU Project 20-17615.References
- M. Ikram, Z. Bashir, A. Haider, S. Naz, A. Ul-Hamid, I. Shahzadi, A. Ashfaq, J. Haider, A. Shahzadi and S. Ali, Bactericidal action and molecular docking studies of catalytic Cu-doped NiO composited with cellulose nanocrystals, Int. J. Biol. Macromol., 2022, 195, 440–448, DOI:10.1016/j.ijbiomac.2021.12.038.
- A. Kusiak, Z. Zhang and A. Verma, Prediction, operations, and condition monitoring in wind energy, Energy, 2013, 60, 1–12, DOI:10.1016/j.energy.2013.07.051.
- D. Dudgeon, A. H. Arthington, M. O. Gessner, Z. I. Kawabata, D. J. Knowler, C. Leveque, R. J. Naiman and A. H. Prieur-Richard, Freshwater biodiversity: Importance, threats, status and conservation challenges, Biol. Rev. Cambridge Philos. Soc., 2006, 81, 163–182, DOI:10.1017/S1464793105006950.
- G. Nabi, M. Ali, S. Khan and S. Kumar, The crisis of water shortage and pollution in Pakistan: risk to public health, biodiversity, and ecosystem, Environ. Sci. Pollut. Res., 2019, 26, 10443–10445, DOI:10.1007/s11356-019-04483-w.
- M. K. Daud, M. Nafees, S. Ali, M. Rizwan, R. A. Bajwa, M. B. Shakoor, M. U. Arshad, S. A. S. Chatha, F. Deeba, W. Murad, I. Malook and S. J. Zhu, Drinking Water Quality Status and Contamination in Pakistan, BioMed Res. Int., 2017, 2017, 18, DOI:10.1155/2017/7908183.
- S. K. Agarwal, Water Pollution, Pollution Management, Publishing Corporation, New Delhi, India, 2002 Search PubMed.
- F. K. Bangash and S. U. Khan, Aesthetic Quality Evaluation of Drinking Water of Peshawar Valley, J. Chem. Soc. Pak., 2001, 23, 252–262 CAS.
- M. S. Samuel, S. S. Shah, V. Subramaniyan, T. Qureshi, J. Bhattacharya and N. D. Pradeep Singh, Preparation of graphene oxide/chitosan/ferrite nanocomposite for Chromium(VI) removal from aqueous solution, Int. J. Biol. Macromol., 2018, 119, 540–547, DOI:10.1016/j.ijbiomac.2018.07.052.
- S. M Samuel, M. E. A. Abigail and C. Ramalingam, Biosorption of Cr(VI) by Ceratocystis paradoxa MSR2 Using isotherm modelling, kinetic study and optimization of batch parameters using response surface methodology, PLoS One, 2015, 10, 1–23, DOI:10.1371/journal.pone.0118999.
- F. S. Omar, H. Nay Ming, S. M. Hafiz and L. H. Ngee, Microwave synthesis of zinc oxide/reduced graphene oxide hybrid for adsorption-photocatalysis application, Int. J. Photoenergy, 2014, 2014, 176835, DOI:10.1155/2014/176835.
- N. Rosman, W. N. W. Salleh, M. A. Mohamed, J. Jaafar, A. F. Ismail and Z. Harun, Hybrid membrane filtration-advanced oxidation processes for removal of pharmaceutical residue, J. Colloid Interface Sci., 2018, 532, 236–260, DOI:10.1016/j.jcis.2018.07.118.
- M. Ikram, S. Hayat, M. Imran, A. Haider, S. Naz, A. Ul-hamid, I. Shahzadi, J. Haider, A. Shahzadi, W. Nabgan and S. Ali, Novel Ag/cellulose-doped CeO2 quantum dots for efficient dye degradation and bactericidal activity with molecular docking study, Carbohydr. Polym., 2021, 269, 118346, DOI:10.1016/j.carbpol.2021.118346.
- M. Ikram, T. Inayat, A. Haider, A. Ul-Hamid, J. Haider, W. Nabgan, A. Saeed, A. Shahbaz, S. Hayat, K. Ul-Ain and A. R. Butt, Graphene Oxide-Doped MgO Nanostructures for Highly Efficient Dye Degradation and Bactericidal Action, Nanoscale Res. Lett., 2021, 16, 56, DOI:10.1186/s11671-021-03516-z.
- M. Samuel, E. A. Abigail and M. R. Chidambaram, Isotherm modelling, kinetic study and optimization of batch parameters using response surface methodology for effective removal of Cr(VI) using fungal biomass, PLoS One, 2015, 10, 1–15, DOI:10.1371/journal.pone.0116884.
- A. Ashfaq, M. Ikram, A. Haider, A. Ul-Hamid, I. Shahzadi and J. Haider, Nitrogen and Carbon Nitride-Doped TiO2 for Multiple Catalysis and Its Antimicrobial Activity, Nanoscale Res. Lett., 2021, 16, 119, DOI:10.1186/s11671-021-03573-4.
- M. E. Abigail, S. M Samuel and C. Ramalingam, Addressing the environmental impacts of butachlor and the available remediation strategies : a systematic review, Int. J. Environ. Sci. Technol., 2015, 12, 4025–4036, DOI:10.1007/s13762-015-0866-2.
- M. S. Samuel, E. Selvarajan, T. Mathimani and N. Santhanam, Green synthesis of cobalt-oxide nanoparticle using jumbo Muscadine (Vitis rotundifolia): characterization and photo-catalytic activity of acid Blue-74, J. Photochem. Photobiol., B, 2020, 211, 112011, DOI:10.1016/j.jphotobiol.2020.112011.
- S. Datta, R. V. Melvin and S. S. Ethiraj, Immobilization of laccases and applications for the detection and remediation of pollutants : a review, Environ. Chem. Lett., 2021, 19, 521–538, DOI:10.1007/s10311-020-01081-y.
- M. S. Samuel, S. Jose and E. Selvarajan, Biosynthesized silver nanoparticles using Bacillus amyloliquefaciens; Application for cytotoxicity effect on A549 cell line and photocatalytic degradation of p-nitrophenol, J. Photochem. Photobiol., B, 2019, 111642, DOI:10.1016/j.jphotobiol.2019.111642.
- Y. H. Liu Xiao, Y. Wang, B. Zhu and C. Xie, Effect of microstructures and textures on the anisotropy of mechanical properties of AZ31 magnesium alloy sheets subjected to high strain rate rolling To, Appl. Phys., 2019, 1–31 Search PubMed.
- N. C. Joshi, P. Gururani and S. P. Gairola, Metal Oxide Nanoparticles and their Nanocomposite- based Materials as Photocatalysts in the Degradation of, Biointerface Res. Appl. Chem., 2022, 12, 6557–6579 CAS.
- G. K. Dalapati, H. Sharma and A. Guchhait, Tin oxide for optoelectronic, photovoltaic and energy storage devices: a review, J. Mater. Chem. A., 2021, 9, 16621–16684, 10.1039/d1ta01291f.
- A. Bhattacharjee and M. Ahmaruzzaman, A novel and green process for the production of SnO2 quantum dots and its application as a photocatalyst for the degradation of dyes from aqueous phase, Elsevier Inc., 2015. DOI: DOI:10.1016/j.jcis.2015.01.083.
- P. Taylor, Y. Haldorai and J. Shim, Chitosan-Zinc Oxide hybrid composite for enhanced dye degradation and antibacterial activity, Compos. Interfaces, 2013, 37–41, DOI:10.1080/15685543.2013.806124.
- A. Aziz, N. Ali, A. Khan, M. Bilal, S. Malik, N. Ali and H. Khan, Chitosan - zinc sul fi de nanoparticles , characterization and their photocatalytic degradation ef fi ciency for azo dyes, Int. J. Biol. Macromol., 2020, 153, 502–512, DOI:10.1016/j.ijbiomac.2020.02.310.
- S. M. Hassan, A. I. Ahmed and M. A. Mannaa, Structural, photocatalytic, biological and catalytic properties of SnO2/TiO2 nanoparticles, Ceram. Int., 2018, 44, 6201–6211, DOI:10.1016/j.ceramint.2018.01.005.
- S. M. Hassan, A. I. Ahmed and M. A. Mannaa, Structural, photocatalytic, biological and catalytic properties of SnO2/TiO2 nanoparticles, Ceram. Int., 2018, 44, 6201–6211, DOI:10.1016/j.ceramint.2018.01.005.
- R. Shyamala and L. G. Devi, Synthesis, characterisation and evaluation of photocatalytic activity of V-doped SnO2 semiconducting particles under solar light, REST J. Emerg. Trends Model. Manuf., 2018, 4, 16–22 Search PubMed.
- C. Method, M. V Arularasu, M. Anbarasu, S. Poovaragan, R. Sundaram, K. Kanimozhi, C. M. Magdalane, K. Kaviyarasu, F. T. Thema, D. Letsholathebe, G. T. Mola and M. Maaza, Structural, Optical, Morphological and Microbial Studies on SnO2 Nanoparticles Prepared by Co-Precipitation Method, J. Nanosci. Nanotechnol., 2018, 18, 3511–3517, DOI:10.1166/jnn.2018.14658.
- M. Ikram, S. Abbas, A. Haider, S. Naz, S. O. A. Ahmad and J. Haider, Efficient dye degradation , antimicrobial behavior and molecular docking analysis of gold (Au) and cellulose nanocrystals (CNC)-doped strontium oxide nanocomposites, J. Nanostructure Chem., 2021, 275704, DOI:10.1007/s40097-021-00452-3.
- S. Ossama, A. Ahmad, M. Ikram, M. Imran and S. Naz, Novel prism shaped C3N4-doped Fe@Co3O4 nanocomposites and their dye degradation and bactericidal potential with molecular docking study, RSC Adv., 2021, 11, 23330–23344, 10.1039/d1ra03949k.
- A. Ul-hamid, H. Dafalla, A. S. Hakeem, A. Haider and M. Ikram, In-Vitro Catalytic and Antibacterial Potential of Green Synthesized CuO Nanoparticles against Prevalent Multiple Drug Resistant Bovine Mastitogen Staphylococcus aureus, Int. J. Mol. Sci., 2022, 23, 2335 CrossRef CAS PubMed.
- V. Paramarta, A. Taufik, L. Munisa and R. Saleh, Sono-and photocatalytic activities of SnO2 nanoparticles for degradation of cationic and anionic dyes Sono- and Photocatalytic Activities of SnO2 Nanoparticles for Degradation of Cationic and Anionic Dyes, Am. Inst. Phys., 2017, 1–8, DOI:10.1063/1.4968378.
- G. Zhang, N. Liu, Z. Ren and B. Yang, Synthesis of High-Purity SnO2 Nanobelts by Using Exothermic Reaction, J. Nanomater., 2011, 2011, 5, DOI:10.1155/2011/526094.
- S. Kaizra, B. Bellal, Y. Louafi and M. Trari, Improved activity of SnO for the photocatalytic oxygen evolution, J. Saudi Chem. Soc., 2017, 22(4), 76–78, DOI:10.1016/j.jscs.2017.07.005.
- B. Singh, R. Narendra and P. Singh, Chitosan–polyaniline–copper(II) oxide hybrid composite for the removal of methyl orange dye, Polym. Bull., 2020, 77, 4833–4850, DOI:10.1007/s00289-019-02994-7.
- S. Zhan, D. Li, S. Liang, X. Chen and X. Li, A novel flexible room temperature ethanol gas sensor based on SnO2 doped poly-diallyldimethylammonium chloride, Sensors, 2013, 13, 4378–4389, DOI:10.3390/s130404378.
- M. M. Rashad, A. A. Ismail, I. Osama, I. A. Ibrahim and A. H. Kandil, Photocatalytic decomposition of dyes using ZnO doped SnO2 nanoparticles prepared by solvothermal method, Arab, J. Chem., 2014, 7, 71–77, DOI:10.1016/j.arabjc.2013.08.016.
- A. N. Naje, Preparation and Characterization of SnO2 Nanoparticles, Innovative Res., 2015, 565, 2319–8753 Search PubMed.
- K. C. Suresh, S. Surendhiran, P. Manoj Kumar, E. Ranjth Kumar, Y. A. Khadar and A. Balamurugan, Green synthesis of SnO2 nanoparticles using Delonix elata leaf extract: Evaluation of its structural, optical, morphological and photocatalytic properties, SN Appl. Sci., 2020, 2, 1–13, DOI:10.1007/s42452-020-03534-z.
- H. Letifi, Y. Litaiem, D. Dridi, S. Ammar and R. Chtourou, Enhanced Photocatalytic Activity of Vanadium-Doped SnO2 Nanoparticles in Rhodamine B Degradation, Adv. Condens. Matter Phys., 2019, 2019, 2157428, DOI:10.1155/2019/2157428.
- S. Selvarajan, A. Suganthi and M. Rajarajan, A facile approach to synthesis of mesoporous SnO2/chitosan nanocomposite modified electrode for simultaneous determination of ascorbic acid, dopamine and uric acid, Surf. Interfaces, 2017, 7, 146–156, DOI:10.1016/j.surfin.2017.03.008.
- K. Vignesh, R. Hariharan, M. Rajarajan and A. Suganthi, Photocatalytic performance of Ag doped SnO2 nanoparticles modified with curcumin, Solid State Sci., 2013, 21, 91–99, DOI:10.1016/j.solidstatesciences.2013.04.017.
- K. Saravanakumar and V. Muthuraj, Fabrication of sphere like plasmonic Ag/SnO2 photocatalyst for the degradation of phenol, Optik, 2017, 131, 754–763, DOI:10.1016/j.ijleo.2016.11.127.
- A. Bouaine, N. Brihi, G. Schmerber, C. Ulhaq-Bouillet, S. Colis and A. Dinia, Structural, optical, and magnetic properties of Co-doped SnO2 powders synthesized by the coprecipitation technique, J. Phys. Chem. C, 2007, 111, 2924–2928, DOI:10.1021/jp066897p.
- A. D. Khan, M. Ikram, A. Haider, A. Ul-Hamid, W. Nabgan and J. Haider, Polyvinylpyrrolidone and chitosan-doped lanthanum oxide nanostructures used as anti-bacterial agents and nano-catalyst, Appl. Nanosci., 2022, 12, 2227–2239, DOI:10.1007/s13204-022-02471-0.
- K. Sujatha, T. Seethalakshmi, A. P. Sudha and O. L. Shanmugasundaram, Photocatalytic activity of pure, Zn doped and surfactants assisted Zn doped SnO2 nanoparticles for degradation of cationic dye, Nano-Struct. Nano-Objects, 2019, 18, 100305, DOI:10.1016/j.nanoso.2019.100305.
- S. Gnanam and V. Rajendran, Luminescence Properties of Eg-Assisted SnO2 Nanoparticles by Sol-Gel Process S, Dig. J. Nanomater. Biostructures., 2010, 5, 699–704 Search PubMed.
- R. S. Ningthoujam, D. Lahiri, V. Sudarsan, H. K. Poswal, S. K. Kulshreshtha, S. M. Sharma, B. Bhushan and M. D. Sastry, Nature of Vn+ ions in SnO2: EPR and photoluminescence studies, Mater. Res. Bull., 2007, 42, 1293–1300, DOI:10.1016/j.materresbull.2006.10.006.
- C. M. Ma, G. B. Hong and S. C. Lee, Facile Synthesis of Tin Dioxide Nanoparticles for Photocatalytic Degradation of Congo Red Dye in Aqueous Solution, Catalysts, 2020, 10(7), 792 CrossRef CAS.
- Y. T. Gebreslassie and H. G. Gebretnsae, Green and Cost-Effective Synthesis of Tin Oxide Nanoparticles: A Review on the Synthesis Methodologies, Mechanism of Formation, and Their Potential Applications, Nanoscale Res. Lett., 2021, 16, 97, DOI:10.1186/s11671-021-03555-6.
- D. Chandran, L. S. Nair, S. Balachandran, K. Rajendra Babu and M. Deepa, Structural, optical, photocatalytic, and antimicrobial activities of cobalt-doped tin oxide nanoparticles, J. Sol-Gel Sci. Technol., 2015, 76, 582–591, DOI:10.1007/s10971-015-3808-z.
- L. Zhang, Y. Ding, M. Povey and D. York, ZnO nanofluids-A potential antibacterial agent, Prog. Nat. Sci., 2008, 18, 939–944, DOI:10.1016/j.pnsc.2008.01.026.
- R. Jalal, E. K. Goharshadi, M. Abareshi, M. Moosavi, A. Yousefi and P. Nancarrow, ZnO nanofluids: Green synthesis, characterization, and antibacterial activity, Mater. Chem. Phys., 2010, 121, 198–201, DOI:10.1016/j.matchemphys.2010.01.020.
- Y. Li, W. Zhang, J. Niu and Y. Chen, Mechanism of photogenerated reactive oxygen species and correlation with the antibacterial properties of engineered metal-oxide nanoparticles, ACS Nano, 2012, 6, 5164–5173, DOI:10.1021/nn300934k.
- V. K. Vidhu and D. Philip, Phytosynthesis and applications of bioactive SnO2 nanoparticles, Mater. Charact., 2015, 101, 97–105, DOI:10.1016/j.matchar.2014.12.027.
- M. M. Kumari and D. Philip, Synthesis of biogenic SnO2 nanoparticles and evaluation of thermal , rheological , antibacterial and antioxidant activities, Powder Technol., 2015, 270, 312–319, DOI:10.1016/j.powtec.2014.10.034.
- A. Phukan, R. P. Bhattacharjee and D. K. Dutta, Stabilization of SnO2 nanoparticles into the nanopores of modified Montmorillonite and their antibacterial activity, Adv. Powder Technol., 2017, 28, 139–145, DOI:10.1016/j.apt.2016.09.005.
- S. A. Khan, S. Kanwal, K. Rizwan and S. Shahid, Enhanced antimicrobial, antioxidant, in vivo antitumor and in vitro anticancer effects against breast caner cell line by green synthesized un-doped SnO2 and Co-doped SnO2 nanoparticles from Clerodendrum inerme, Microb. Pathog., 2018, 125, 366–384, DOI:10.1016/j.micpath.2018.09.041.
- M. Ikram, N. Abid, A. Haider and A. Ul-hamid, Toward efficient dye degradation and the bactericidal behavior of Mo-doped La2O3 nanostructures, Nanoscale Adv., 2022, 926–942, 10.1039/d1na00802a.
- A. Shahpal, M. A. Choudhary and Z. Ahmad, An investigation on the synthesis and catalytic activities of pure and Cu-doped zinc oxide nanoparticles An investigation on the synthesis and catalytic activities of pure and Cu-doped zinc oxide nanoparticles, Cogent Chem., 2017, 3(1), 1301241, DOI:10.1080/23312009.2017.1301241.
- R. Shyamala and L. G. Devi, Synthesis, characterisation and evaluation of photocatalytic activity of V-doped SnO2 semiconducting particles under solar light, REST J. Emerg. Trends Model. Manuf., 2018, 4, 16–22 Search PubMed.
- S. Wu, C. Li, W. Wei, H. Wang, Y. Zhu and Y. Song, Synthesis and photocatalytic property of Ce-doped SnO2, J. Rare Earths, 2010, 28, 168–170, DOI:10.1016/S1002-0721(10)60312-2.
- P. Borker, A. Salker and R. D. Gaokar, Sunlight driven improved photocatalytic activity of Mn doped SnO2 nanowires, Mater. Chem. Phys., 2021, 270, 124797, DOI:10.1016/j.matchemphys.2021.124797.
- K. Vignesh, R. Hariharan, M. Rajarajan and A. Suganthi, Photocatalytic performance of Ag doped SnO2 nanoparticles modified with curcumin, Solid State Sci., 2013, 21, 91–99, DOI:10.1016/j.solidstatesciences.2013.04.017.
- P. A. Luque, H. E. Garrafa-Gálvez, O. Nava, A. Olivas, M. E. Martínez-Rosas, A. R. Vilchis-Nestor, A. Villegas-Fuentes and M. J. Chinchillas-Chinchillas, Efficient sunlight and UV photocatalytic degradation of Methyl Orange, Methylene Blue and Rhodamine B, using Citrus×paradisi synthesized SnO2 semiconductor nanoparticles, Ceram. Int., 2021, 47, 23861–23874, DOI:10.1016/j.ceramint.2021.05.094.
- V. K. Gupta, R. Saravanan, S. Agarwal, F. Gracia, M. M. Khan, J. Qin and R. V. Mangalaraja, Degradation of azo dyes under different wavelengths of UV light with chitosan-SnO2 nanocomposites, J. Mol. Liq., 2017, 232, 423–430, DOI:10.1016/j.molliq.2017.02.095.
- F. Akkad and S. Joseph, Physicochemical characterization of point defects in fluorine doped tin oxide films, Appl. Phys., 2012, 112(2), 222406, DOI:10.1063/1.4736798 ,” aip.scitation.org.
- C. B. Fitzgerald, M. Venkatesan, L. S. Dorneles, R. Gunning, P. Stamenov, J. M. D. Coey, P. A. Stampe, R. J. Kennedy, E. C. Moreira and U. S. Sias, Magnetism in dilute magnetic oxide thin films based on SnO2, Phys. Rev. B: Condens. Matter Mater. Phys., 2006, 74, 115307, DOI:10.1103/physrevb.74.115307.
- Y. Liang and B. Fang, Hydrothermal synthesis of SnO2 nanorods: morphology dependence, growth mechanism and surface properties, Mater. Res. Bull., 2013, 48(10), 4118–4124, DOI:10.1016/j.materresbull.2013.06.040.
- V. Inderan, M. Arafat, A. S. M. A. Haseeb, K. Sudesh and H. L. Lee, A Comparative Study of Structural and Ethanol Gas Sensing Properties of Pure, Nickel and Palladium Doped SnO2 Nanorods Synthesised by the Hydrothermal Method, J. Phys. Sci., 2019, 30(1), 127–143, DOI:10.21315/jps2019.30.1.10.
- Z. Li et al., Interpenetrating network V2O5 nanosheets/carbon nanotubes nanocomposite for fast lithium storage,”pubs.rsc.org, accessed: Aug. 04 2022. [Online].
| This journal is © The Royal Society of Chemistry 2022 |

