
 Open Access Article
 This Open Access Article is licensed under a Creative Commons Attribution-Non Commercial 3.0 Unported Licence
Antidiabetic, cytotoxic and antioxidant activities of Rhodomyrtus tomentosa leaf extracts
Muddatstsir Idrisab,
Edwin Risky Sukandara,
Adi Setyo Purnomo a,
Fahimah Martaka and
Sri Fatmawati*ac
a,
Fahimah Martaka and
Sri Fatmawati*ac
aDepartment of Chemistry, Faculty of Science and Data Analytics, Institut Teknologi Sepuluh Nopember, Keputih, Sukolilo, Surabaya, 60111, Indonesia. E-mail: fatma@chem.its.ac.id
bDepartment of Pharmacy, Faculty of Mathematics and Natural Sciences, University of Lambung Mangkurat, A. Yani KM. 35.8, Banjarbaru, 70714, South Kalimantan, Indonesia
cAgri-food and Biotechnology Research Center, Institut Teknologi Sepuluh Nopember, Jalan Arif Rahman Hakim, Sukolilo, Surabaya, 60111, East Java, Indonesia
First published on 9th September 2022
Abstract
As part of our project on exploring Indonesian medicinal plants for antidiabetic and anticancer agents, this study was conducted to investigate the total phenolic and flavonoid contents, and antioxidant, cytotoxic and antidiabetic properties of R. tomentosa leaf extracts. The antioxidant activity was tested using DPPH, ABTS, and FRAP methods. In vitro cytotoxic assay was performed against MCF-7, HeLa, A549, and B16 cancer cell lines. The in vitro antidiabetic testing was determined using α-glucosidase and α-amylase inhibitory evaluation, while STZ-induced diabetic rats were used for in vivo study. The highest values of total phenolic (191.97 ± 0.19 mg GAE g−1) and flavonoid (29.11 ± 0.05 mg QE g−1) contents were recorded in methanolic extract. This extract also showed the highest DPPH and ABTS activities with IC50 values of 7.79 ± 0.03 and 4.03 ± 0.02 μg mL−1, respectively, as well as the highest FRAP activity with a value of 64.05 ± 0.54 μM Fe2+ g−1. The methanol extract had cytotoxicity against MCF-7, HeLa, A549, and B16 cancer cell lines with IC50 values of 123.49 ± 0.79, 28.28 ± 0.17, 168.88 ± 1.14, and 42.44 ± 0.18 μg mL−1, respectively. In vitro antidiabetic evaluation indicated that the MeOH extract inhibited α-glucosidase and α-amylase with IC50 values of 45.73 ± 1.06 and 41.31 ± 1.12 μg mL−1, respectively. A dose of 400 mg kg−1 body weight of the MeOH extract reduced rats' blood glucose rate and serum blood glucose by 48.51% and 17.73%, respectively after 15 days of treatment. Taken together, these findings suggested that the methanolic extract of R. tomentosa leaves can be used as a potential source of antioxidant, cytotoxic, and antidiabetic agents.
Introduction
Diabetes type 2 is called non-insulin-dependent or adult-onset diabetes, and is caused by the body's ineffective use of insulin. Ineffective use of insulin by the body causes blood sugar levels to exceed normal limits. Diabetes is a dangerous disease because it is the main cause of heart disease, kidney failure and stroke.1 Traditional medicines using medicinal plants as a therapeutic agent are still frequently used today to treat diabetes through several mechanisms. The common way is to inhibit the enzymes such as α-glucosidase2 and α-amylase3 that are responsible in hydrolytic breakdown of carbohydrates, and therefore the absorption of glucose into the blood is slowed down. Meanwhile, cancer is one of the main causes of death in the world with about 9.6 million deaths were recorded in 2018.4 Cancer is caused by abnormal growth of cells due to various gene mutations and unstoppable cell division. An effort in searching of effective cancer drugs becomes main research focus, as the number of new cancer cases increases per year.5R. tomentosa has been known as a potential medicinal plant. R. tomentosa is widely distributed in Asia such as Vietnam, Japan, China, Philippines, Malaysia and Thailand. The leaves, roots, buds and fruit of this plant have been used as traditional medicine. Vietnamese, Chinese and Malaysians use this plant to cure stomachaches, dysentery, abscesses, and sepsis. In Thailand, this plant is used as an antipyretic, anti-diarrheal, and antidysentery. In Indonesia, R. tomentosa is used for wounds healing,6 while Kalimantan people use the leaves as a blood sugar-lowering drug.
R. tomentosa contains various phytochemical compositions in many parts of the plant including terpenoids, phenols and lipids. Triterpenoids have been identified from the leaves of R. tomentosa, including lupeol, β-amyrin, β-amyrenonol, and botulin. The phenolic compounds (major component) were identified from R. tomentosa, such as rhodomyrtosone A, rhodomyrtosone B, rhodomyrtosone C, and rhodomyrtosone D.7 In addition, R. tomentosa is used as an antioxidant, antibacterial, anticancer, and anti-inflamation. The IC50 value of DPPH radical scavenging activity for anthocyanins-rich extract of R. tomentosa fruits and ascorbic acid were 6.27 ± 0.25 μg mL−1 and 17.4 ± 0.31 μg mL−1, respectively. The IC50 value of ABTS radical scavenging activity for the same extract and ascorbic acid were 90.3 ± 1.52 μg mL−1 and 206 ± 2.37 μg mL−1, respectively.8 However, only a few comprehensive studies were reported on the antioxidant and antidiabetic evaluation of the leaves extract of R. tomentosa. Therefore, this study was conducted to evaluate Total Phenolic Content (TPC) and Total Flavonoid Content (TFC), antioxidant activities (DPPH, ABTS, and FRAP), cytotoxicity against MCF-7, HeLa, A549, and B16 cancer cell lines and antidiabetic activities in vitro and in vivo of leaves extracts of R. tomentosa.
Materials and methods
Animals
Male albino Wistar rats (160–200 g) used were given a standard pellet diet and placed in cages at a relative humidity of 55 ± 10% and temperature of 25 ± 1 °C. All animal procedures were performed in accordance with the Guidelines for Care and Use of Laboratory Animals of “Stem Cell Laboratory, Airlangga University, Surabaya, Indonesia” and approved by the Animal Ethics Committee of “Health Research Ethics Committee of School of Medicine, Airlangga University (161/EC/KEPK/FKUA/2021)”. Humans have not been used as subjects in this study.Plant materials
The leaves of R. tomentosa were collected in June 2019 at Banjarbaru, South Kalimantan, Indonesia, and identified by Mr Edi Suroto, a botanist at Purwodadi Botanical Garden, Pasuruan, Indonesia. The voucher specimen was deposited at Laboratory of Natural Products and Synthetic Chemistry, Institut Teknologi Sepuluh Nopember, Surabaya, Indonesia (012/VI/HT-KIBAS/2019).Extraction
The extraction process was carried out separately for each sample using four different solvents, including n-hexane, dichloromethane (CH2Cl2), ethyl acetate (EtOAc), and methanol (MeOH). The dried leaves of R. tomentosa (each 20.0 g) were extracted with 250 mL of n-hexane, CH2Cl2, and EtOAc for 24 h in room temperature, while the dried leaves of R. tomentosa (5.0 kg) were extracted with 30 L of MeOH using the same treatment. Each extract was filtered using filter paper and concentrated with a rotary evaporator to give crude n-hexane (0.37 g), CH2Cl2 (0.90 g), EtOAc (0.70 g), and MeOH (723.0 g) extracts.Total phenolic content (TPC)
The total phenolic content of the MeOH, EtOAc, CH2Cl2, and n-hexane extracts of R. tomentosa was determined using Follin–Ciocalteu's method.9 Each extract with various concentrations in methanol was taken 0.5 mL and then mixed with 2.0 mL of 7.5% sodium carbonate solution and 10% Follin–Ciocalteu's reagent from Sigma-Aldrich (St. Louis, MO, USA). Absorbance was measured using a UV-vis spectrophotometer at 765 nm after incubation at 40 °C for 1 h. Next, gallic acid (Sigma-Aldrich) with concentrations of 0–200 mg L−1 was used as the standard curve. The TPC of the extracts were calculated as mg GAE (gallic acid equivalent) g−1 of dry extract.Total Flavonoid Content (TFC)
The TFC of the MeOH, EtOAc, CH2Cl2, and n-hexane extracts of R. tomentosa leaves was measured by spectrophotometer, as previously reported method10 with minor modification. Each extract with concentrations of 100–1000 ppm was taken 0.5 mL and then mixed with 0.5 mL of a solution of 2% AlCl3 (Sigma-Aldrich) in methanol. The mixture was incubated for 1 hour and the absorbance was measured at 415 nm using a UV-vis spectrophotometer. Quercetin (Sigma-Aldrich) with concentrations of 0–50 mg L−1 was used as the standard curve. The TFCs of the extracts were calculated as mg QE (quercetin equivalent) per g of dry extract.DPPH radical scavenging assay
DPPH (1,1-diphenyl-2-picrylhydrazyl) radicals scavenging activity was determined as previously described.4 33.3 μL of each extract at different concentrations (159.73–4.99 μg mL−1) was added to 1 mL of DPPH 6.0 × 10⁻⁵ M and the mixture were incubated at 37 °C for 20 minutes in dark room. The absorbance was measured at 517 nm using UV-visible Spectrophotometer (Thermo Fisher Scientific, USA) with three replications. Blank sample was a mixture of 33.3 μL of DPPH and methanol solution, while gallic acid was used as the positive control. The percentage of DPPH capacity was estimated by applying the following equation.| Inhibition (%) = (blank abs-sample abs)/(blank abs) × 100% | (1) |
ABTS radical scavenging assay
ABTS, 2,2′′-azinobis (3-ethylbenzothiazoline-6-sulfonic acid) radical scavenging assay was performed using previous method.11 Briefly, 88 μL of 140 mM potassium peroxydisulfate (K2S2O6) and 5.0 mL of 7 mM ABTS stock solution were mixed and stored for 12–16 h before use in the dark at room temperature. The mixture was added with an ethanol solution (99.5%) until a working solution was obtained with an absorbance of 0.7 (±0.02) at 734 nm. Each extract with various concentrations (49.51–1.55 μg mL−1) was added 1 mL onto the working solution and then stirred manually for 10 s and incubated for 4 min at 30 °C. Each solution was measured the absorbance at 734 nm with a UV-vis spectrophotometer. Gallic acid and ethanol were used as a positive control and blank sample, respectively. The ABTS Radical Scavenging Assay was calculated with the eqn (1).Ferric-reducing antioxidant power (FRAP) assay
The FRAP assay was determined using the reported method12 with slight modification. The reduction of colorless of Fe3+-tripyridyltriazine to strongly blue-colored of Fe2+-tripyridyltriazine is often determined by measuring the absorbance change at 593 nm. A total of 300 mM acetate buffer pH 3.6, 10 mM 2,4,6-tris(2-pyridyl)-s-triazine (TPTZ) (Sigma-Aldrich) solution in 40 mM HCl, and 20 mM FeCl3·6H2O were mixed in the ratio of 10![[thin space (1/6-em)]](https://www.rsc.org/images/entities/char_2009.gif) :1:1 to get working FRAP reagent. FeSO4·7H2O was used for FRAP standard curve. Sample solution (100 μL), FRAP reagent (2 mL), and distilled water (900 μL) were mixed and incubated at 37 °C in a dark room for 30 min. The mixture absorbance was measured at 593 nm. A mixture of H2O (1 mL) and FRAP reagent (2 mL) was used as the blank sample. Finally, the FRAP values were stated as mM Fe2+ g−1 of sample (FRAP value of sample (μM) = abs (sample) × FRAP value of std (μM)/abs (std)).
:1:1 to get working FRAP reagent. FeSO4·7H2O was used for FRAP standard curve. Sample solution (100 μL), FRAP reagent (2 mL), and distilled water (900 μL) were mixed and incubated at 37 °C in a dark room for 30 min. The mixture absorbance was measured at 593 nm. A mixture of H2O (1 mL) and FRAP reagent (2 mL) was used as the blank sample. Finally, the FRAP values were stated as mM Fe2+ g−1 of sample (FRAP value of sample (μM) = abs (sample) × FRAP value of std (μM)/abs (std)).
In vitro α-glucosidase inhibitory activity
The anti-α-glucosidase assay was carried out using rat intestinal enzyme.13 The rat enzyme solution was prepared from rat intestinal acetone powder (Sigma, St. Louis). Rat intestinal acetone powder (1 g) was homogenized in 30 mL of normal saline. After centrifugation (12000g × 30 min), the aliquot was subjected to assay. Each extract of R. tomentosa leaves (5 mg mL−1 in DMSO, 10 μL) was added with 50 μL of the 0.1 M phosphate buffer (pH 6.9), 20 μL of the maltose substrate solution (10 mM) in 0.1 M phosphate buffer, 80 μL of glucose assay kit (SU-GLLQ2, Human), and 20 μL of the rat enzyme solution. The reaction mixture was then incubated at 37 °C for 10 min. A microplate reader (BioTek ELx800TM, BioTek Instruments, Inc, Winooski, VT, USA) was used to measure the absorbance of enzymatic activity at 520 nm. Inhibition (%) was calculated based on eqn (2).| Inhibition (%) = (blank abs-sample abs)/(blank abs) × 100% | (2) |
where; Abs blank = Abs enzyme reaction − Abs blank of enzyme reaction
where; Abs sample = Abs sample reaction − Abs blank of sample reaction
In vitro α-amylase inhibitory activity
The anti-α-amylase assay was adapted from ref. 14 with a slight modification. Each sample (10 mg) was dissolved in 1 mL of DMSO and the α-amylase enzyme was prepared by dissolving 5 mg of porcine pancreas α-amylase in 1 mL of 0.1 M phosphate buffer (pH 6.9). 100 mg of starch potato (substrate) was warmed in 5 mL of 0.1 M phosphate buffer (pH 6.9) for 5 minutes and cooled at room temperature. 10 μL of sample and 250 μL of substrate were mixed into 150 μL of 0.1 M phosphate buffer (pH 6.9). After preincubation for 5 minutes, 100 μL of α-amylase enzyme was added into the mixture and further incubated at 37 °C for 15 minutes. The reaction was stopped by adding 250 μL of 1M HCl and 250 μL of 10% iodine solution. Acarbose was used as a positive control and the absorbance was measured at 650 nm by microplate reader (BioTek ELx800TM, BioTek Instruments, Inc, Winooski, VT, USA), and inhibition percentage was calculated using eqn (2).In vivo antidiabetic activity assay
The in vivo antidiabetic assay was adapted from (ref. 15) with slight modifications. The rats used were male albino Wistar rats. The rats were fasted for 8–12 hours before streptozocin (STZ) injection. The rats were induced by STZ (60 mg kg−1) was induced via single intraperitoneal injection. The blood glucose rate was observed on the third day after STZ injection. Rats with blood sugar rates more than 200 mg dL−1 were used for further testing. Diabetic rats were classified to 5 groups as follows: G1 (0.5% of NaCMC as negative control), G2 (10 mg kg−1 of glibenclamide as positive control), G3 (200 mg kg−1 of extract), G4 (400 mg kg−1 of extract), and G5 (600 mg kg−1 of extract). Additionally, one group is used for normal control (without treatment), named as G6. One group consists of four rats. The extract, glibenclamide, and NaCMC were administered orally for 15 days. Blood glucose was measured at 0, 3, 6, 9, 12, and 15 days by ACCU Check Instant and the serum glucose was measured at 0 and 15 days by spectrophotometer UV-vis. Serum glucose analysis was performed using the glucose test method. First, 1 mL of rat blood was transferred to centrifuge tube and centrifuged at 4000 rpm for 15 minutes to separate the blood plasma and serum. The serum (10 μL) was taken and mixed with 1000 μL of kit reagent, then put into a test tube and vortexed to make it homogeneous. The mixture was incubated at 37 °C for 10 minutes or at 30 °C for 20 minutes, while the absorbance calculation was conducted at 500 nm. The absorbance measurement of the blank and standard (glucose) was conducted in the same way as the sample, and the serum glucose (mg dL−1) was calculated using eqn (3).| Glucose (mg dL−1) = (Abssample)/(Absstandard) × glucose standard (mg dL−1) | (3) |
In vitro cytotoxic activity assay
The in vitro cytotoxic assay against the human cervix adenocarcinoma (HeLa), human breast adenocarcinoma (MCF-7), human lung carcinoma (A549), and murine melanoma (B16) cancer cell lines was performed using the PrestoBlue (PB) method.16 The cells were preserved with a complete RPMI medium containing 50 μL/50 mL antibiotics and 10% (v/v) FBS. Cell cultures with a density of 170000 cells per mL of medium were then incubated in 96 well plates at 37 °C for 24 hours in 5% CO2. Next, samples with concentrations from 2.34 to 300 μg mL−1 were added to fresh medium and incubated for 48 hours. PrestoBlue reagent (Thermo Fisher Scientific, Uppsala, Sweden) was added to the medium. Then, the absorbance of the mixture's was measured using a multimode reader at 570 nm. Cisplatin is used as positive control.
Phytochemical profiling using HPLC analysis
The analysis was performed on a Ultimate 3000 instrument (Thermo Fisher Scientific) with a UV-vis detector. The system was equipped with an Hypersil GOLD C18 column (250 × 4.6 mm) with the flow rate of 1.0 mL min−1 at 30 °C. Approximately 1.0 mg of each extract was dissolved with methanol (1.0 mL) and filtered using PTFE filter before sample injection. The mobile phase used was methanol (A) and water (B) with a gradient elution of 60–75% A at 0–20 min, 75–85% A at 20–35 min, 85–100% A at 35–50 min, and 100% at 50–60 min. The injection volume was set to 20 μL and the UV detector was set to 254, 280, 310, and 325 nm for the analysis of phenolic and non-phenolic contents.Statistical analysis
The data were summarized using the formula of mean ± standard deviation. Linear regression equation was used to determine concentrations of antioxidant and cytotoxicity. Nonlinear regression equation used to determine concentrations of anti-α-glucosidase and anti-α-amylase activities. Statistical differences between groups in anti-oxidan were analyzed by Student's t-test in antioxidant evaluation and in vitro α-glucosidase and α-amylase inhibition assay. A p-value of <0.01 was considered to be statistically significant difference. Meanwhile, the results of in vivo antidiabetic assay were analyzed by ANOVA followed by Least Significance Different (LSD) where a p-value of <0.05 was considered as statistically significant difference.Results and discussion
Total phenolic and flavonoid contents
Table 1 shows the TPC and TFC values of n-Hexane, CH2Cl2, EtOAc, and MeOH extracts from the R. tomentosa leaves.| Extract | TPC (mg GAE g−1 extract) | TFC (mg QE g−1 extract) |
|---|---|---|
| a Data are expressed as mean ± SD of triplicate experiments. | ||
| n-Hexane | 25.62 ± 0.11 | 10.55 ± 0.04 |
| CH2Cl2 | 119.11 ± 0.19 | 25.73 ± 0.05 |
| EtOAc | 113.95 ± 0.30 | 22.32 ± 0.04 |
| MeOH | 191.97 ± 0.19 | 29.11 ± 0.05 |
The TPC values of the R. tomentosa extracts were determined from a linear gallic acid standard curve. Table 1 shows that the MeOH extract had the highest TPC value, followed by the CH2Cl2 and EtOAc extracts. This shows that the phenolic compounds in the leaves of R. tomentosa are mostly in polar and semi-polar. This fact was supported by T. S. Vo and D. H. Ngo in 2019 (ref. 7) who reported the presence of phenolic derivatives as major metabolites isolated from the alcoholic extract of R. tomentosa leaves. Meanwhile, the TFCs of the R. tomentosa extracts were determined from a linear quercetin standard curve. The result indicated that the most flavonoid compounds are exist in polar part of R. tomentosa. The MeOH extract had the highest TFC value followed by the CH2Cl2 and EtOAc extracts. Flavonoid compounds such as kaempferol, quercetin-7,4′-diglucoside, dihydromyricetin, vitexin, myricetin, and quercetin were isolated from MeOH extract from aerial parts of R. tomentosa.6
Antioxidant activity
Table 2 illustrates the DPPH radical scavenging assay conducted on n-hexane, CH2Cl2, EtOAc, and methanol extracts of R. tomentosa leaves, and gallic acid (positive control) with IC50 values of 25.09 ± 0.14, 20.81 ± 0.21, 13.95 ± 0.08, 7.79 ± 0.03, and 5.29 ± 0.02 μg mL−1, respectively. The result indicated that the methanol extract showed the highest antioxidant activity compared to the less polar extracts and comparable to the positive control. The activity might be due to the presence of phenolic constituents which abundant in polar part. This is in accordance with the result of total phenolic content analysis of the methanol extract which was higher than the less polar extracts (Table 1).| Extracts | DPPH | ABTS | FRAP (μM Fe2+ g−1) |
|---|---|---|---|
| IC50 (μg mL−1) | IC50 (μg mL−1) | ||
| a Data are expressed as mean ± SD of triplicate experiments, *p <0.01 vs. positive control, Nt: not tested. | |||
| n-Hexane | 25.09 ± 0.14* | 18.21 ± 0.04* | 12.15 ± 0.14* |
| CH2Cl2 | 20.81 ± 0.21* | 5.05 ± 0.02* | 32.91 ± 0.27* |
| EtOAc | 13.95 ± 0.08* | 12.80 ± 0.01* | 44.09 ± 0.09* |
| Methanol | 7.79 ± 0.03* | 4.03 ± 0.02* | 64.05 ± 0.54* |
| Gallic acid | 5.29 ± 0.02 | 0.12 ± 0.01 | Nt |
| Ascorbic acid | Nt | Nt | 30.62 ± 0.27 |
A typical approach for testing antioxidant activity is DPPH method. The free radical in DPPH takes an electron or a hydroxy radical from another source and becomes stable diamagnetic molecule.17 The color change from purple to yellow indicates that the radicals are taken up by antioxidants through a hydrogen contribution to stabilize molecules of DPPH.18
Table 2 shows that the highest ABTS assay result was methanol extract with an IC50 value of 4.03 ± 0.02 μg mL−1 followed by the CH2Cl2 extract with an IC50 value of 5.05 ± 0.02 μg mL−1. The CH2Cl2 and MeOH extracts showed weaker activity in the DPPH test than the ABTS assay, possibly due to the reaction differences of phenolic compounds and free radicals in the organic phase of the DPPH assay and the aqueous phase of the ABTS assay.19
FRAP assay (Table 2) shows that the methanol extract has the value approximately 2-fold higher than ascorbic acid as the positive control with a value of 64.05 ± 0.54 (μM Fe2+ g−1) followed by the EtOAc and CH2Cl2 extracts with values of 44.09 ± 0.09. And 32.91 ± 0.27 (μM Fe2+ g−1), respectively. The FRAP evaluation indicates a sample's capacity to participate in a one-electron redox reaction.20 FRAP is directly proportional to the TPC and TFC values, possibly due to the presence of phenolic and flavonoids contents, which act as electron donors to neutralize free radicals.
The results of the DPPH, ABTS, and FRAP assay showed significant differences between the extracts (n-hexane, CH2Cl2, EtOAc, and MeOH) and the positive control based on the t-Test (p <0.01).
Table 3 describes the correlation of the TPC, TFC, and antioxidant activities of R. tomentosa leaves extracts. Pearson correlation was used to calculate the relationship. A strong correlation was observed between TPC and TFC with r = 0.961 (p <0.05), which means that the higher the TPC, the higher the TFC. A positive correlation was observed between DPPH vs. TPC and DPPH vs. TFC with r = 0.091 (p <0.05) and r = 0.215 (p <0.05), respectively. There was a positive correlation between ABTS and TPC with r = 0.114 (p <0.05). ABTS vs. TFC showed a positive correlation with r = 0.054 (p <0.05). ABTS vs. DPPH showed a fairly strong correlation with r = 0.612 (p <0.05). A strong correlation was observed between FRAP and TPC with r = 0.969 (p <0.05) as well as FRAP and TFC with r = 0.884 (p <0.05). FRAP vs. DPPH showed a positive correlation with r = 0.017 (p <0.05). A positive correlation was observed between FRAP and ABTS with r = 0.225 (p <0.05). Generally, TPC and TFC play an important role in the antioxidant activity acting as an electron donor, chain breaker, and free radical scavenger.21 This data concluded that there is a positive correlation between TPC and TFC with antioxidant activities.
In vitro antidiabetic assay
The antidiabetic activity of the extract was tested using the α-glucosidase and α-amylase enzyme inhibition method. The results of in vitro antidiabetic assay are shown in Table 4.| Extracts | α-Glucosidase | α-Amylase | ||
|---|---|---|---|---|
| % Inhibition ± SD (5 mg mL−1) | IC50 (μg mL−1) | % Inhibition ± SD (5 mg mL−1) | IC50 (μg mL−1) | |
| a Data are expressed as mean ± SD of triplicate experiments, *p <0.01 vs. positive control, Nt: not tested. | ||||
| n-Hexane | 13.63 ± 1.80* | Nt | Nt | Nt |
| CH2Cl2 | 15.32 ± 1.21* | Nt | Nt | Nt |
| EtOAc | 31.79 ± 0.78* | Nt | Nt | Nt |
| MeOH | 81.91 ± 1.09* | 45.73 ± 1.06* | 82.41 ± 2.21* | 41.31 ± 1.12* |
| Acarbose | 87.14 ± 2.36 | 7.67 ± 1.14 | 94.01 ± 1.56 | 8.70 ± 0.79 |
Table 4 shows the results of screening for the anti-α-glucosidase activity of n-hexane, CH2Cl2, EtOAc and methanol extracts as well as acarbose as the positive control. The methanolic extract displayed the highest activity with inhibition of 81.91%, which was comparable to acarbose at the same concentration of 5 mg mL−1, while the other extracts were less active with inhibition lower than 50%. A concentration-dependent experiment was conducted on the methanol extract and gave the IC50 values of 45.73 ± 1.06 μg mL−1, which was 6-fold weaker than that of acarbose as the positive control (IC50 = 7.67 ± 1.14 μg mL−1). The in vitro α-glucosidase inhibition data has not been reported previously and it can provide insight for further studies on R. tomentosa leaves extract as an antidiabetic therapy. The screening result of anti-α-glucosidase assay showed that the methanol extract had the highest inhibitory potential and thus was used for in vitro anti-α-amylase evaluation and in vivo antidiabetic study.
Table 4 shows that α-amylase inhibition of the methanol extract was comparable to acarbose with the inhibition percentage of 82.41 ± 2.21% and 94.01 ± 1.56%, respectively at 5 mg mL−1. Further analysis indicated that the MeOH extract inhibited α-amylase enzyme with IC50 value of 41.31 ± 1.12 μg mL−1, which was 5-fold higher than acarbose.
The results of the anti-α-glucosidase and anti-α-amylase activities showed significant differences between the extracts and the positive control based on the t-Test (p <0.01).
The inhibition of α-glucosidase is one of therapies for treating type 2 diabetes mellitus. This enzyme is commonly found at the border of the small intestine.22 Sugar production is inhibited by an α-glucosidase inhibitor, which function to delay the absorption of complex carbohydrates, and thus gradually reduces glucose absorption and level in blood.23,24
Treatment of diabetes can be performed using alternative medicines from medicinal plants with less side effects. Pancreatic and salivary α-amylases are responsible for breaking down large and insoluble starch molecules into smaller and more easily absorbed units.25 Meanwhile, an effective way to manage diabetes mellitus is to reduce postprandial hyperglycemia by slowing glucose absorption. This is obtained when α-glucosidase and α-amylase activities in hydrolyzing carbohydrates in the digestive organs are inhibited.26
In vivo antidiabetic assay
The effect of methanol extract of R. tomentosa leaves on rat blood glucose levels for 15 days treatments is shown in Table 5. The results showed that a dose of 200 mg kg−1 of the extract reduced the blood glucose level by 31.64%, while doses of 400 and 600 mg kg−1 reduced by 48.51% and 15.96%, respectively.
| Treatment groups | Blood glucose level (mg dL−1) on day | Blood glucose loss (%) | |||||
|---|---|---|---|---|---|---|---|
| 0 | 3 | 6 | 9 | 12 | 15 | ||
| a Values are means ± SD (n = 4), *p <0.05 vs. normal control. | |||||||
| G1 (negative control)* | 559.50 ± 28.20 | 428.50 ± 55.67 | 416.75 ± 54.41 | 458.25 ± 41.04 | 443.25 ± 54.39 | 556.50 ± 26.50 | 0.53 ± 0.41 |
| G2 (positive control)* | 475.75 ± 60.72 | 466.00 ± 116.20 | 402.25 ± 62.14 | 377.50 ± 63.40 | 409.25 ± 53.27 | 340.00 ± 35.59 | 28.53 ± 5.02 |
| G3 (dose I (200 mg kg−1))* | 477.50 ± 141.51 | 425.50 ± 71.11 | 404.75 ± 56.79 | 367.00 ± 40.61 | 370.75 ± 99.21 | 327.25 ± 90.56 | 31.46 ± 5.05 |
| G4 (dose II (400 mg kg−1))* | 502.00 ± 113.27 | 341.75 ± 25.28 | 360.00 ± 14.99 | 288.75 ± 21.82 | 302.25 ± 20.98 | 258.50 ± 22.81 | 48.51 ± 7.23 |
| G5 (dose III (600 mg kg−1))* | 564.00 ± 45.28 | 395.80 ± 71.32 | 357.50 ± 31.98 | 350.00 ± 39.20 | 344.30 ± 37.60 | 474.50 ± 48.06 | 15.96 ± 2.72 |
| G6 (normal control) | 109.5 ± 5.32 | 97.00 ± 5.10 | 97.50 ± 14.06 | 100.50 ± 6.86 | 109.00 ± 6.88 | 109.25 ± 5.62 | 0.00 ± 0.00 |
Table 5 describes the blood glucose decline in rats given methanol extract from R. tomentosa leaves. Blood glucose levels in normal rat was relatively stable during the 15 days experiment, while the negative control experienced a slight decrease in blood glucose levels (0.53%), as NaCMC does not function to lowering blood glucose levels. Meanwhile, positive control can reduce rat blood glucose by 28.53%. This data implied that glibenclamide at a 10 mg kg−1 dose can lower rats blood glucose. The percentage of lowering blood glucose at a 400 mg kg−1 dose was as much as 48.51% and showed the highest as compared to the other two doses. It indicated that the extract with an optimal dose at 400 mg kg−1 was able to repair and protect β-cells. Meanwhile, the higher dose of 600 mg kg−1 can lower blood glucose rates by only 15.96%, which indicated a downward trend in protecting and repairing β-cells, and the insulin production is thus inhibited. The blood glucose levels in diabetic rats decreased significantly (p <0.05) with the administration of R. tomentosa leaves methanol extract. These results were significantly different from the normal group based on the results of ANOVA and LSD analysis. Plant have antihyperglycemic activity due to their ability to restore pancreatic tissue function resulting an increase of insulin production, inhibits intestinal glucose absorption, and facilitates metabolism in insulin-dependent processes.28 Therefore, herbal medicines to treat diabetes can protect β-cells and reduce fluctuation in blood glucose rates. Biological knowledge about the mechanism of action in diabetes treatment is still scarce. However, many plants have been known to contain substances such as flavonoids, terpenoids, and glycosides, which are often associated with antidiabetic effects.30
| Treatment groups | The rat body weight (g) on day | Body weight loss (%) | ||||||
|---|---|---|---|---|---|---|---|---|
| Beginning | 0 | 3 | 6 | 9 | 12 | 15 | ||
| a Values are means ± SD (n = 4), *p < 0.05 vs. normal control, ↓ = decrease, ↑ = increase. | ||||||||
| Normal control | 158.00 ± 6.06 | 158.50 ± 6.35 | 159.25 ± 6.18 | 159.75 ± 5.44 | 158.50 ± 5.45 | 158.50 ± 3.70 | 156.75 ± 4.99 | ↓0.79 ± 0.59 |
| Negative control* | 215.25 ± 15.69 | 200.75 ± 24.60 | 201.25 ± 27.97 | 196.50 ± 28.01 | 195.0 ± 26.52 | 192.75 ± 29.84 | 174.25 ± 10.36 | ↓19.05 ± 1.35 |
| Positive control | 166.25 ± 6.55 | 161.75 ± 7.89 | 160.50 ± 6.61 | 158.25 ± 3.50 | 157.75 ± 4.72 | 155.50 ± 4.73 | 153.50 ± 5.00 | ↓7.67 ± 1.45 |
| Dose I (200 mg kg−1)* | 165.00 ± 1.63 | 151.00 ± 8.21 | 147.00 ± 12.57 | 146.25 ± 13.89 | 148.50 ± 8.02 | 142.50 ± 6.45 | 125.75 ± 2.06 | ↓23.79 ± 1.01 |
| Dose II (400 mg kg−1)* | 169.50 ± 4.20 | 160.75 ± 7.37 | 182.75 ± 26.59 | 175.00 ± 16.27 | 165.50 ± 29.96 | 184.50 ± 18.43 | 187.00 ± 4.97 | ↑10.32 ± 1.12 |
| Dose III (600 mg kg−1)* | 171.00 ± 6.68 | 161.25 ± 9.95 | 166.75 ± 17.95 | 174.50 ± 18.66 | 177.25 ± 19.29 | 186.25 ± 15.33 | 188.50 ± 7.33 | ↑10.23 ± 0.70 |
The weight measurement results showed that the normal control had only a slight change in body weight. Meanwhile, the percentage of weight loss from negative control, positive control, and dose of 200 mg kg−1 were 19.05, 7.67, and 23.79%, respectively. The percentage of weight loss from negative control and a 200 mg kg−1 dose was relatively high. The negative control was only given NaCMC, which did not affect on reducing blood glucose levels and it affected weight loss. Increased blood glucose levels in people with diabetes are generally accompanied by weight loss, polyuria, polydipsia, and polyphagia. Weight loss may be due to impaired fat and protein catabolism.28 Meanwhile, the percentage of weight loss from the positive control was smaller than the negative control and the 200 mg kg−1 dose treatment. This shows that the positive control has a better effect on lowering blood glucose than the two doses. In addition, the treatment using 400 and 600 mg kg−1 doses increased body weight. This indicates that the two doses have a protecting impact on protein structure degradation.28 The body weight of diabetic rats changed significantly (p <0.05) on the administration of R. tomentosa leaves methanol extract. These results were significantly different from the normal group based on the results of ANOVA and LSD analysis.
| Treatment groups | Serum blood glucose (mg dL−1) on day | |
|---|---|---|
| 0 | 15 | |
| a Values are expressed by means ± SD (n = 4), * significantly different from normal control, (p <0.05). | ||
| Normal control | 1.39 ± 0.19 | 1.40 ± 0.19 |
| Negative control* | 3.14 ± 0.60 | 4.76 ± 1.02 |
| Positive control* | 5.34 ± 1.33 | 4.43 ± 0.41 |
| Dose I (200 mg kg−1)* | 2.90 ± 0.20 | 3.70 ± 0.13 |
| Dose II (400 mg kg−1)* | 4.23 ± 0.19 | 3.48 ± 0.13 |
| Dose III (600 mg kg−1)* | 4.10 ± 0.29 | 4.68 ± 0.32 |
The normal control did not experience changes in serum glucose levels. Meanwhile, negative control, 200 and 600 mg kg−1 doses experienced an increased serum blood glucose level. It indicates that these treatments did not have the effect of reducing serum glucose levels in the rats. However, a dose of 400 mg kg−1 could reduce serum glucose levels in rats which is in line with decreased blood glucose rates in plasma and serum.
The above analysis revealed that the blood glucose in serum when given R. tomentosa extract at a 400 mg kg−1 dose was tended to decrease glucose rates better than other doses. The serum blood glucose of diabetic rats also decreased significantly (p <0.05) on the administration of R. tomentosa leaves methanol extract with the same dose. These results were significantly different from the normal group based on the results of ANOVA and LSD analysis.
In vitro cytotoxic activity assay
The methanol extract was evaluated for its in vitro cytotoxicity against MCF-7, HeLa, A549, and B16 cancer cell lines using PrestoBlue method. Table 8 shows that the methanol extract has cytotoxicity on four human cancer cells with IC50 values ranging from 28.28 to 168.88 μg mL−1. Notably, the IC50 values of the extract against A549 and B16 cells were only 1-3-fold weaker compared to cisplatin as the positive control, indicating its promising activity on the two types of cancer cells.| Samples | IC50 (μg mL−1) | |||
|---|---|---|---|---|
| MCF-7 | HeLa | A549 | B16 | |
| a Data are expressed as mean ± SD of twice experiments. | ||||
| MeOH extract | 123.49 ± 0.79 | 28.28 ± 0.17 | 168.88 ± 1.14 | 42.44 ± 0.18 |
| Cisplatin | 15.96 ± 0.13 | 5.72 ± 0.50 | 150.58 ± 0.27 | 12.97 ± 0.11 |
The morphology of MCF-7, HeLa, A549, and B16 cells treated with methanol extract are shown in Fig. 1–4, respectively. The results showed that the toxicity effect of methanol extract against MCF-7, HeLa, A549, and B16 cells increased with increasing extract concentration, which means that the number of living cells was reduced. The morphology of the cells looked like needles with tight spacing at low concentration of extracts. Meanwhile, the morphology of the dead cells can be seen at a high concentration of extracts with round and floating. Currently, research on non-resistant anticancer drugs becomes the main target. Bioactive compounds from plants with their chemically diverse structures have the potential to fight cancer with fewer side effects compared to standard therapies.5 The anticancer effect of R. tomentosa extract obtained in this result may be attributed to the combination of polyphenols such as flavonoids, tannins, and glycosides, as well as terpenoids, and other compounds present in R. tomentosa.31
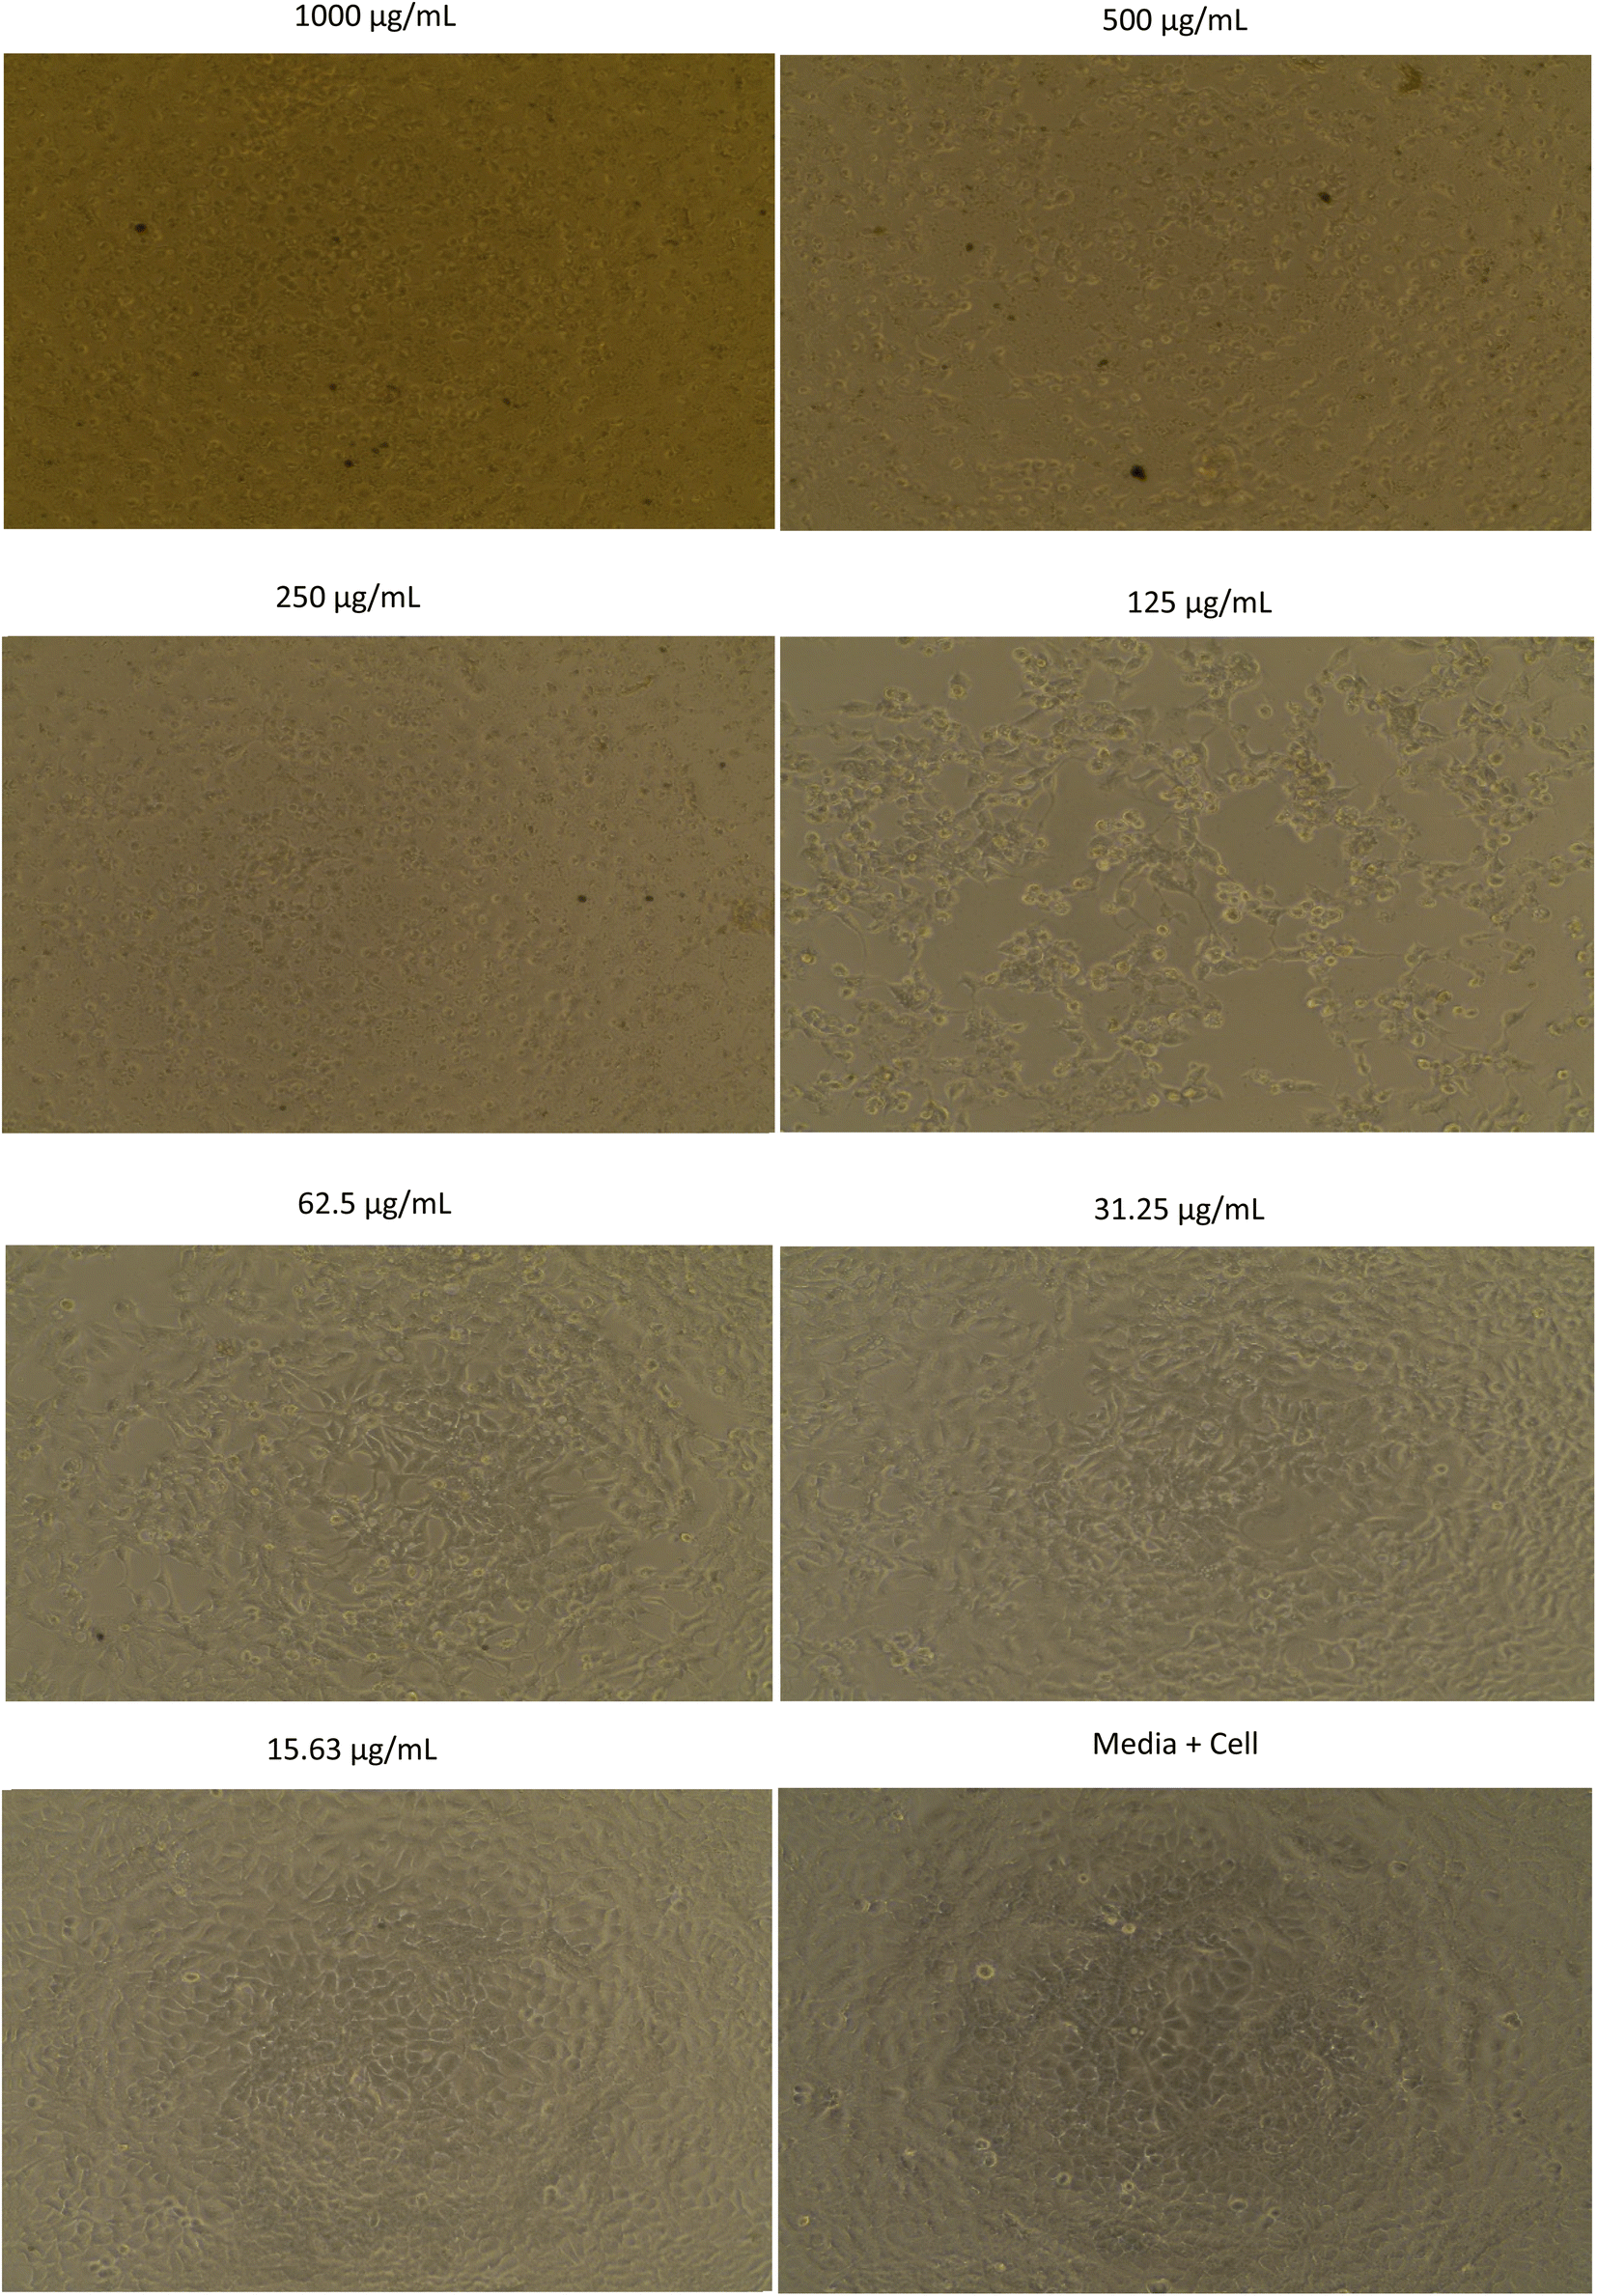 | ||
| Fig. 1 The morphology of MCF-7 cells assayed with methanol extract of R. tomentosa leaves at various concentrations. | ||
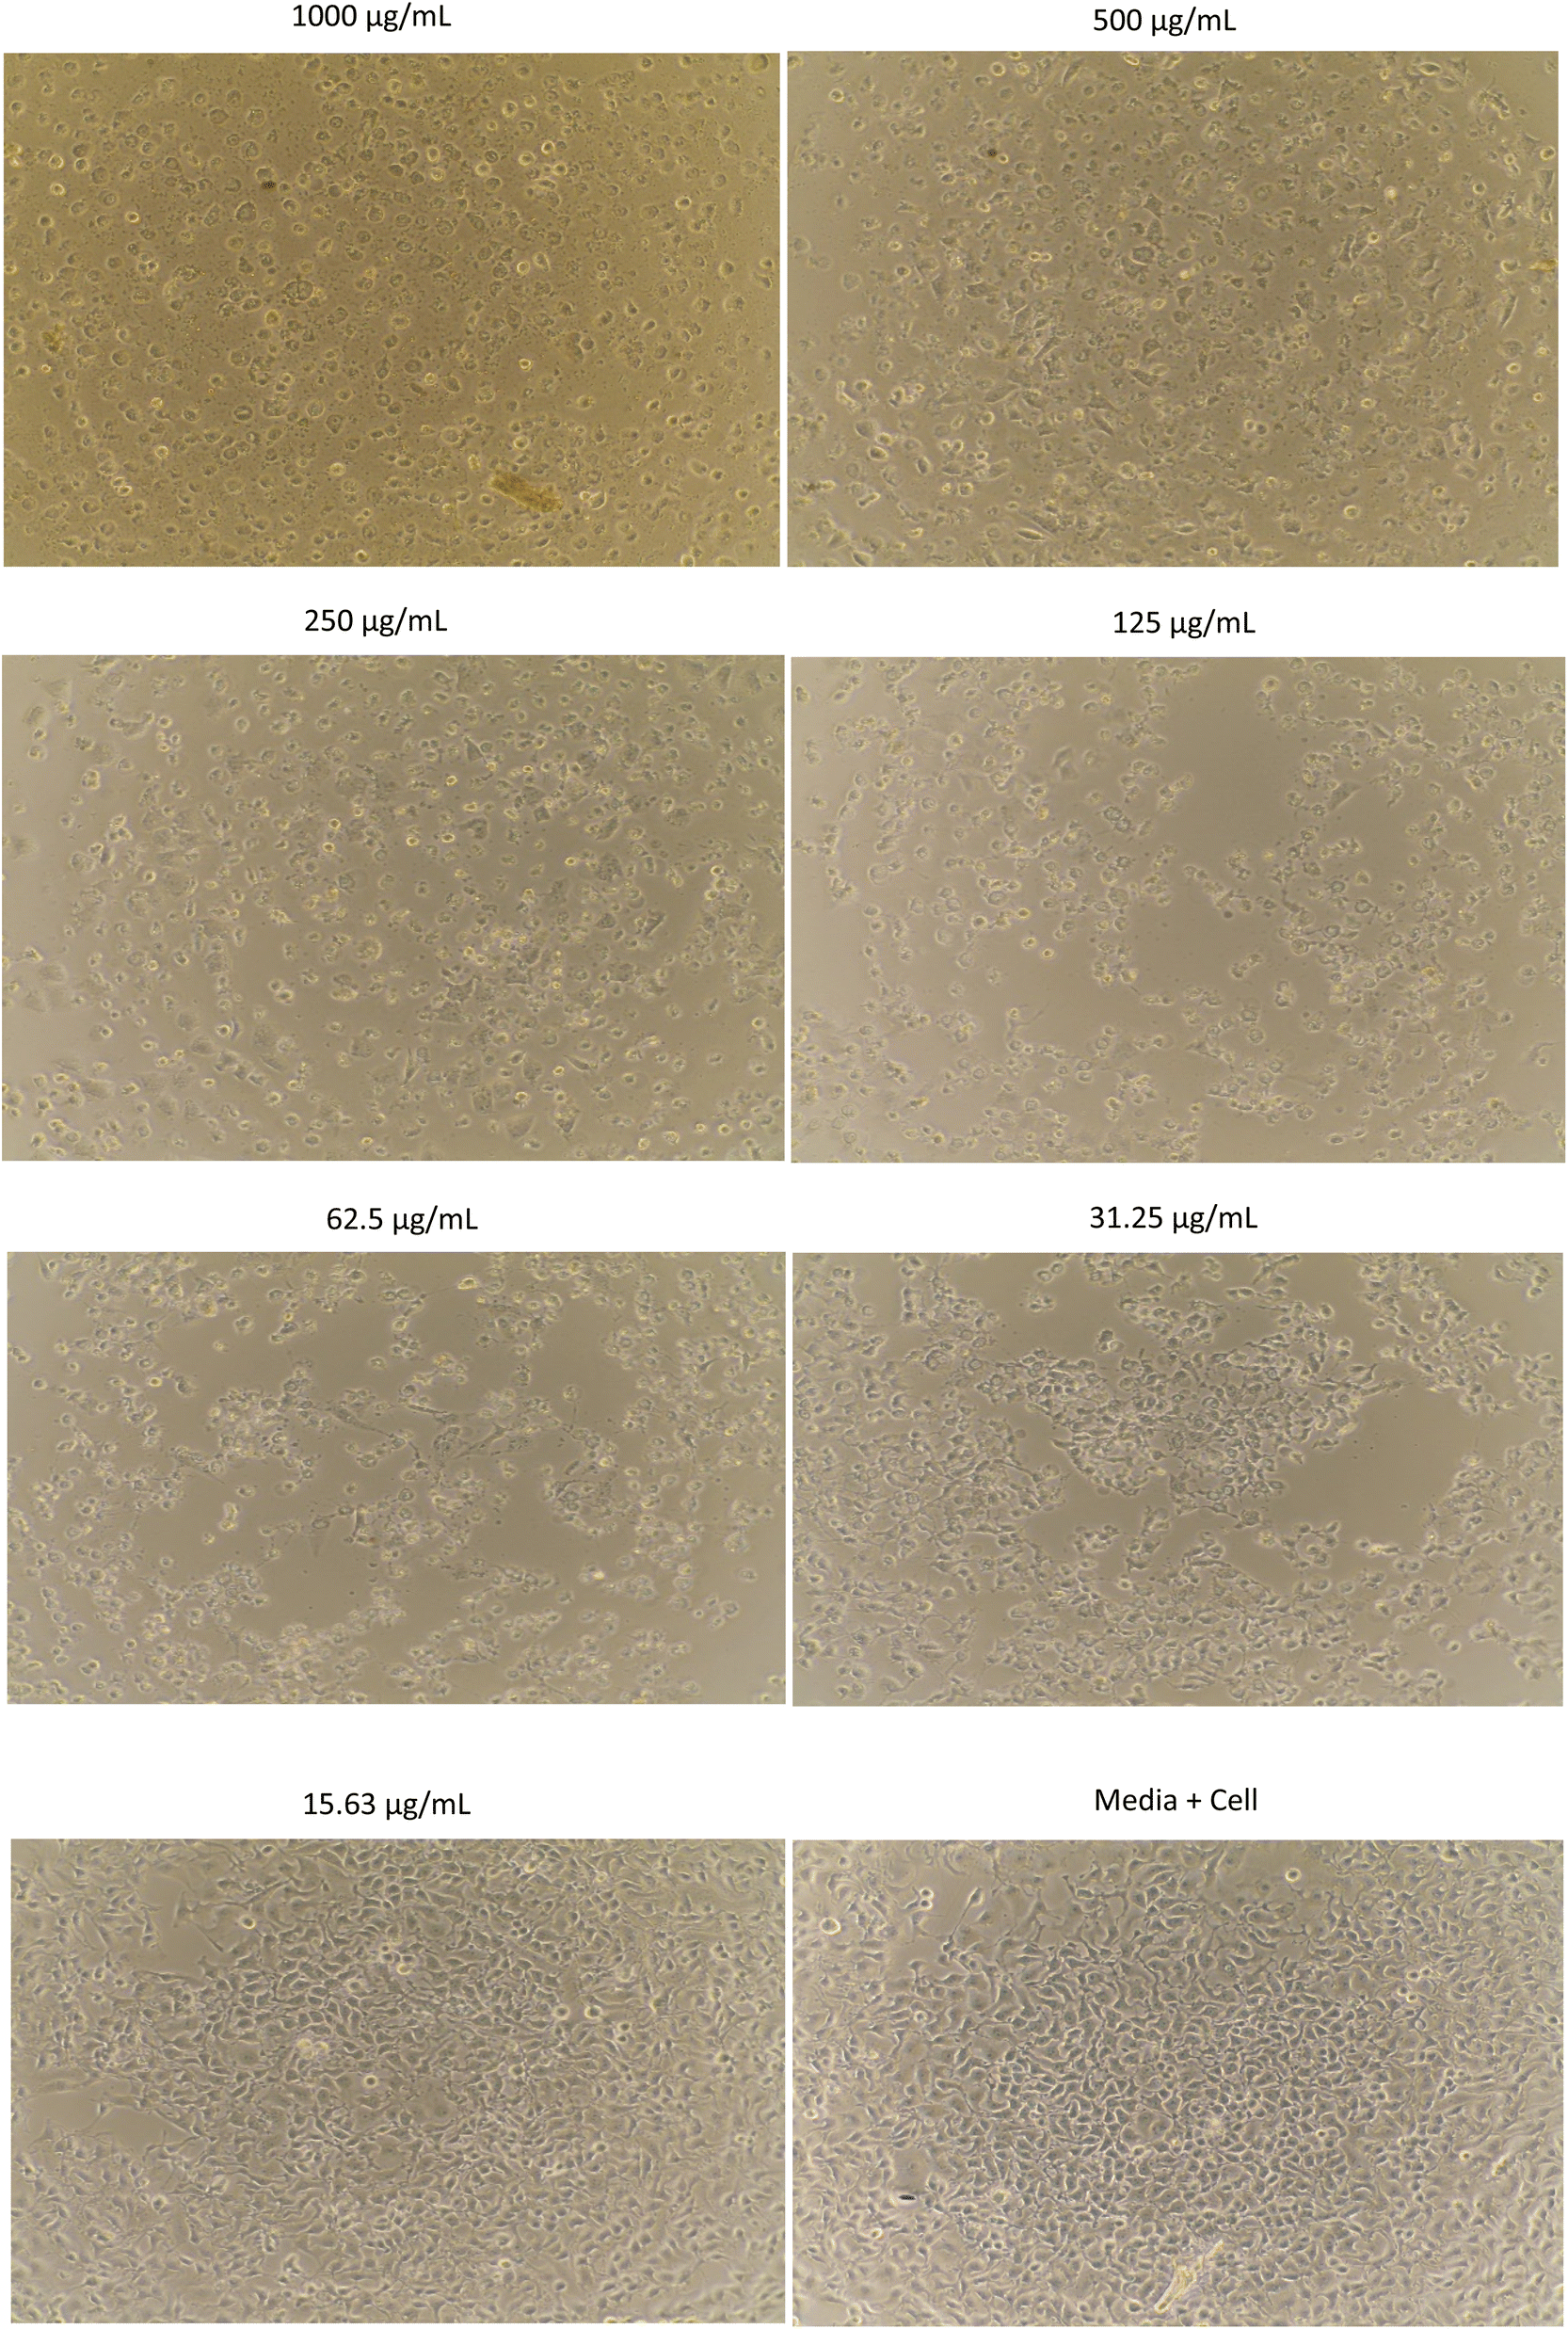 | ||
| Fig. 2 The morphology of HeLa cells assayed with methanol extract of R. tomentosa leaves at various concentrations. | ||
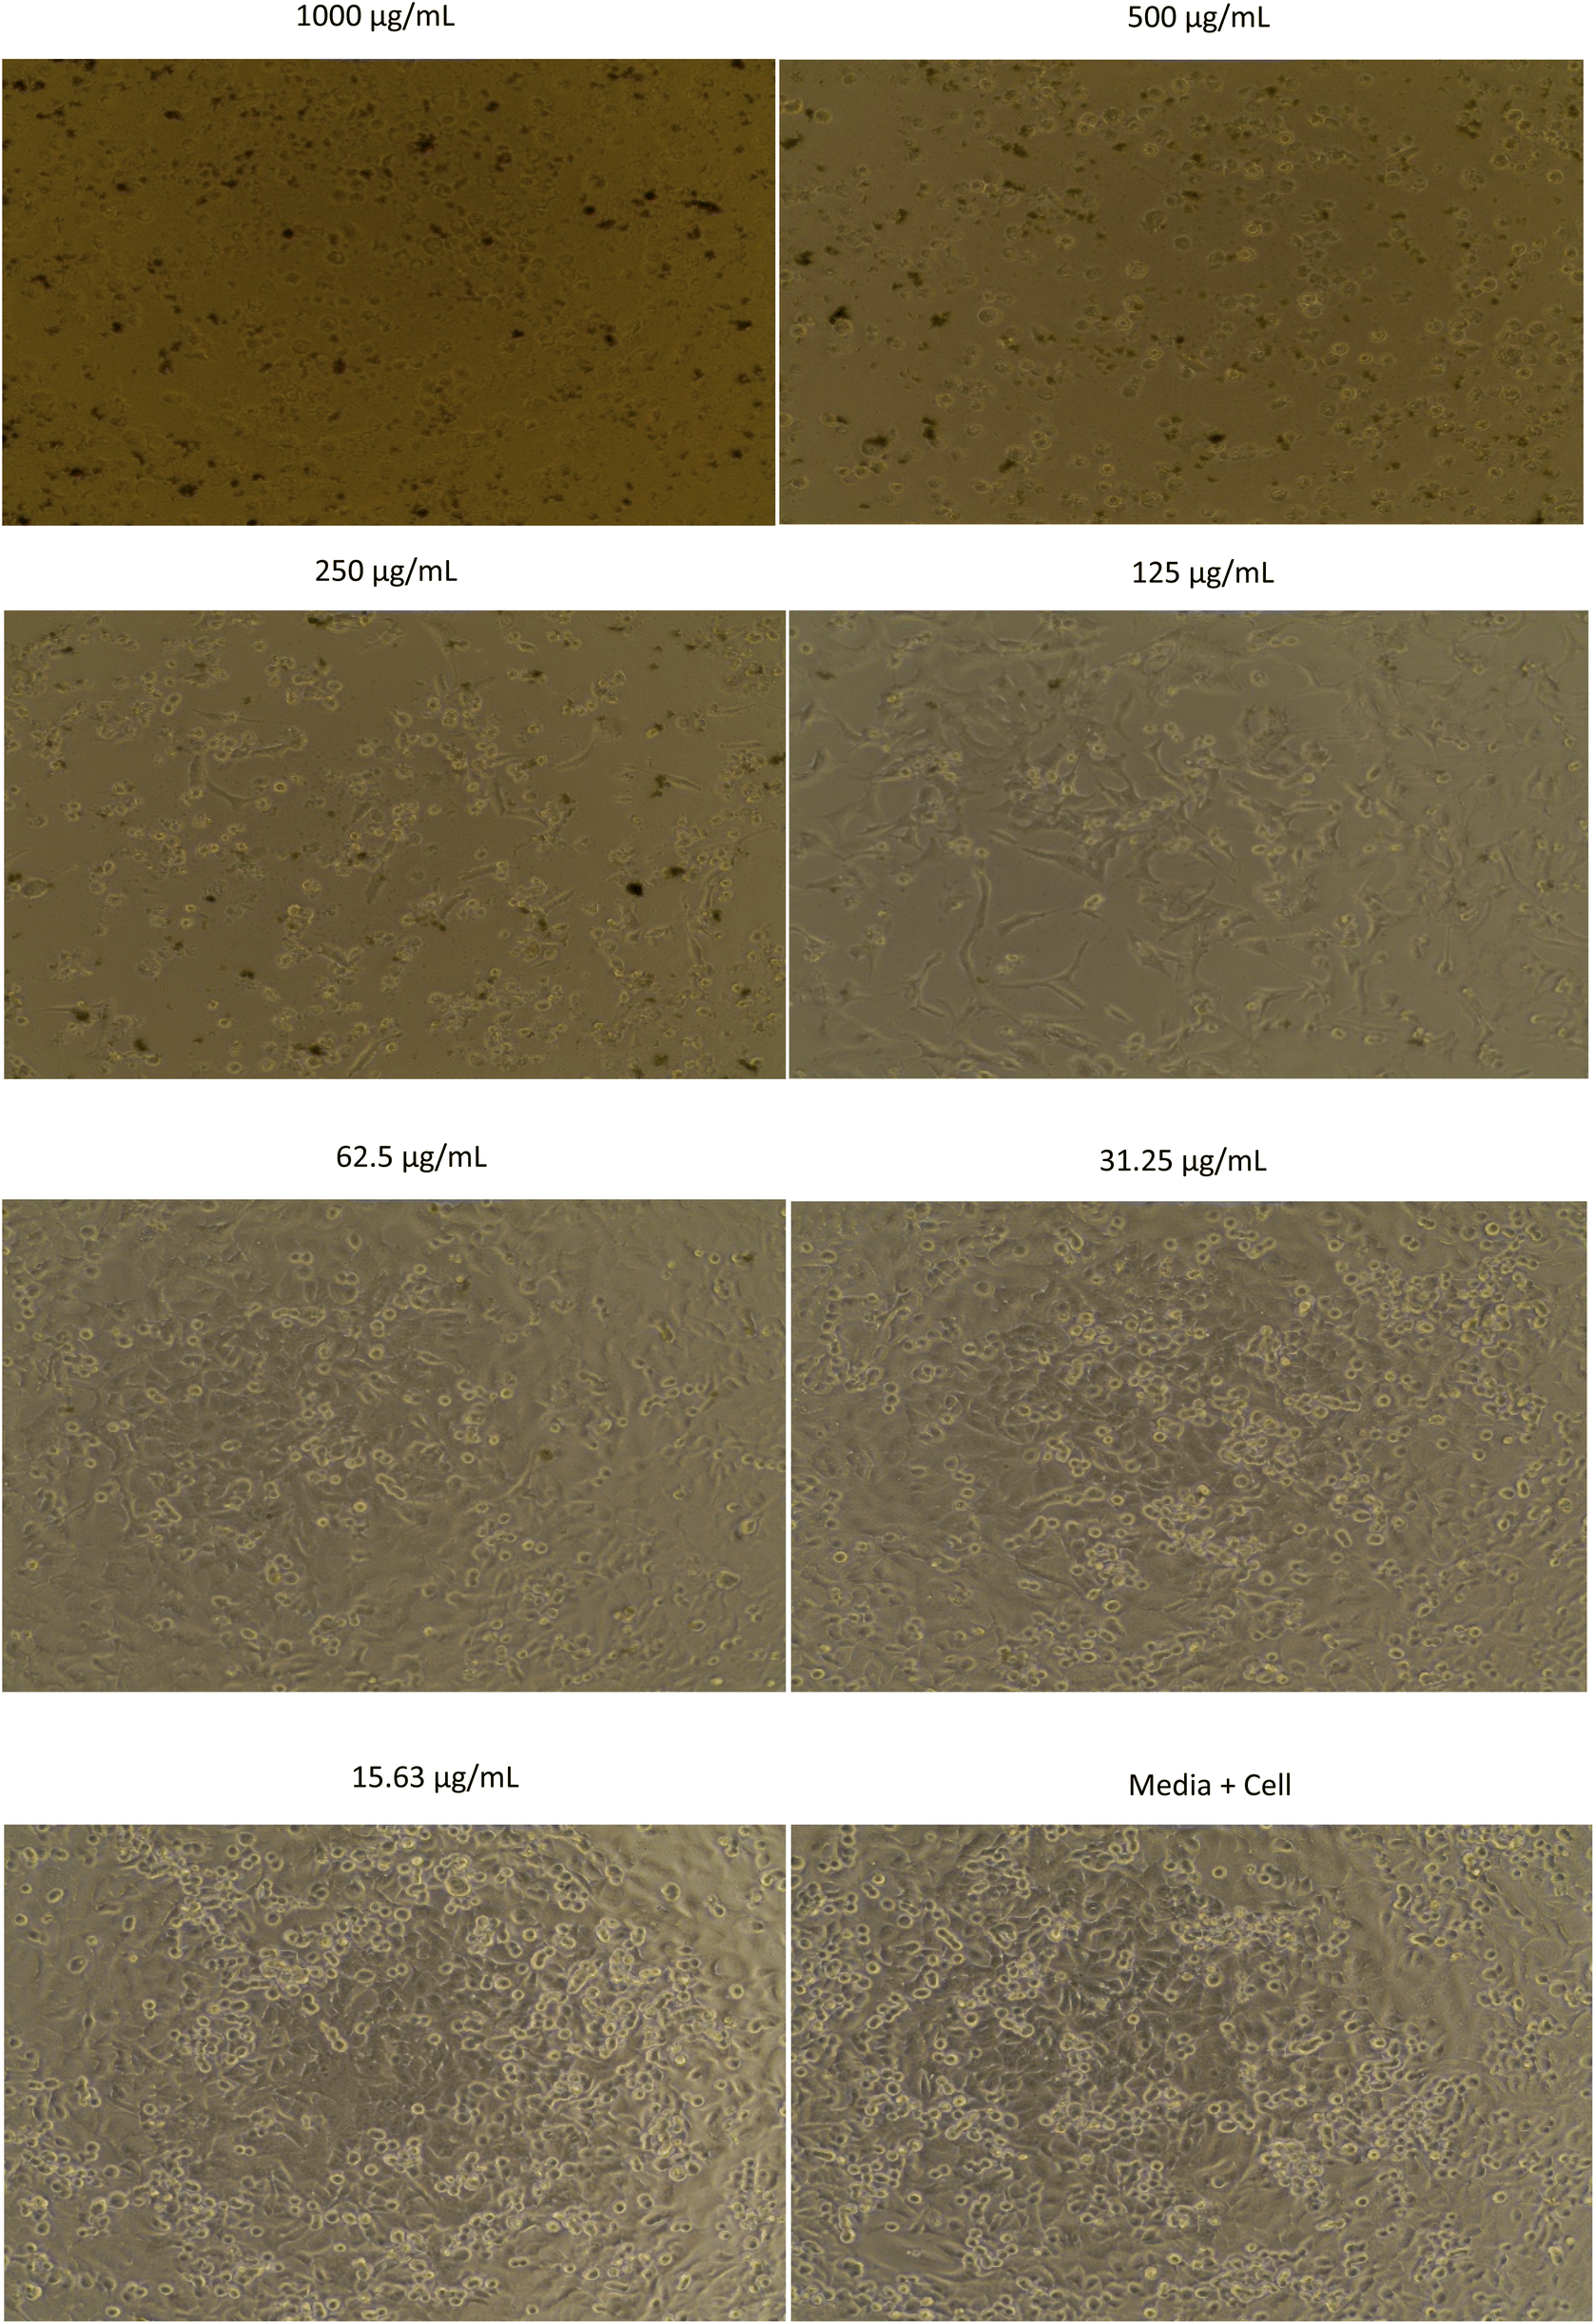 | ||
| Fig. 3 The morphology of A549 cells assayed with methanol extract of R. tomentosa leaves at various concentrations. | ||
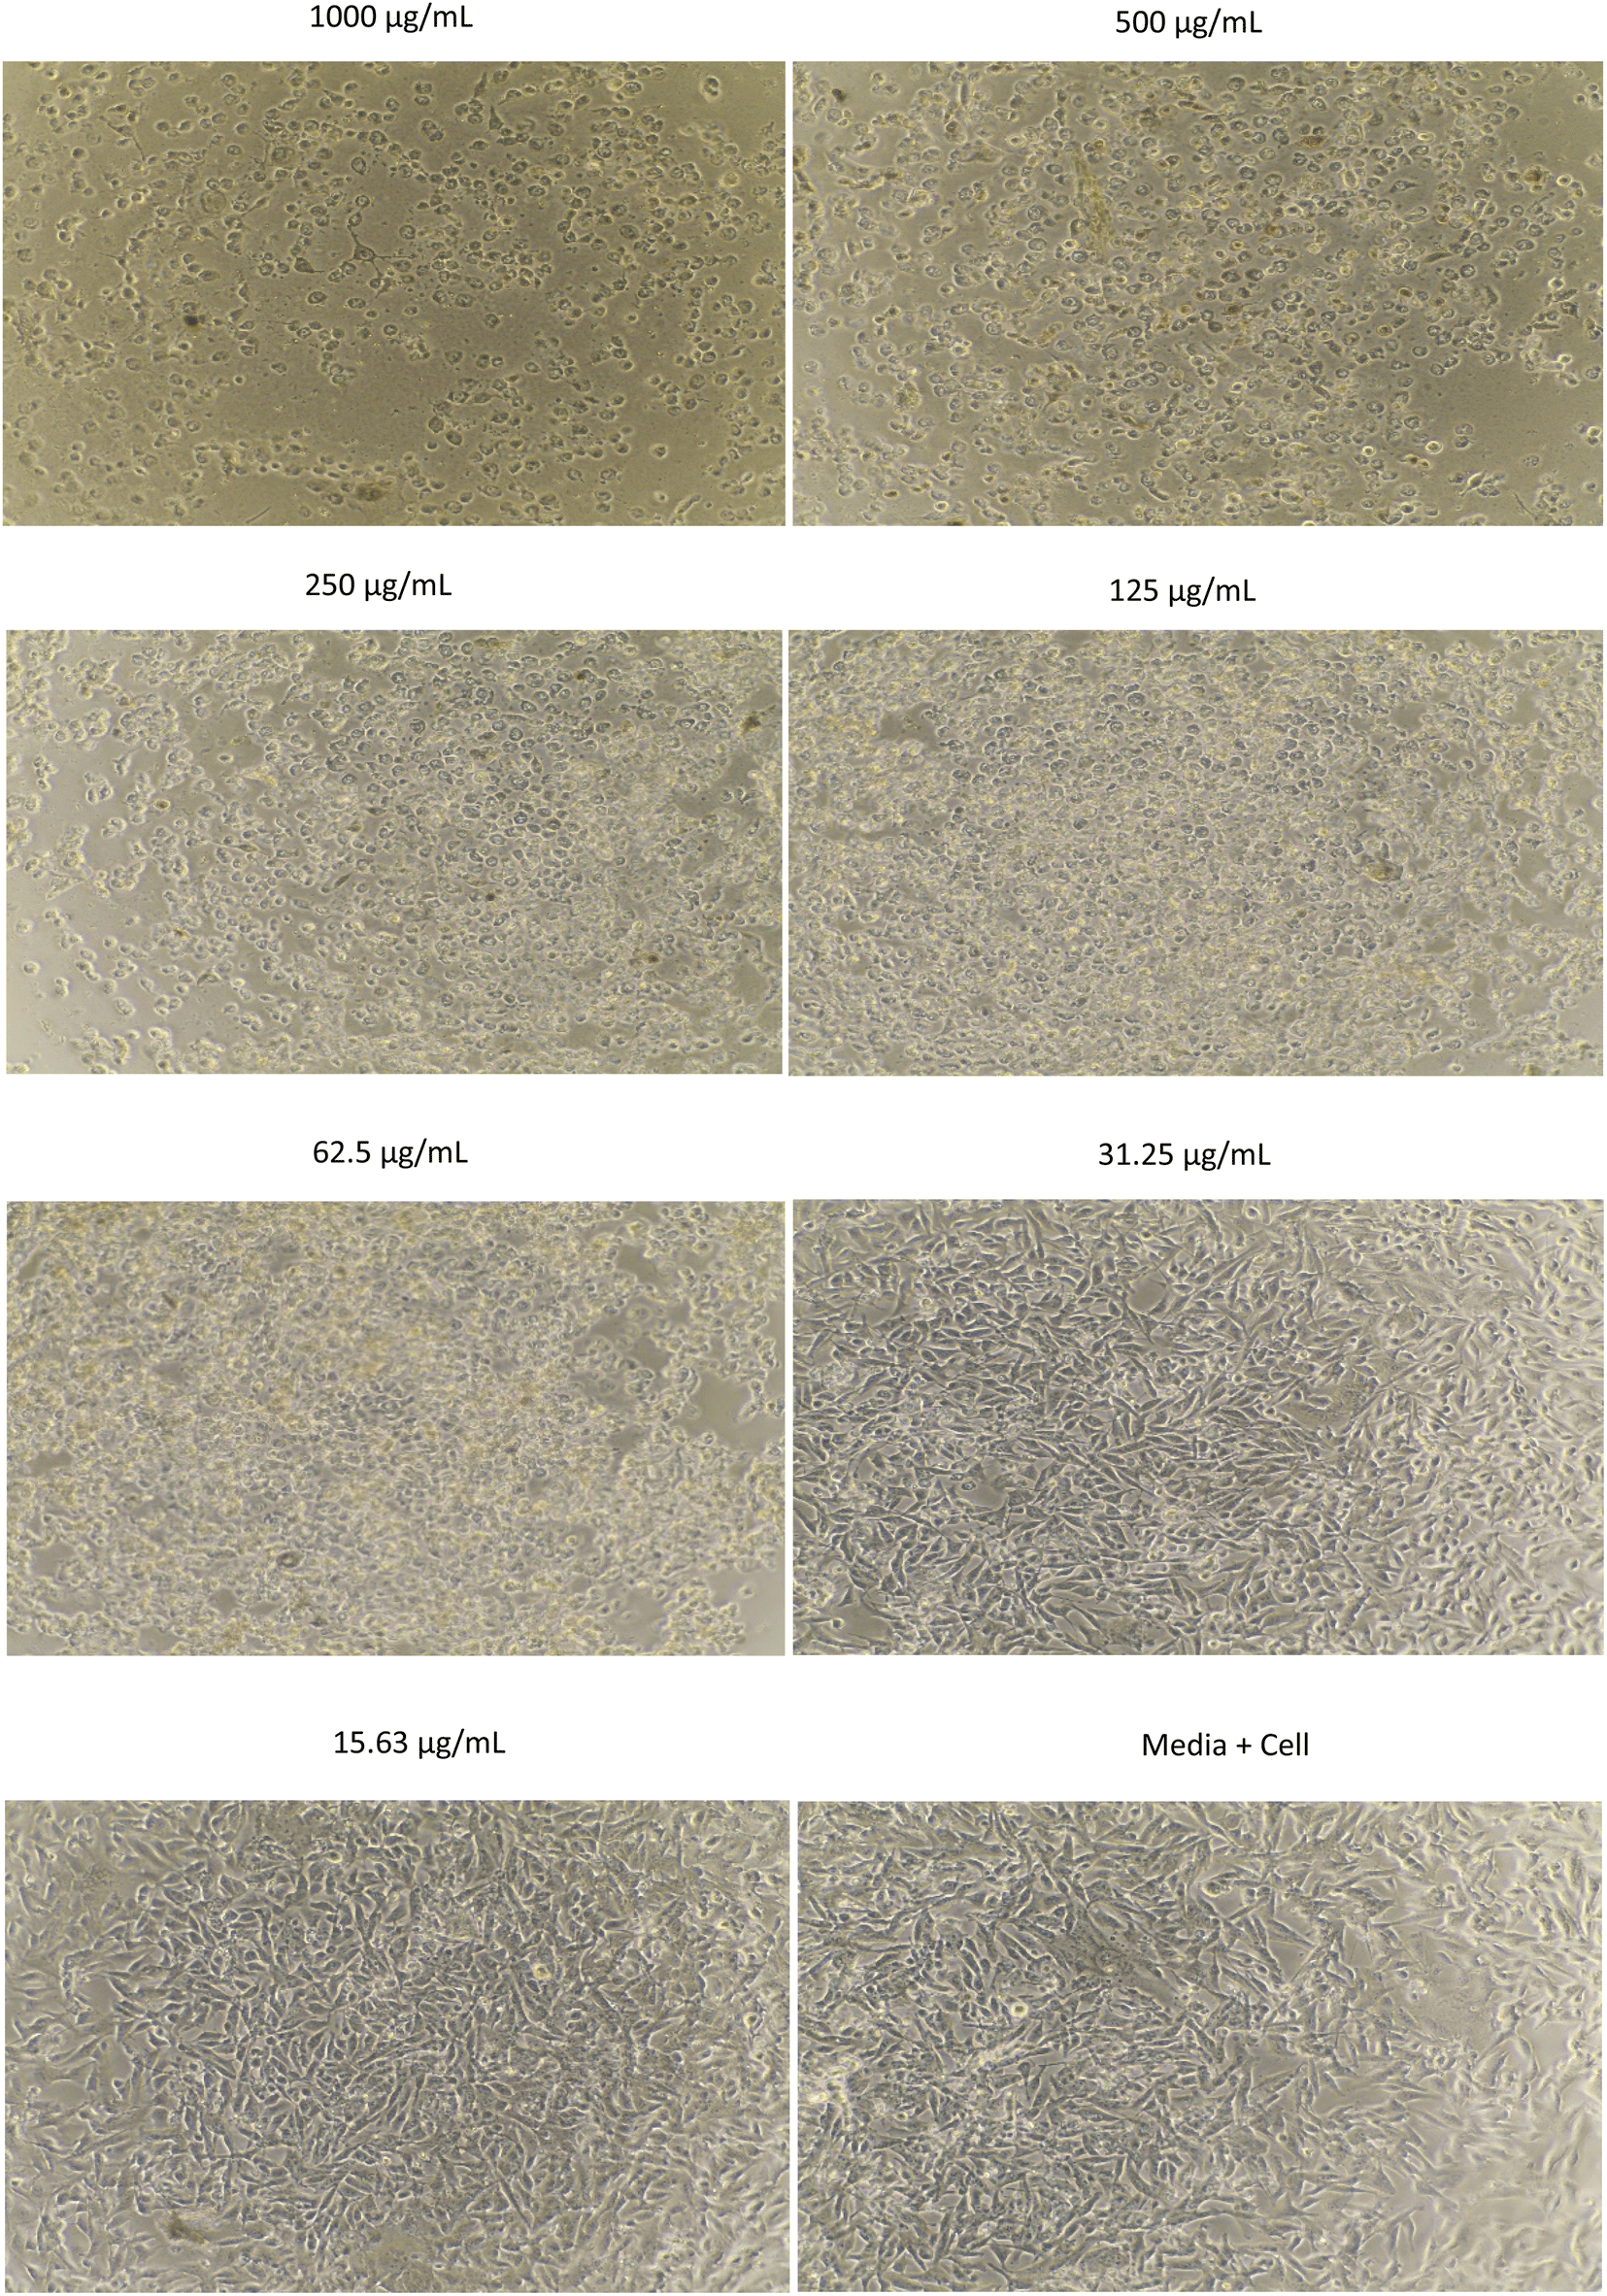 | ||
| Fig. 4 The morphology of B16 cells assayed with methanol extract of R. tomentosa leaves at various concentrations. | ||
Based on the results of the cytotoxicity test, the methanol extract has potential use for the treatment of cancer cells.
HPLC analysis was performed to analyze the presence of phytochemicals in each extract. Fig. 5 showed HPLC chromatogram of n-hexane (a), CH2Cl2 (b), EtOAc (c), and MeOH (d) extracts using methanol:H2O as a mobile phase and with wavelength at 325 nm. The hexane extract was observed to have lack of chemical content with smallest absorbance compared other extracts as in Fig. 5a, whereas several compounds were present with increasing the solvent polarity. Each extract exhibited distinct HPLC peak profiles, indicating the existence of different chemical constituents (Fig. 5a–d). The methanol extract contained two major components with highest absorbance compared other extract which might be phenolic derivatives and responsible to its potent antioxidant and antidiabetic properties. Chromatograms of n-hexane, CH2Cl2, EtOAc, and MeOH extracts looked similar because all extracts were dissolved in methanol, but the abundance of compounds increased according to the polarity of the extracts.
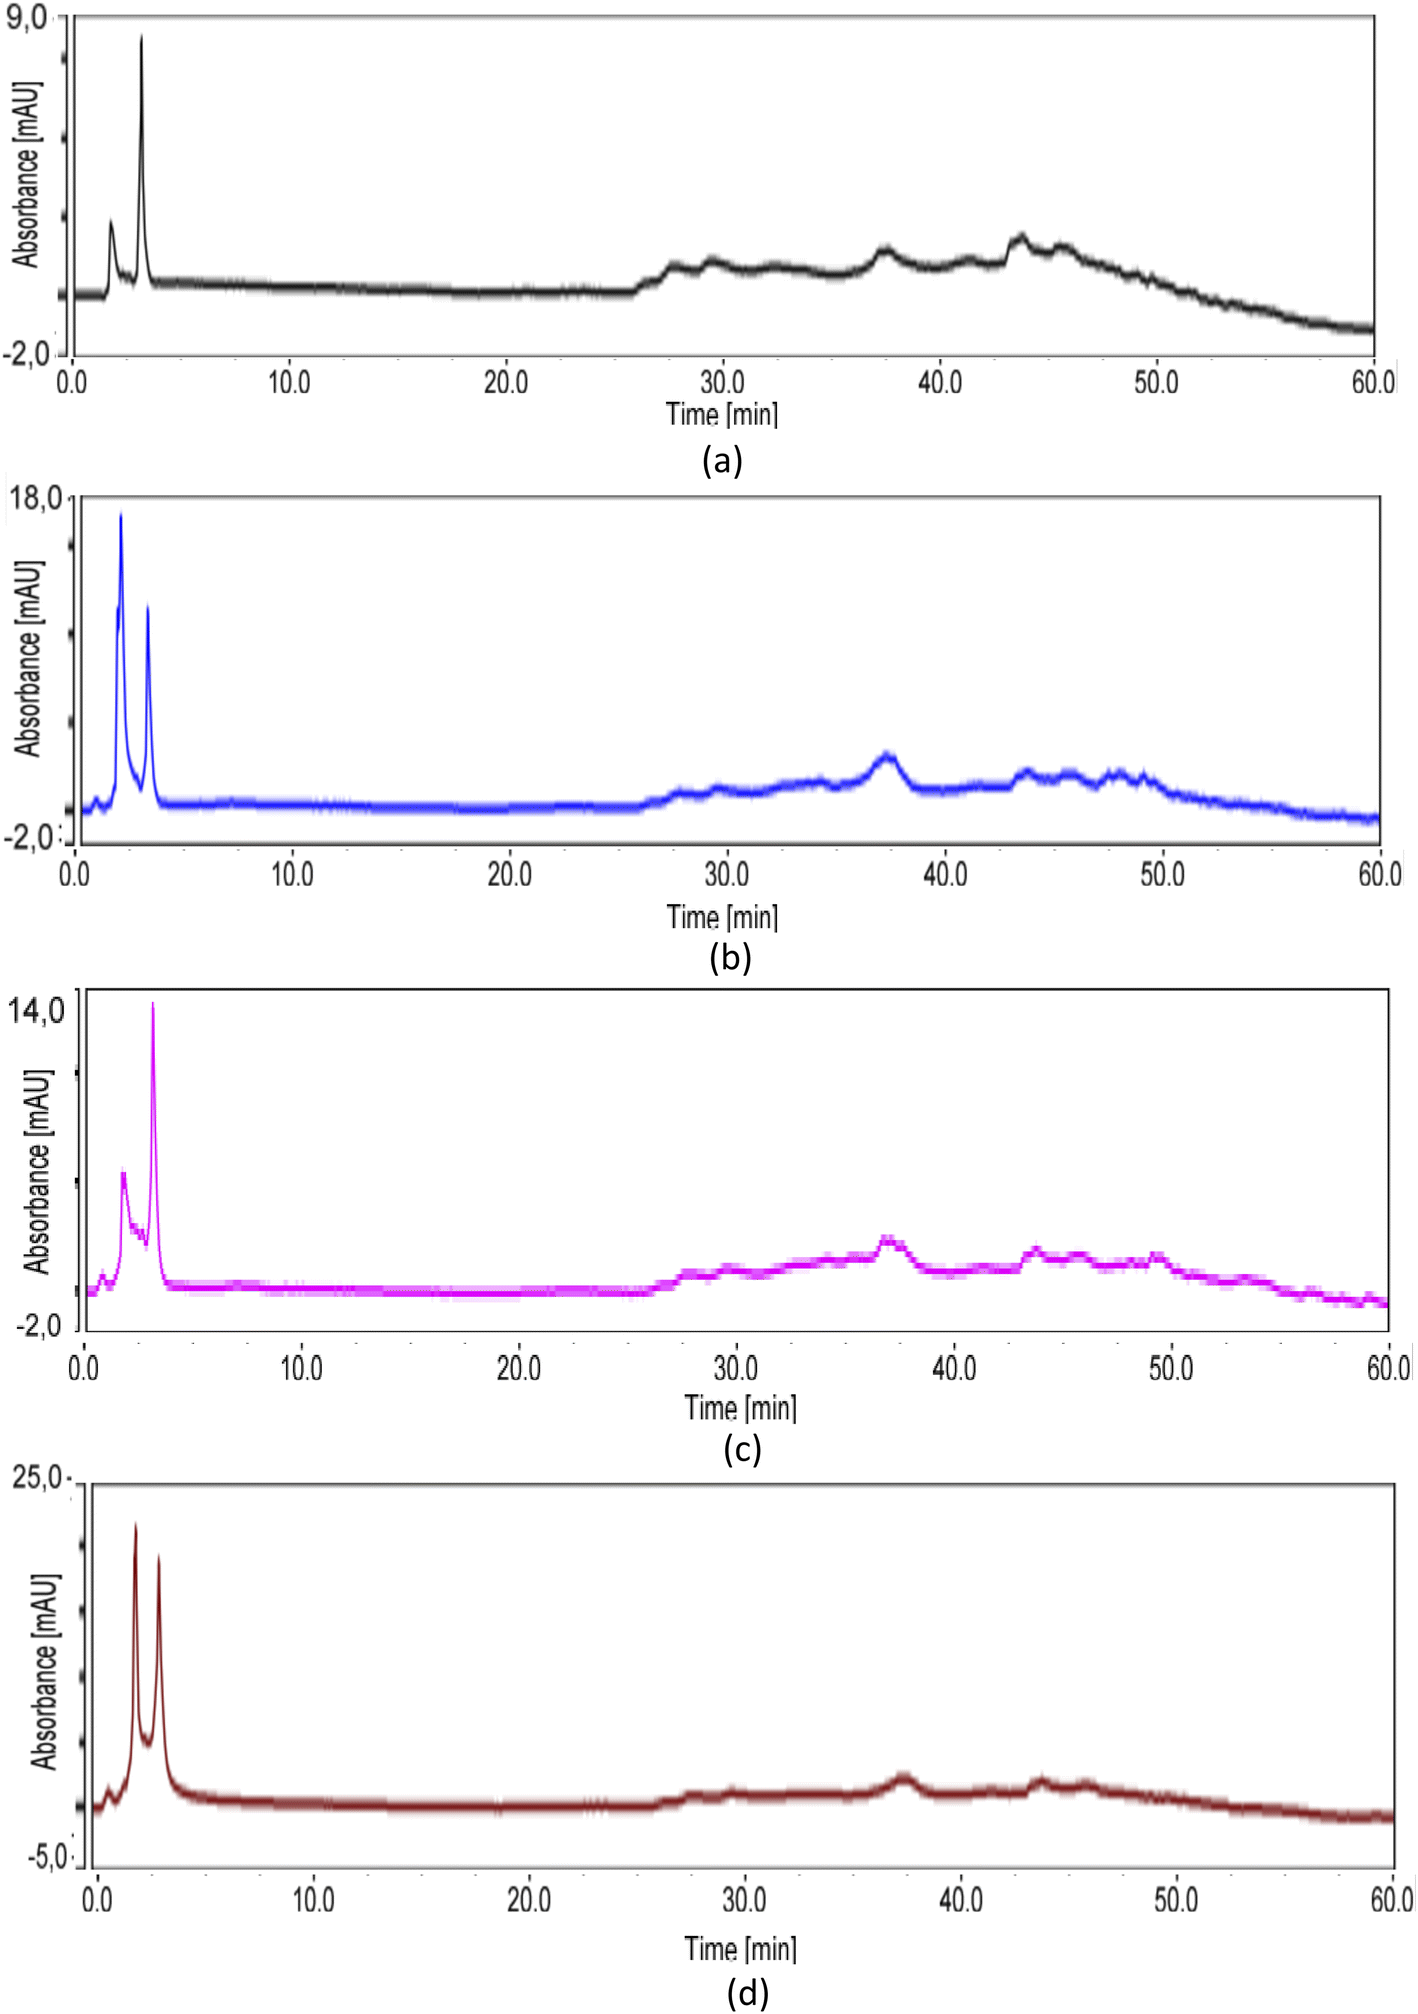 | ||
| Fig. 5 HPLC chromatogram of n-hexane (a), CH2Cl2 (b), EtOAc (c), and MeOH (d) extracts with methanol:H2O as a mobile phase and wavelength at 325 nm. | ||
Flavonoid and phenolic compounds are often associated with several bioactivities such as antioxidant, antidiabetic, and anticancer. In previous report, phenolic compounds such as rhodomyrtosone D,32 rhodomyrtone,32 and kaempferol 3-O-β-sambubioside33 were exist in the methanolic fraction of R. tomentosa. On the other hand, non-phenolic constituents were also observed and some of which showed promising anticancer effect, such as β-amyrin (triterpenoid) isolated from the leaves of R. tomentosa which had anti-inflammatory activity34 and lupeol (triterpenoid) which was also isolated from the leaves of R. tomentosa had anti-inflammatory and anticancer activities.35
This result is a preliminary study which describe the potential of methanolic extract of R. tomentosa leaves as antioxidant, antidiabetic, and anticancer agents. The phenolic compounds are proposed to be the major constituents in the extract based on the HPLC profiling. Further study on bioassay-guided fractionation will be conducted to isolate the bioactive components contained in the extract, which might be responsible to those bioactivities.
Conclusion
This study revealed that the MeOH extract of R. tomentosa has the highest TPC and TFC values which were in agreement with its significant antioxidant capacity, including DPPH (IC50 = 7.79 ± 0.03 μg mL−1), ABTS (IC50 = 4.03 ± 0.02 μg mL−1), and FRAP (64.05 ± 0.54 μM Fe2+ g−1). The methanol extract was cytotoxic against human MCF-7, HeLa, A549, and B16 cancer cell lines with IC50 values of in the range of 28.28–168.88 μg mL−1. The in vitro α-glucosidase and α-amylase inhibitory activities of the methanolic extract were reported for the first time with IC50 values 5–6 fold higher than positive control (acarbose). A dose of 400 mg kg−1 body weight of the extract was able to reduce rats blood glucose rate and serum blood glucose by 48.51% and 17.73%, respectively after 15 days treatments. These findings suggested that methanolic extract of R. tomentosa leaves can be used as a potential source of antioxidant, anticancer, and antidiabetic agents.Author contributions
Muddatstsir Idris: Methodology, investigation, validation, writing – original draft. Sri Fatmawati: Conceptualization, methodology, validation, supervision, writing – review & editing, resources. Adi Setyo Purnomo: Validation, supervision, writing – review & editing. Edwin Risky Sukandar: Methodology, writing – review & editing. Fahimah Martak: Validation, supervision, writing – review & editing.Conflicts of interest
There are no conflicts to declare.Acknowledgements
The authors would like to acknowledge the Directorate of Research and Community Service and Directorate General of Strengthening Research and Development, Ministry of Research, Technology and Higher Education of Republic Indonesia for the financial support for Doctoral Dissertation Research with contract number 828/PKS/ITS/2021. The authors would like to thank drh. Igo Syaiful Ihsan and other staff for helping the in vivo antidiabetic assay in Stem Cell Laboratory, Airlangga University, Surabaya, Indonesia.Notes and references
- K. Khadayat, B. P. Marasini, H. Gautam, S. Ghaju and N. Parajuli, Clin. Phytosci., 2020, 6, 34, DOI:10.1186/s40816-020-00179-8.
- S. Kumar, S. Narwal, V. Kumar and O. Prakash, Pharmacogn. Rev., 2011, 5, 19–29, DOI:10.4103/0973-7847.79096.
- H. Ali, P. J. Houghton and A. Soumyanath, J. Ethnopharmacol., 2006, 107, 449–455, DOI:10.1016/j.jep.2006.04.004.
- Y. P Pasaribu, A. Fadlan, S. Fatmawati and T. Ersam, Biomedicines, 2021, 9, 1654, DOI:10.3390/biomedicines9111654.
- K. C. Tay, L. T. H. Tan, C. K Chan, S. L Hong, K. G. Chan, W. H Yap, P. Pusparajah, L. H. Lee and B. H. Goh, Front. Pharmacol., 2019, 10, 820, DOI:10.3389/fphar.2019.00820.
- H. A. Hamid, S. S. Z. R. Mutazah and M. M. Yusoff, Asian J. Pharm. Clin. Res., 2017, 10, 10–16, DOI:10.22159/ajpcr.2017.v10i1.12773.
- T. S. Vo and D. H. Ngo, Biomolecules, 2019, 9, 76, DOI:10.3390/biom9020076.
- C. Cui, S. Zhang, L. You, J. Ren, W. Luo, W. Chen and M. Zhao, Food Chem., 2013, 139, 1–8, DOI:10.1016/j.foodchem.2013.01.107.
- N. Armania, L. S. Yazan, S. N. Musa, I. S. Ismail, J. B. Foo, K. W. Chan, H. Noreen, A. H. Hisyam, S. Zulfahmi and M. Ismail, J. Ethnopharmacol., 2013, 146, 525–535, DOI:10.1016/j.jep.2013.01.017.
- I. M. C. Brighente, M. Dias, L. G. Verdi and M. G. Pizzolatti, Pharm. Biol., 2007, 45, 156–161, DOI:10.1080/13880200601113131.
- S. Dudonné, X. Vitrac, P. Coutière, M. Woillez and J. M. Mérillon, J. Agric. Food Chem., 2009, 57, 1768–1774, DOI:10.1021/jf803011r.
- I. F. F. Benzie and M. Devaki, The ferric reducing/antioxidant power (FRAP) assay for non-enzymatic antioxidant capacity: Concepts, procedures, limitations and applications, in Measurement of Antioxidant Activity & Capacity, ed. R. Apak, E. Capanoglu, F. Shahidi, 1st edn, 2017, John Wiley & Sons, Ltd., Chichester, UK, pp. 77–106 Search PubMed.
- W. Worawalai, T. Doungwichitrkul, W. Rangubpit, P. Taweechat, P. Sompornpisut and P. Phuwapraisirisan, Bioorg. Chem., 2019, 87, 783–793, DOI:10.1016/j.bioorg.2019.03.077.
- T. Y. K. Lulan, S. Fatmawati, M. Santoso and T. Ersam, Heliyon, 2020, 6, e04102, DOI:10.1016/j.heliyon.2020.e04102.
- V. Kumar, D. Ahmed, A. Verma, F. Anwar, M. Ali and M. Mujeeb, BMC Complementary Altern. Med., 2013, 13, 273, DOI:10.1186/1472-6882-13-273.
- Nurlelasari, I. Rahmayanti, S. Salam, A. Safari, D. Harneti, R. Maharani, A. T. Hidayat, M. Tanjung, R. Retnowati, Y. Shiono and U. Supratman, Appl. Biol. Chem., 2021, 64, 35, DOI:10.1186/s13765-021-00606-5.
- V. Yermilov, J. Rubio, M. Becchi, M. D. Friesen, B. Pignatelli and H. Ohshima, Carcinogenesis, 1995, 16, 2045–2050 CrossRef CAS PubMed.
- A. A. Dehpour, M. A. Ebrahimzadeh, N. S. Fazel, N. S. Mohammad and Y. Grasas, Aceites, 2009, 60, 405–412, DOI:10.3989/gya.010109.
- A. Floegel, D. O. Kim, S. J. Chung, S. I. Koo and O. K. Chun, J. Food Compos. Anal., 2011, 24, 1043–1048, DOI:10.1016/j.jfca.2011.01.008.
- N. Liang and D. Kitts, Molecules, 2014, 19, 19180–19208, DOI:10.3390/molecules191119180.
- H. Kainama, S. Fatmawati, M. Santoso, P. M. Papilaya and T. Ersam, Pharm. Chem. J., 2020, 53, 1151–1157, DOI:10.1007/s11094-020-02139-5.
- S. Fatmawati, K. Shimizu and R. Kondo, Phytomedicine, 2011, 18, 1053–1055, DOI:10.1016/j.phymed.2011.03.011.
- F. A. Laar, Vasc. Health Risk Manage., 2008, 4, 1189–1195, DOI:10.2147/vhrm.s3119.
- E. Standl and O. Schnell, Diabetes Vasc. Dis. Res., 2014, 9, 163–169, DOI:10.1177/1479164112441524.
- M. I. Kazeem, J. O. Adamson and I. A. Ogunwande, BioMed Res. Int., 2013, 527570, DOI:10.1155/2013/527570.
- T. Wresdiyati, S. Sa’diah, A. Winarto and V. Febriyani, Hayati Journal of Biosciences, 2015, 22, 73–78, DOI:10.4308/hjb.22.2.73.
- S. Lenzen, Diabetologia, 2008, 51, 216–226, DOI:10.1007/s00125-007-0886-7.
- K. Balamurugan, A. Nishanthini and V. R. Mohan, Asian Pac. J. Trop. Biomed., 2014, 4(Suppl 1), S442–S448, DOI:10.12980/APJTB.4.2014C122.
- G. Brosky and J. Logothetopoulos, Diabetes, 1969, 18, 606–611 CrossRef CAS PubMed.
- N. Malviya, S. Jain and S. Malviya, Acta Pol. Pharm., 2010, 67, 113–118 Search PubMed.
- N. Elumalai, P. Ayyakkannu, S. Palanivelu and S. Panchanadham, RSC Adv., 2015, 5, 23125–23133, 10.1039/c4ra12346h.
- A. Hiranrat, W. Chitbankluoi, W. Mahabusarakam, S. Limsuwan and S. P. Voravuthikunchai, Nat. Prod. Res., 2012, 26, 1904–1909, DOI:10.1080/14786419.2011.628666.
- P. M. Giang, T. T. Ha, N. T. H. Anh and P. T. Son, J. Chem., 2007, 45, 749–750 Search PubMed.
- S. A. H. Pinto, L. M. S. Pinto, G. M. A. Cunha, M. H. Chaves, F. A. Santos and V. S. Rao, Inflammopharmacology, 2008, 16, 48–52, DOI:10.1007/s10787-007-1609-x.
- M. Saleem, Cancer Lett., 2009, 285, 109–115, DOI:10.1016/j.canlet.2009.04.033.
| This journal is © The Royal Society of Chemistry 2022 |