 Open Access Article
Creative Commons Attribution 3.0 Unported Licence
From 0D to 2D: N-doped carbon nanosheets for detection of alcohol-based chemical vapours†
Lerato L. Mokoloko ab,
Joyce B. Matsoso
 c,
Nikolas Antonatos
 c,
Vlastimil Mazánek
 c,
Beatriz D. Moreno
 d,
Roy P. Forbes
 ab,
Dean H. Barrett
 a,
Zdeněk Sofer
 *c and
Neil J. Coville
 *ab
*ab
aThe Molecular Sciences Institute, School of Chemistry. University of the Witwatersrand, Johannesburg 2050, South Africa. E-mail: neil.coville@wits.ac.za
bDSI-NRF Centre of Excellence in Catalysis (c*change), University of the Witwatersrand, Johannesburg 2050, South Africa
cDepartment of Inorganic Chemistry, University of Chemistry and Technology – Prague, Technická 5, Dejvice, 166 28, Praha 6, Czech Republic. E-mail: zdenek.sofer@vscht.cz
dCanadian Light Source Inc., 44 Innovation Boulevard, Saskatoon, SK S7N 2V3, Canada
First published on 3rd August 2022
Abstract
The application of N-doped carbon nanosheets, with and without embedded carbon dots, as active materials for the room temperature chemoresistive detection of methanol and/or ethanol is presented. The new carbons were made by converting 0D N-doped carbon dots (NCDs) to 2D nitrogen-doped carbon nanosheets by heat treatment (200–700 °C). The nanosheets exhibited a lateral size of ∼3 μm and a thickness of ∼12 nm at the highest annealing temperature. Both Raman and TEM analyses showed morphological transitions of the dots to the sheets, whilst XPS analysis revealed transformation of the N-bonding states with increasing temperature. PDF analysis confirmed the presence of defective carbon sheets. Room temperature screening of the chemical vapours of two alcohols (methanol and ethanol), revealed that the structure and the type of N-configuration influenced the detection of the chemical vapours. For instance, the lateral size of the nanosheets and the high charge density N-configurations promoted detection of both methanol and ethanol vapours at good sensitivity (−16.8 × 10⁻⁵ ppm−1EtOH and 1.2 × 10⁻⁵ ppm−1MeOH) and low LoD (∼44 ppmEtOH and ∼30.3 ppmMeOH) values. The study showed that the composite nature as well as the large basal area of the carbon nanosheets enabled generation of adequate defective sites that facilitated easy adsorption of the VOC analyte molecules, thereby eliminating the need to use conducting polymers or the formation of porous molecular frameworks for the alcohol detection.
Introduction
Volatile organic compounds (VOCs) are known to significantly reduce the quality of air and therefore cause harmful effects to humans and the environment.1,2 Unfortunately, a number of simple everyday activities such as painting, application of adhesives, use of cleaning products, production of cosmetics, and cooking, all lead to the emission of many VOCs.3,4 Additionally, alcohol-based VOCs such as methanol and ethanol are mostly found in alcoholic beverages, disinfectants and food products, and because of their volatility, impact our daily living.3 Therefore, the ability to detect and identify alcohol-based VOCs is required for the health and safety of humans, and the environment at large. Additionally, alcohol detection to ensure road safety protocols are obeyed, has also provided a large market for the detection of ethanol vapours.5 As such, the search for portable, low-cost, low power usage, high response and easily operated sensing devices for VOC detection still continues, in particular for those devices that can operate satisfactorily under room temperature conditions.6 Owing to this growing demand, several sensing techniques have been explored for the detection of VOCs. These include gas chromatography, infrared detection and chemoresistive detection.7 Among these various detection methods, chemoresistive devices are particularly useful, especially in terms of low power, easy operation, high selectivity and robust nature.8Usually, the performance of the chemoresistive sensing devices is affected by the type of the active material used. Given this challenge, an arsenal of active materials, such as conducting polymers, semiconductors, metal oxides, chalcogenides and carbon allotropes, have been extensively studied.8 Amongst the various candidates, carbon allotropes, particularly graphene and its derivatives, are known to be promising active materials for the fabrication of room temperature chemoresistive sensing devices.9,10 Apart from using the graphene derivatives individually as active materials, various studies have shown that formation of composites of carbon allotropes with graphene derivatives can also significantly enhance their electrochemical properties.11,12 The synergy between the components of the composites has led to their enhanced sensing properties due to changes in the structural and electronic characteristics of the composites.6,13 For instance, Hu et al. reported that a composite of reduced graphene oxide and carbon dots (rGO–CDs) led to a highly selective and stable gas sensor under room temperature conditions.14 The enhanced sensitivity was attributed to the increased density of electron deficient sites as well as adsorption sites. Similarly, a composite of graphene, conductive polymer and carbon nanotubes on a glassy carbon electrode (GCE) was found to produce a methanol sensing device exhibiting fast response, high sensitivity, long-term stability and low-sample volume.15
Apart from the formation of carbon-based composites, tuning of the electronic properties of graphene derivatives without compromising the structural properties through intentional incorporation or doping with electron-rich nitrogen atoms provides an excellent route for increasing the materials binding sites. This is achieved by the creation of defective sites, while also inducing the formation of n- and/or p-type semiconducting properties, depending on the type of N-bonding configuration formed.16–18 A few reports have shown that these nitrogen-rich nanosheets, with targeted configuration, can be fabricated from facile synthesis procedures such as carbonizing metal–organic frameworks (MOFs) like indium-based coordinated polymers.19 Despite numerous reports on the synthesis of N-doped graphene derivatives, few studies have investigated the impact of the carbon and/or nitrogen-dopant domains on the sensing ability of N-doped carbon-based nanostructures.20 To explore this issue, and the effect of dopants, we have used CDs as carbon sources for the synthesis of large domain pristine or doped graphene derivatives.
The transformation of these 0D CDs to 2D graphene-like sheets occurs during the coalescence of CDs in the presence of a metal catalysts and/or upon exposure to temperature treatment.21–23 The transformation route takes advantage of the highly functionalized surface of CDs which subsequently enables easy incorporation of heteroatoms during the doping process.24,25 However, little is known on how N-doping impacts on this conversion process and the use of these doped materials as chemical vapour sensing materials. Therefore, to increase the scope of the CDs-derived graphene derivatives, the current study aims to explore N-doped graphene-like nanosheets derived from CDs as active materials for the detection of VOCs. The significant role played by the different nitrogen bonding states and the morphological changes associated with heat treatment on the room temperature sensing performance of these CDs-derived N-doped graphene-like nanosheets is thus described.
Experimental
Material synthesis and sensor preparation
The nitrogen doped carbon dots (NCDs) were synthesized using a modified microwave-assisted hydrothermal technique.22,26 Typically, 1.2 g of L-ascorbic acid (95%, Sigma Aldrich) and 1.2 g urea (CO(NH2)2, 99%, Sigma Aldrich) were stirred into 240 mL of deionised water, after which 60 mL of the homogeneous solution was transferred into four Teflon lined 100 mL microwave reaction tubes. The reaction tubes were then placed inside an Anton-Paar Multiwave 3000 SOLV microwave digester, equipped with the maximum power output of 1400 W and a controlled pressure of 60 bar. The reaction chamber was then subjected to microwave irradiation for 6 min at a power of 600 W, resulting in a temperature of 180 °C. After cooling the reaction chamber to room temperature, the product was obtained through centrifugation at 15![[thin space (1/6-em)]](https://www.rsc.org/images/entities/char_2009.gif) 000 rpm for 15 min. The supernatants were filtered through a 0.22 μm poly(vinylidene fluoride) (PVDF) membrane (Membrane Solutions), followed by removal of water using a rotary evaporator, and drying at 60 °C. As previously described for the conversion of the undoped CDs,22 the effect of temperature on the NCDs was achieved by annealing the NCDs (500 mg) in a horizontal chemical vapour deposition (CVD) furnace for 10 min under 100 sccm of nitrogen (>99.999% N2, Afrox SA). After cooling to room temperature under N2 gas, the powdered samples were collected and labelled as NCDs200, NCDs400, and NCDs700 for the samples annealed at 200, 400, 700 °C, respectively.
000 rpm for 15 min. The supernatants were filtered through a 0.22 μm poly(vinylidene fluoride) (PVDF) membrane (Membrane Solutions), followed by removal of water using a rotary evaporator, and drying at 60 °C. As previously described for the conversion of the undoped CDs,22 the effect of temperature on the NCDs was achieved by annealing the NCDs (500 mg) in a horizontal chemical vapour deposition (CVD) furnace for 10 min under 100 sccm of nitrogen (>99.999% N2, Afrox SA). After cooling to room temperature under N2 gas, the powdered samples were collected and labelled as NCDs200, NCDs400, and NCDs700 for the samples annealed at 200, 400, 700 °C, respectively.
Finally, for the electrochemical impedance spectroscopy (EIS) chemical vapour sensing measurements (Scheme S1†), the NCDs active materials were dispersed with sodium dodecyl sulphate (SDS, ≥98.5% Sigma Aldrich), as a surfactant, at a concentration of 0.5 mg mL−1. Thereafter, 10 μL of each solution was drop casted onto the ED-IDE 3-Au integrated electrode (Microflux Fluidic, Spain) and the electrodes were dried at 70 °C for 30 min. Determination of sensitivity to methanol (MeOH, ≥99.9%, Lachner) and ethanol (EtOH, ≥96%, Lachner) was achieved through addition of calculated concentrations (ppm, eqn (1)) of the analyte into the gas chamber:
 | (1) |
 | (2) |
| LoD = Zb + 3db | (3) |
 | (4) |
Characterization
The morphology of the active materials that have been immobilized on Si-O grids was acquired on an EFTEM Jeol 2200 FS microscope (Jeol, Japan), using 200 keV acceleration voltage, and HRTEM images were collected from a JEOL JEM 2100 fitted with a LaB6 gun. Their thicknesses were determined by atomic force microscopy (AFM) through use of a Ntegra Spectra microscope from NT-MDT. AFM measurements were performed in a tapping (semi-contact) mode under ambient condition with a scan rate of 1 Hz and scan line of 512 after drop-casting a sample suspension on a freshly cleaved mica substrate. 13C solid-state nuclear magnetic resonance (NMR) spectra were measured using a Bruker-500 MHz NMR spectrometer at a spinning frequency of 62.5 kHz (4.0 μs, 115 W). Raman spectra and solid-state photoluminescence (PL) spectroscopy data were collected using a Horiba LabRAM HR micro-Raman spectrometer (frequency double Lexel SHG argon ion laser). Raman measurements were done with a 514.5 nm laser and the PL measurements were done using a 244 nm excitation wavelength. Thermal stabilities of the samples were monitored by thermal gravimetric analysis (TGA) conjugated with weight loss derivative outputs (DTG) using a PerkinElmer 6000 thermogravimetric analyzer. Powder X-ray diffraction (PXRD) patterns were recorded on D2 phaser X-ray diffractometer using a Co Kα X-ray source operating at 30 kV and 10 mA. The measurements were taken between 2θ = 10–90°, with a 0.026° step. Total scattering data were collected on the Brockhouse high-energy wiggler beamline using a wavelength of λ = 0.2081 Å and a PerkinElmer XRD1621 area detector placed 160 mm after the sample. The data were processed using GSAS-II. The Qmax used to produce the PDF of the measured samples was 21 Å−1. The ESCAProbeP spectrometer (Omicron Nanotechnology Ltd, Germany) X-ray photoelectron spectrometer equipped with a monochromatic Al-α radiation source (1486.7 eV) was used for the wide-scan survey and high-resolution spectral measurements. The wide-scan surveys of all elements were measured in the range of 0–900 eV with a pass energy of 100 eV and a step of 1 eV, whilst high-resolution scans of the C1s, O1s, and N1s peaks were measured with a pass energy of 20 eV and a step of 0.1 eV.Results and discussion
Temperature-dependent morphological evolution
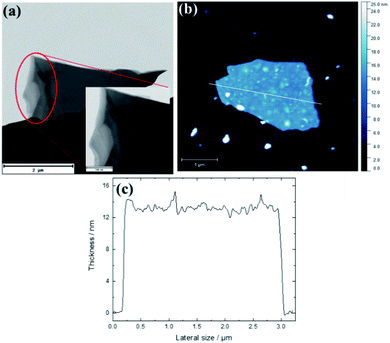
The morphological changes shown by the N-doped carbon dots (NCDs) as a function of heat treatment were investigated using both TEM and AFM micrographs. Both microscopic analyses showed changes in the lateral dimensions of the graphene-like nanosheets with heat treatment (Fig. 1, S1–S3†); from the small pristine NCDs of average particle size of ∼4.1 ± 0.9 nm (Fig. S1a†) to an amorphous mass (Fig. S1b†) and multi-layered nanostructures. For instance, TEM analysis showed that heat treatment at 700 °C produced large and multi-layered nanosheets with an average size of ∼3.71 ± 0.31 μm by ∼2.13 ± 0.91 μm (Fig. 1a). Additionally, the HR-TEM images of pristine NCDs and NCDs700 in Fig. S2† shows that the pristine NCDs had lattice fine structure, with the lattice d-spacing of ca. 0.204 and 0.210 nm, similar to that of the (101) and (100) plane lattice of graphite, respectively.22,27 In contrast, the NCDs700 did not show any lattice fringes (Fig. S2b†). This implies that graphitization is lost when the NCDs are transformed into 2D nanosheets.AFM images of NCDs700 also confirmed the formation of large-area stacked nanosheets of up to 2.75 μm in lateral size and ∼14 nm in thickness (Fig. 1b and c). The formation of the nanosheets could be attributed to high temperature transformations of the carbon dots nanostructures, which was subsequently followed by the coalescence of the as-produced carbonaceous fragments into stacked two-dimensional (2D) nanostructures.22,23 In comparison to the undoped CDs-derived graphene-like nanosheets which exhibited an average size of ca. 1.71 × 0.909 μm,22 it can be concluded that N-doping affected both the temperature required to transform the CDs as well as the final structure obtained at the highest annealing temperature.
The 400 °C heat treatment was observed to not only lead to formation of the multi-layered 2D nanosheets (Fig. S1c†), but the stacked nanostructures also contained small accreted quasi-spherical nanoparticles (Fig. S3b†). This indicates that the 400 °C annealing temperature was insufficient to facilitate a complete transformation of the NCDs into active carbon fragments and consequently resulted to formation of the mixture of CDs and the 2D nanostructures. Height profile analysis by AFM showed the presence of small and thinner (∼0.75 nm) nanosheets exhibiting the lateral diameter of ∼0.15 μm (Fig. S3c,† red line). Further confirmation of the important effect of annealing temperature on the transformation of the NCDs was shown by annealing at 200 °C that resulted in formation of an amorphous-looking mass of carbon embedded with quasi-spherical nanoparticles (Fig. S1b and S3a†).
Physicochemical properties
Structural disorder associated with the heat treatment and the presence of N-dopants were investigated using Raman spectra. As shown in Fig. 2, the spectra for the NCDs400 and NCDs700 samples exhibited fingerprint Raman peaks characteristic of carbonaceous materials.28,29 The first order Raman modes were located between ∼1341-1357 cm−1 and ∼1578–1580 cm−1 for the D-band and G-band, respectively, whilst the second order Raman (2D) band for the NCDs700, overlapped with the overtone of the D + G band at ∼2790 cm−1.28,29 In the case of the NCDs200 sample (Fig. 2 insert), the Raman modes could not be characterized due to the photoluminescent excitation of the carbon dots by the Raman radiation source as well as the fluorescence properties of the carbon dots.30 Additionally, the inclined baseline for the NCDs400 sample indicated that these materials still contained some fluorescent carbon dots. As such, quantification of the structural properties of NCDs400 sample was difficult. Nonetheless, quantification of the degree of graphitization for the NCDs700 sample was investigated from the estimated ratios of the integrated areas under the D-band and the G-band (viz. ID/IG).28 The structural defect density ratio (ID/IG) was estimated to be ca. 3.38 ± 0.12, resulting in a relatively large defect density (nD, see eqn (S2)†) of ∼11.6 × 1011 cm−2.31 Furthermore, the PXRD analysis results in Fig. S4a† show that increasing the annealing temperature did not yield highly ordered nanosheets. The low degree of graphitization for the NCDs700 sample was attributed to the realignment of the carbon lattice upon formation of larger graphitic domains as well as the lattice distortion associated with the incorporation of the nitrogen heteroatoms, confirmed by pair distribution function (PDF) analysis (see below). Therefore, taking into account the relation between the excitation wavelength and the defect density ratio, the average sp2 crystallite sizes (La, eqn (S1)†31) was found to be ∼4.98 ± 0.03 nm. The La value complimented the TEM and AFM micrograph data (Fig. 1a and c), which revealed the formation of bigger lateral size nanosheets upon annealing at 700 °C, as was also observed from our previous work on undoped nanosheets. Interestingly, bigger sheets were formed for the N-doped samples.22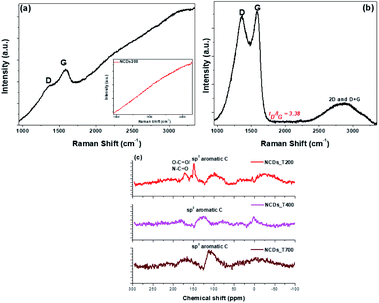 | ||
| Fig. 2 Raman spectra of (a) NCDs400 and (b) NCDs700 samples, with inset of (a) showing that of NCDs200; (c) 13C NMR spectra for the three annealed NCDs samples. | ||
Based on the thermal stability results from TGA (Fig. S4b†), the first order derivative profiles of the NCDs400 and NCDs700 samples confirmed the formation of carbonaceous nanosheets as shown by the decomposition peak at ∼624 °C and 635 °C, respectively. The single peak indicated a homogenous decomposition of the highly defective 2D structured nanosheets and/or the carbon core.32 Furthermore, the peaks at ca. 343 °C and 380 °C for the NCDs200 and NCDs400 samples, respectively, suggested the removal of amorphous carbon phases and organic dangling-bonds from the NCDs upon heat treatment. The lack of the low temperature peak(s) for the NCDs700 sample is indicative of the formation of a CDs-free product.22 More importantly, the peak at ca. 500 °C for NCDs400 and the broadness of peaks for the NCDs700 samples can be linked to strongly bound functional groups.33 Taking into account the contribution of the N-configuration on the thermal stability of the NCDs samples, an increased thermal stability of ∼200 °C was observed for the NCDs samples as compared to their undoped counterparts.22 The observation may be attributed to the presence of the pyrrolic-, pyridinic- and graphitic-N bonds present in the nanosheets as suggested by the XPS results (see below). These groups are thus more stable under air, compared to the O-containing groups.34 Finally, the small derivative peaks between ca. 60 and 80 °C in all 3 samples were attributed to moisture found within the samples.35
13C NMR data were collected and found to be consistent with the TGA results, which showed removal of oxygen functional groups after high-temperature annealing (Fig. 2c). For instance, the 13C NMR spectra of the NCDs200 showed a peak at ca. δ 170 corresponding to O–C![[double bond, length as m-dash]](https://www.rsc.org/images/entities/char_e001.gif) O and/or N–C
O and/or N–C![[double bond, length as m-dash]](https://www.rsc.org/images/entities/char_e001.gif) O36 which decreased on annealing. More importantly, the sp2 peak at ca. δ 117 ppm increased with increasing annealing temperature which is characteristic of the presence of aromatic carbon atoms, hence signifying the transformation of the carbon into large-area nanostructures. Finally, PL spectra showed that only the NCDs200 was PL active, with an emission peak at ca. 609 nm, located in the near-IR region.22 This emission peak was due to the presence of the NCDs embedded within the formed layered nanostructures. The observed PL quenching that occurred after annealing (Fig. S4c†) is further suggestive of the removal of PL-active surface functional groups on the CDs,37 thereby leading to structural transformation from CDs to layered materials.
O36 which decreased on annealing. More importantly, the sp2 peak at ca. δ 117 ppm increased with increasing annealing temperature which is characteristic of the presence of aromatic carbon atoms, hence signifying the transformation of the carbon into large-area nanostructures. Finally, PL spectra showed that only the NCDs200 was PL active, with an emission peak at ca. 609 nm, located in the near-IR region.22 This emission peak was due to the presence of the NCDs embedded within the formed layered nanostructures. The observed PL quenching that occurred after annealing (Fig. S4c†) is further suggestive of the removal of PL-active surface functional groups on the CDs,37 thereby leading to structural transformation from CDs to layered materials.
Compositional analysis
Through the estimation of the integrated areas under the XPS wide scan spectra, the atomic percentage (at%) compositions of the annealed NCDs were determined (see Table S1†). From Fig. 3a, three distinct characteristic peaks corresponding to C1s (∼284 eV), N1s (∼398 eV) and O1s (∼532 eV) were observed. Detailed analysis of the survey spectra revealed the evolution of the nitrogen content with annealing temperature. For instance, the freshly prepared NCD sample showed the incorporation of ca. 15.9 at% of nitrogen heteroatoms, whilst treatment of 700 °C led to a decrease in the N content to ca. 7.79 at% within the carbon lattice (Fig. 3b). The decreasing N-content with increasing annealing temperature is consistent with the loss of edge-bonded nitrogen atoms in the form of nitrogen gas, ammonia gas and/or nitrogen radicals.38 Moreover, the high temperature promoted coalescence of the carbon domains, led to an increased carbon content on annealing (ca. 68.8 at% in the NCDs and ca. 84.1 at% in the NCDs700).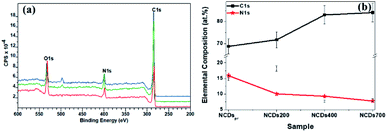 | ||
| Fig. 3 (a) XPS survey spectra for NCDs200 (red), NCDs400 (green), and NCDs700 (blue) samples, as well as (b) elemental composition of the as-synthesized samples. | ||
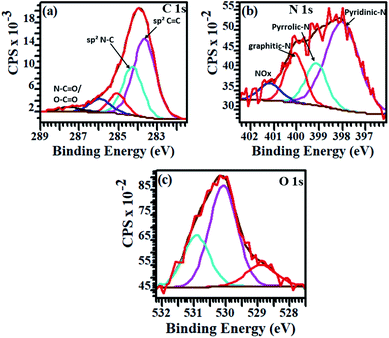
The bonding states of carbon (C), nitrogen (N) and oxygen (O) atoms in the annealed samples were determined through the peak fitting of their high resolution XPS spectra. Fig. 4 displays the resolved spectra for NCDs700 sample, whilst those of the NCDs200 and NCDs400 samples are shown in Fig. S5 and S6.† The broad, tailing C1s spectra (Fig. 4a, S5a and S6a†) was resolved to at least five components corresponding to graphite-like sp2 C–C bonds (∼283.6–283.8 eV), the sp2-N–C bonds (∼284.8–285.1 eV), the defect-induced sp3-C–C and/or C–N bonds (∼285.6–286.2 eV), and the oxygenated bonding configurations of C![[double bond, length as m-dash]](https://www.rsc.org/images/entities/char_e001.gif) O (∼286.6–287.7 eV) as well as the N–C
O (∼286.6–287.7 eV) as well as the N–C![[double bond, length as m-dash]](https://www.rsc.org/images/entities/char_e001.gif) O and/or O–C
O and/or O–C![[double bond, length as m-dash]](https://www.rsc.org/images/entities/char_e001.gif) O bonds (∼287.9–288.8 eV).39,40
O bonds (∼287.9–288.8 eV).39,40
Similarly, the type of nitrogen dopant in the carbon lattice of the annealed NCDs samples was investigated by the deconvolution of the N1s spectra (Fig. 4b, S5b and S6b†). Peak fitting revealed four component peaks attributed to contributions from pyridinic-N (∼397.7–398.1 eV), pyrrolic-N (∼398.9–399.2 eV), substitutional/graphitic-N (∼400.1–400.3 eV), and the oxidized pyridinic-N bonds (NOx, ∼401.2–402.1 eV).39 Finally, the O1s spectra (Fig. 4c, S5c and S6c†) were deconvoluted into three component peaks which can be assigned to O![[double bond, length as m-dash]](https://www.rsc.org/images/entities/char_e001.gif) C and/or O–N (∼528.9–529.9 eV), O–C (∼530.1–531.6 eV), and the N–C
C and/or O–N (∼528.9–529.9 eV), O–C (∼530.1–531.6 eV), and the N–C![[double bond, length as m-dash]](https://www.rsc.org/images/entities/char_e001.gif) O/O–C
O/O–C![[double bond, length as m-dash]](https://www.rsc.org/images/entities/char_e001.gif) O (∼532.9–533.5 eV) bonds, respectively.40 Noticeably, the different bonding state distributions of the Nitrogen (Fig. S7†) showed the formation of different N-configurations through the adjustment of the annealing temperature (Scheme 1). For instance, annealing at 400 °C led to the formation of predominantly pyrrolic-N bonding states (∼45.8%) and pyridinic-N configurations (∼39.4%), thereby indicating that most of the amide groups from urea are bonded to the carbon at the domain edges. Moreover, fewer substitutional N-configurations (∼12.3%) show that the 400 °C heat treatment is not sufficient to facilitate the coalescence of the NCDs domains into graphene-like nanostructures. Such coalescence phenomenon could result in the transformation of pyridinic-N bonds into graphitic-N type.38 On the other hand, a higher annealing temperature (e.g. 700 °C) was found to enhance the formation of pyridinic-N (∼56.9%) due to the coalescence of the NCDs domains into bigger graphene-like nanostructures (Fig. 1a). The results are in good agreement with theoretical studies which have indicated that N atoms are more thermodynamically stable at carbonaceous edges; with the pyridinic-type being the most stable.41,42
O (∼532.9–533.5 eV) bonds, respectively.40 Noticeably, the different bonding state distributions of the Nitrogen (Fig. S7†) showed the formation of different N-configurations through the adjustment of the annealing temperature (Scheme 1). For instance, annealing at 400 °C led to the formation of predominantly pyrrolic-N bonding states (∼45.8%) and pyridinic-N configurations (∼39.4%), thereby indicating that most of the amide groups from urea are bonded to the carbon at the domain edges. Moreover, fewer substitutional N-configurations (∼12.3%) show that the 400 °C heat treatment is not sufficient to facilitate the coalescence of the NCDs domains into graphene-like nanostructures. Such coalescence phenomenon could result in the transformation of pyridinic-N bonds into graphitic-N type.38 On the other hand, a higher annealing temperature (e.g. 700 °C) was found to enhance the formation of pyridinic-N (∼56.9%) due to the coalescence of the NCDs domains into bigger graphene-like nanostructures (Fig. 1a). The results are in good agreement with theoretical studies which have indicated that N atoms are more thermodynamically stable at carbonaceous edges; with the pyridinic-type being the most stable.41,42
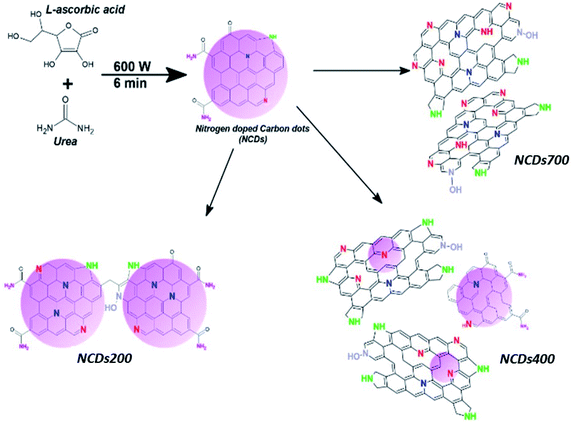 | ||
| Scheme 1 Representation of evolution of N-configurations in NCDs with respect to annealing temperature. | ||
Total scattering measurements and derived pair distribution function (PDF)
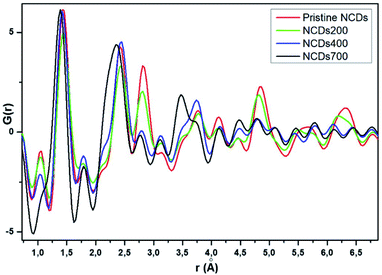
Total scattering measurements were conducted at the Canadian Light Source to examine the local structure of the samples synthesized in this study (Fig. 5). The atomic pair distribution function (PDF) technique provides insight into the structure of materials in the short and medium range scales.43 Generally, the PDF results showed that the NCDs prior to annealing exhibited the longest range order, as can be seen by the increased dampening in the PDF signal from pristine NCDs to NCDs700 at r values as low as 10 Å (Fig. S8†). The first prominent peak, around 1.42 Å for the pristine NCDs (Fig. 5), corresponds to the C–C bonds and some C–N bonds with three nearest neighbours to carbons, all with sp2 bonding,44 bearing in mind that the pristine NCDs contains ∼15.9 at% N. In comparison with the C–C bonds at ca. 1.42 Å in a pristine graphene structure,45 the C–C peak is observed to shift to lower r values (∼1.38 Å) with N-doping and annealing, suggesting increasing contribution of the shorter C–N bonds. More importantly, the shifting and broadening of the peak could be ascribed to the varying contributions from both the pyridinic- and pyrrolic-N moieties, as these are characterized by peaks at ca. 1.34 Å and 1.38 Å, respectively.44The peak at 1.1 Å corresponds to C![[double bond, length as m-dash]](https://www.rsc.org/images/entities/char_e001.gif) O bond lengths with slight shortening of the bonds from their regular 1.2 Å length due to electron delocalisation over the graphene resonance structures.45 It must be noted that these peaks, even though weak, do demonstrate a clear trend showing a reduction in the peak intensity from the pristine NCDs to the NCDs700 sample indicating the removal of these groups as temperature increases. The second prominent peak at ca. 2.44 Å corresponds to the shortest diagonal in the carbon hexagon and is close to that of the predicted model (ca. 2.46 Å, Fig. 6). This peak broadened as the annealing temperature increased. Most noticeably, the NCDs700 sample showed significant broadening at this peak position compared to the other samples, indicating the distance between the three atoms coordinating the central carbon in the hexagon, or the shortest diagonal in the hexagon, varies significantly from one ring structure to the next. The third peak at 2.81 Å (close to the ca. 2.83 Å, Fig. 6), which is twice the first C–C distance, is the long diagonal in the hexagon.46 This peak shifts to lower r values (∼2.77 Å) and its intensity decreases with increasing annealing temperatures. The observed trends with higher annealing temperature suggest increasing disorder in the C-ring due to the insertion of N in the rings.
O bond lengths with slight shortening of the bonds from their regular 1.2 Å length due to electron delocalisation over the graphene resonance structures.45 It must be noted that these peaks, even though weak, do demonstrate a clear trend showing a reduction in the peak intensity from the pristine NCDs to the NCDs700 sample indicating the removal of these groups as temperature increases. The second prominent peak at ca. 2.44 Å corresponds to the shortest diagonal in the carbon hexagon and is close to that of the predicted model (ca. 2.46 Å, Fig. 6). This peak broadened as the annealing temperature increased. Most noticeably, the NCDs700 sample showed significant broadening at this peak position compared to the other samples, indicating the distance between the three atoms coordinating the central carbon in the hexagon, or the shortest diagonal in the hexagon, varies significantly from one ring structure to the next. The third peak at 2.81 Å (close to the ca. 2.83 Å, Fig. 6), which is twice the first C–C distance, is the long diagonal in the hexagon.46 This peak shifts to lower r values (∼2.77 Å) and its intensity decreases with increasing annealing temperatures. The observed trends with higher annealing temperature suggest increasing disorder in the C-ring due to the insertion of N in the rings.
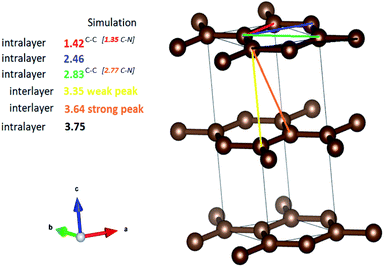 | ||
| Fig. 6 Inter and intralayer bond distances between carbon atoms in graphite. The values in brackets are given for nitrogen-doped graphene. These values correspond to the observed peaks in G(r). | ||
It is clear that the NCDs prior to annealing exhibit the longest range order, as can be seen by the increased dampening in the PDF signal from pristine NCDs to NCDs700. It is noted that the signal attenuation is high, even at r values as low as 10 Å, especially for NCDs400 and NCDs700, indicating the existence of short coherence lengths (Fig. S8†). Typically, the PDF pattern that originates from interlayer atomic correlations is signified by the weak 3.35 Å and strong 3.64 Å peaks (Fig. 6) and is indicative of well-ordered graphite structure. In all samples, the weak peak at 3.35 Å (Fig. 6) shifts to slightly higher r values (3.48 Å, Fig. 5) indicating a small increase in the interlayer spacing. A similar trend is noted when examining the 3.64 Å peak (Fig. 6) which is also shifted to slightly higher r values and is positioned around 3.75 Å (Fig. 5), with lower than expected peak intensity. Therefore, the shift of these peaks and the noted reduction in the intensity of the 3.75 Å peak indicates a higher degree of turbostratic and positional disorder from one graphene sheet to the next.47 Therefore, the aforementioned shifted peak positions to higher r values are due to disorder arising from the defective structures within the nitrogen-doped graphitic sheets leading to the slightly larger interlayer spacing coupled with turbostratic disorder.47 The data shows that by 700 °C, significant insertion of nitrogen into the structure has occurred, as well as the formation of higher-order ring structures and an increase in defective structures.
Sensing properties
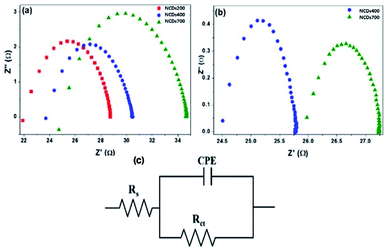 | ||
| Fig. 7 Nyquist plots for the sensor devices after exposure to (a) 1200 ppm of MeOH and (b) 1100 ppm of EtOH vapours, (c) representative equivalent Randle circuit. | ||
| Analyte | Active material | Resistance (Ω) | Capacitance (μF) | |
|---|---|---|---|---|
| Rs | RCT | |||
| Methanol | NCDs200 | 22.5 | 6.11 | 0.18 |
| NCDs400 | 24.2 | 6.07 | 0.15 | |
| NCDs700 | 25.6 | 8.95 | 0.10 | |
| Ethanol | NCDs400 | 24.3 | 1.47 | 17.9 |
| NCDs700 | 25.6 | 1.58 | 4.86 | |
On the other hand, owing to the different structural properties and the varying composition of the N-dopants within the active materials, it was observed that each electrode responded differently to the two analytes. Specifically, the NCDs700 device exhibited the highest resistance in the presence of MeOH, followed by the NCDs200 and eventually the NCDs400 device, as shown by the values of the charge transfer resistance (RCT, Table 1). The faster charge transfer for the NCDs400 can be attributed to the abundance of pyrrolic-N (∼45.8%) and pyridinic-N configurations (∼39.4%) through an improved π–π interaction with the analyte molecules as well as the availability of extra π-electrons on the N-dopants for the ionization of adsorbed oxygen species.50 Moreover, the presence of a combination of NCDs fragments and small-sized graphene-like nanosheets could have created an abundance of defective sites which enabled quicker transport of charge-carriers. The slower charge transfer for the NCDs700 devices for detection of both MeOH (8.95 Ω) and EtOH (1.58 Ω) can be ascribed to the charging-hopping effect over the large lateral flakes,50 despite the material having electron-rich centres due to the presence of the graphitic-N (∼18.3%) and pyridinic-N (∼56.9%) configurations.50 Based on the results, it can be seen that not only the morphology of the carbon nanostructure, but also the concentration of the different nitrogen bonding states, plays a major role in the charge-carrier transfer properties of the NCDs.
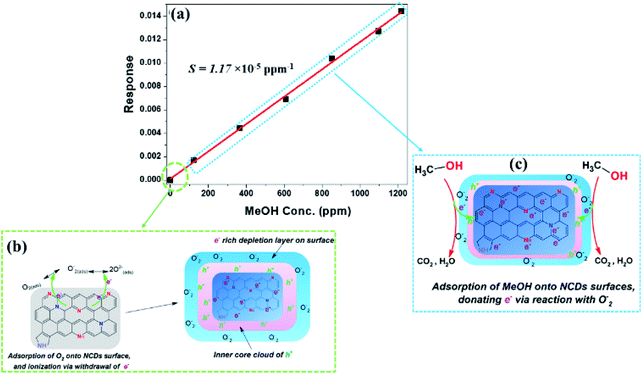 | ||
| Fig. 8 (a) Sensor response as a function of MeOH vapour concentrations for the NCDs700 sensor devices, (b) ionization of adsorbed O2, and (c) detection mechanism of MeOH. | ||
In the case of the sensing of EtOH, both the NCDs400 and NCDs700 sensor devices exhibited an n-type semiconducting behaviour51 as shown by the decreasing sensor response with increasing analyte concentration (Fig. 9). Lack of response to EtOH for the NCDs200 samples indicated that not only the type of N-configurations but also the structural properties of the active material influence the sensing mechanism for ethanol. For instance, the large sensitivity of −16.8 × 10⁻⁵ ± 0.5 pm−1 and low LoD value (43.5 ± 0.4 ppm) for the NCDs700-based sensor devices in comparison to the sensing performance of the NCDs400-based device (S = −2.09 × 10⁻⁵ ± 0.8 ppm−1 and LoD ≈ 91.4 ± 0.1 ppm) can be attributed to the weak interaction between EtOH molecules and the basal plane of the NCDs700. It is also possible that the slightly increased charge carrier density moieties in the form of graphitic-N (∼18.3 at%) and pyridinic-N (∼56.9 at%) bonding states play a role in the process. Therefore, the sensing mechanism for EtOH on the active materials can also be explained by the change in the surface depletion layer around the NCDs nanostructures (Fig. 9b and c). Similar to the sensing mechanism for MeOH, prior to exposure to the EtOH analyst vapour, an electron-rich depletion layer is formed on the surface of the NCDs (Fig. 8b) through ionization of adsorbed oxygen molecules. On exposure to the EtOH vapour, which acts as a reducing atmosphere,53 the ionized oxygen species are removed so as to convert EtOH into water and carbon dioxide. The removal of the ionized O2 species is then followed by the injection of electrons back into the NCDs nanostructures, thereby increasing the conductance channel within the NCDs structures (Fig. 9c).54
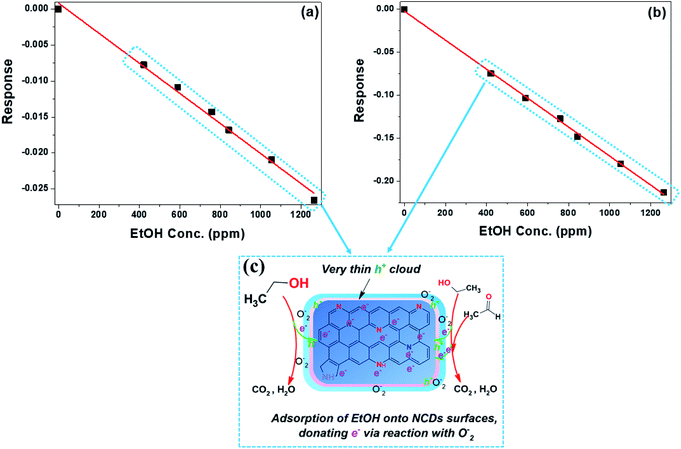 | ||
| Fig. 9 Sensor response as a function of EtOH vapour concentrations for the (a) NCDs400 and (b) NCDs700 sensor devices; (c) detection mechanism of EtOH. | ||
From Table 2, the reported impedimetric sensing performances for the detection of either MeOH or EtOH are seen to be comparable to data measured for graphene oxide, transition metal dichalcogenides (TMDs), metal oxides, and metal frameworks. More importantly, the facile route for transforming 0D CDs into 2D nanostructures22 also produced a composite of CDs/NCDs carbon fragments that improved the charge carrier retention and formation of the depletion layers. This facilitated a faster charge carrier transportation from the active material to the analyte molecules, and hence enhanced the sensitivity. Moreover, the use of the ‘composites’ (NCDs200 and NCDs400) as well as the NCDs700 (with large basal area) generated enough defective sites for improved adsorption of the VOCs analyte molecules, therefore eliminating the need to use conducting polymers8 or porous molecular frameworks.55 This provides an alternative method to make the alcohol sensor without added synthesis steps.
| Analyte | Active material | Conc. range (ppm) | Temp. (°C) | LoD (ppm) | Ref. |
|---|---|---|---|---|---|
| a Au/TiO2-NT/Ti → gold on titania nanotubes, In2S3 → indium selenide, ZnO → zinc oxide, PMMA → polymethyl methacrylate, MoS2 → molybdenum disulphide, Cu-BTC → copper-benzene tricarboxylate, PLA → poly(lactic acid), MOF → metal organic framework.b Corresponds to response signal.c Represents concentration in ppt. | |||||
| Methanol | Au/TiO2-NT | 200–600 | 27 | — | 56 |
| NCDs200 | 120–1200 | RT | 37.1 | This work | |
| NCDs400 | 34.9 | ||||
| NCDs700 | 30.3 | ||||
| MoS2 | 200–400 | 200 | — | 57 | |
| Cu-BTC MOF | 250–1500 | 25 | 62 | 55 | |
| Ethanol | β-In2S3 | 500–1000 | 350 | 6b | 58 |
| NCDs400 | 420–1200 | RT | 91.4 | This work | |
| NCDs700 | 43.5 | ||||
| PLA-Gr | 25–100 | 50 | — | 59 | |
| GN-PMMA | 1.96–69c | RT | 19.7 | 8 | |
| ZnO | 1–500 | RT | 100 | 60 | |
Conclusions
The study demonstrated that through a facile thermal treatment, nitrogen-doped and large area 2D graphene-like nanostructures could be easily attained from 0D CDs by adjustment of the CDs annealing temperature (200–700 °C). Furthermore, the nitrogen content as well as the nitrogen configurations of the N-doped CDs was found to be dependent on the structural transformation due to the annealing temperature. For instance, as higher temperatures favoured the lateral growth, the arrangement of N-atoms was found to be more dominant at the carbon edges (∼57 at% pyridinic-N), whilst the coalescence of the CDs into 2D nanostructures led to the ingrowth of interstitial nitrogen dopants (∼17 at% graphitic-N). At 200 °C the transformation of CDs into 2D nanostructures was incomplete, resulting in the synthesis of a carbon composite made of CDs fragments embedded in an amorphous mass of N-doped carbon. Screening for VOCs through the impedimetric sensing measurements, demonstrated that the NCDs-based devices were responsive to methanol and ethanol. A good correlation between the structural properties of the NCDs as well as the type of N-configurations and their corresponding sensitivity for the alcohol-based VOCs was observed. In particular, the large-area 2D NCDs700 nanosheets facilitated a high charge density via incorporation of pyridinic-N (∼57 at%) and graphitic-N (∼18.3 at%) configurations. This subsequently promoted enhanced sensitivity and selectivity of the NCDs700-based devices for the detection and recognition of both methanol and ethanol. Generally, the transformed nanostructures exhibited excellent room temperature impedimetric sensing performance for the detection of alcohol-based VOCs, thereby opening up a new platform for carbon-based materials for chemical vapour sensing. As the different NCDS gave different abilities for the detection of EtOH and MeOH this suggests that a combination of these ‘easy to make’ structures could be used to develop an ‘electronic nose’ for the room temperature detection of many other VOCs.Author contributions
L. L. M.; J. B. M: writing, data collection, analysis, design.N. A., B. D. M.; D. H. B.: data collection, analysis.
R. P. F.; Z. S.; N. J. C.: conception, design, supervision, funding.
Conflicts of interest
There are no conflicts to declare.Acknowledgements
The study was financially supported by the NRF, the University of the Witwatersrand (post graduate merit award to LLM), the DSI-NRF Centre of Excellence in Catalysis (c* change, LLM, NJC and RPF), the European Structural and Investment Funds (JBM) under OP RDE-funded project ‘CHEMFELLS IV’ (No. CZ.02.2.69/0.0/0.0/20_079/0017899), and by the Czech Science Foundation (GAČR No. 20-16124J). Sincere gratitude goes to Dr Rudolph Erasmus from the School of Physics at the University of the Witwatersrand for his assistance with Raman and photoluminescence collection and analysis. We are also thankful to Dr Memory Zimuwandeyi and Dr Mudzuli Maphupha (School of Chemistry, University of the Witwatersrand) for NMR data collection and data processing, respectively. We would also like to thank Mr Solly Motaung and Ms Sinegugu Nzuza (Council for Scientific and Industrial Research, South Africa) for the HRTEM analysis data. Finally, we thank the Canadian Light Source, a national research facility of the University of Saskatchewan, which is supported by the Canada Foundation for Innovation (CFI), the Natural Sciences and Engineering Research Council (NSERC), the National Research Council (NRC), the Canadian Institutes of Health Research (CIHR), the Government of Saskatchewan, and the University of Saskatchewan for PDF data collection.References
- C. K. McGinn, Z. A. Lamport and I. Kymissis, Review of Gravimetric Sensing of Volatile Organic Compounds, ACS Sens., 2020, 5, 1514–1534 CrossRef CAS PubMed.
- B. Li, Q. Zhou, S. Peng and Y. Liao, Recent Advances of SnO2-Based Sensors for Detecting Volatile Organic Compounds, Front. Chem., 2020, 8, 1–6 CrossRef PubMed.
- A. Mirzaei, S. G. Leonardi and G. Neri, Detection of hazardous volatile organic compounds (VOCs) by metal oxide nanostructures-based gas sensors: A review, Ceram. Int., 2016, 42, 15119–15141 CrossRef CAS.
- W. T. Tsai, An overview of health hazards of volatile organic compounds regulated as indoor air pollutants, Rev. Environ. Health, 2019, 34, 81–89 CrossRef CAS PubMed.
- J. M. Celaya-Padilla, J. S. Romero-González, C. E. Galvan-Tejada, J. I. Galvan-Tejada, H. Luna-García, J. G. Arceo-Olague, N. K. Gamboa-Rosales, C. Sifuentes-Gallardo, A. Martinez-Torteya, J. I. De la Rosa and H. Gamboa-Rosales, In-vehicle alcohol detection using low-cost sensors and genetic algorithms to aid in the drinking and driving detection, Sensors, 2021, 21, 7752 CrossRef PubMed.
- G. J. Thangamani, K. Deshmukh, K. C. M. Basheer, A. Kishor and K. Sadasivuni, Influence of CuO nanoparticles and graphene nanoplatelets on the sensing behaviour of poly (vinyl alcohol) nanocomposites for the detection of ethanol and propanol vapors, J. Mater. Sci.: Mater. Electron., 2018, 29, 5186–5205 CrossRef CAS.
- S. Lakkis, R. Younes, Y. Alayli and M. Sawan, Review of recent trends in gas sensing technologies and their miniaturization potential, Sens. Rev., 2014, 34, 24–35 CrossRef.
- A. Yavarinasab, S. Janfaza, N. Tasnim, H. Tahmooressi, A. Dalili and M. Hoorfar, Graphene/poly (methyl methacrylate) electrochemical impedance-transduced chemiresistor for detection of volatile organic compounds in aqueous medium, Anal. Chim. Acta, 2020, 1109, 27–36 CrossRef CAS PubMed.
- X. Zhu, J. Zhang, Q. Xie and Z.-L. Hou, High-Sensitivity and Ultrafast-Response Ethanol Sensors Based on Graphene Oxide, ACS Appl. Mater. Interfaces, 2020, 12, 38708–38713 CrossRef CAS PubMed.
- L. T. Duy, Y. G. Noh and H. Seo, Improving graphene gas sensors via a synergistic effect of top nanocatalysts and bottom cellulose assembled using a modified filtration technique, Sens. Actuators, B, 2021, 334, 129676 CrossRef CAS.
- S. Hu, Q. Huang, Y. Lin, C. Wei, H. Zhang, W. Zhang, Z. Guo, X. Bao, J. Shi and A. Hao, Reduced graphene oxide-carbon dots composite as an enhanced material for electrochemical determination of dopamine, Electrochim. Acta, 2014, 130, 805–809 CrossRef CAS.
- J. Fang, Z. Xie, G. Wallace and X. Wang, Co-deposition of carbon dots and reduced graphene oxide nanosheets on carbon-fiber microelectrode surface for selective detection of dopamine, Appl. Surf. Sci., 2017, 412, 131–137 CrossRef CAS.
- F. Meng, Z. Guo and X. Huang, Trends in Analytical Chemistry Graphene-based hybrids for chemiresistive gas sensors, Trends Anal. Chem., 2015, 68, 37–47 CrossRef CAS.
- J. Hu, C. Zou, Y. Su, M. Li, N. Hu, H. Ni, Z. Yang and Y. Zhang, Enhanced NO2 sensing performance of reduced graphene oxide by: In situ anchoring carbon dots, J. Mater. Chem. C, 2017, 5, 6862–6871 RSC.
- M. M. Rahman, M. A. Hussein, K. A. Alamry, F. M. Al Shehry and A. M. Asiri, Sensitive methanol sensor based on PMMA-G-CNTs nanocomposites deposited onto glassy carbon electrodes, Talanta, 2016, 150, 71–80 CrossRef CAS PubMed.
- H. Xu, L. Ma and Z. Jin, Nitrogen-doped graphene: Synthesis, characterizations and energy applications, J. Energy Chem., 2018, 27, 146–160 CrossRef.
- R. Yadav and C. K. Dixit, Synthesis, characterization and prospective applications of nitrogen-doped graphene: A short review, J. Sci.: Adv. Mater. Devices, 2017, 2, 141–149 Search PubMed.
- M. Coros, C. Varodi, F. Pogacean, E. Gal and S. M. Pruneanu, Nitrogen-Doped Graphene: The Influence of Doping Level on the Charge-Transfer Resistance and Apparent Heterogeneous Electron Transfer Rate, Sensors, 2020, 20, 1815 CrossRef CAS PubMed.
- Q. Huang, Y. Xu, Y. Guo, L. Zhang, Y. Hu, J. Qian and S. Huang, Highly graphitized N-doped carbon nanosheets from 2-dimensional coordination polymers for efficient metal-air batteries, Carbon, 2022, 188, 135–145 CrossRef CAS.
- Y. Tang, H. Zhang, W. Chen, Z. Li, Z. Liu, D. Teng and X. Dai, Modulating geometric, electronic, gas sensing and catalytic properties of single-atom Pd supported on divacancy and N-doped graphene sheets, Appl. Surf. Sci., 2020, 508, 145245 CrossRef CAS.
- G. Bharathi, D. Nataraj, S. Premkumar, M. Sowmiya, K. Senthilkumar, T. D. Thangadurai, O. Y. Khyzhun, M. Gupta, D. Phase, N. Patra, S. N. Jha and D. Bhattacharyya, Graphene Quantum Dot Solid Sheets: Strong blue-light emitting & photocurrent-producing band-gap-opened nanostructures, Sci. Rep., 2017, 7, 1–17 CrossRef CAS PubMed.
- L. L. Mokoloko, B. J. Matsoso, R. P. Forbes, D. H. Barrett, B. D. Moreno and N. J. Coville, Evolution of large-area reduced graphene oxide nanosheets from carbon dots via thermal treatment, Carbon Trends, 2021, 4, 100074 CrossRef.
- H. Hou, L. Shao, Y. Zhang, G. Zou, J. Chen and X. Ji, Large Area Carbon Nanosheets Doped with Phosphorus: A High Performance Anode Material for Sodium-Ion Batteries, Adv. Sci., 2017, 4(1–11), 1600243 CrossRef PubMed.
- A. Sharma and J. Das, Small molecules derived carbon dots: Synthesis and applications in sensing, catalysis, imaging, and biomedicine, J. Nanobiotechnol., 2019, 17, 1–24 CrossRef CAS PubMed.
- S. Zhu, Y. Song, X. Zhao, J. Shao, J. Zhang and B. Yang, The photoluminescence mechanism in carbon dots (graphene quantum dots, carbon nanodots, and polymer dots): current state and future perspective, Nano Res., 2015, 8, 355–381 CrossRef CAS.
- S. Sugiarti and N. Darmawan, Synthesis of fluorescence carbon nanoparticles from ascorbic acid, Indones. J. Chem., 2015, 15, 141–145 CrossRef CAS.
- S. K. Bajpai, A. D'Souza and B. Suhail, Blue light-emitting carbon dots (CDs) from a milk protein and their interaction with Spinacia oleracea leaf cells, Int. Nano Lett., 2019, 9, 203–212 CrossRef CAS.
- A. C. Ferrari, J. Robertson, A. C. Ferrari and J. Robertson, Raman spectroscopy of amorphous, nanostructured, diamond–like carbon, and nanodiamond, Philos. Trans. R. Soc., A, 2004, 362, 2477–2512 CrossRef CAS PubMed.
- L. M. Malard, M. A. Pimenta, G. Dresselhaus and M. S. Dresselhaus, Raman spectroscopy in graphene, Phys. Rep., 2009, 473, 51–87 CrossRef CAS.
- P. Luo, C. Li and G. Shi, Synthesis of gold@carbon dots composite nanoparticles for surface enhanced Raman scattering, Phys. Chem. Chem. Phys., 2012, 14, 7360–7366 RSC.
- L. G. Cançado, K. Takai, T. Enoki, M. Endo, Y. A. Kim, H. Mizusaki, A. Jorio, L. N. Coelho, R. Magalhães-Paniago and M. A. Pimenta, General equation for the determination of the crystallite size La of nanographite by Raman spectroscopy, Appl. Phys. Lett., 2006, 88, 163106 CrossRef.
- B. K. Mutuma, B. J. Matsoso, K. Ranganathan, J. Keartland, D. Wamwangi and N. J. Coville, Generation of radical species in CVD grown pristine and N-doped solid carbon spheres using H2 and Ar as carrier gases, RSC Adv., 2017, 7, 21187–21195 RSC.
- V. N. Mehta, S. Jha and K. Singhal, Preparation of multicolor emitting carbon dots for HeLa cell imaging, New J. Chem., 2014, 38, 6152–6160 RSC.
- X. Mu, B. Yuan, X. Feng, S. Qiu, L. Song and Y. Hu, The effect of doped heteroatoms (nitrogen, boron, phosphorus) on inhibition thermal oxidation of reduced graphene oxide, RSC Adv., 2016, 6, 105021–105029 RSC.
- R. Bandi, B. R. Gangapuram, R. Dadigala, R. Eslavath, S. S. Singh and V. Guttena, Facile and green synthesis of fluorescent carbon dots from onion waste and their potential applications as sensor and multicolour imaging agents, RSC Adv., 2016, 6, 28633–28639 RSC.
- H. W. Kim, H. Park, J. S. Roh, J. E. Shin, T. H. Lee, L. Zhang, Y. H. Cho, H. W. Yoon, V. J. Bukas, J. Guo, H. B. Park, T. H. Han and B. D. McCloskey, Carbon Defect Characterization of Nitrogen-Doped Reduced Graphene Oxide Electrocatalysts for the Two-Electron Oxygen Reduction Reaction, Chem. Mater., 2019, 31, 3967–3973 CrossRef CAS.
- D. Das and R. K. Dutta, N-Doped Carbon Dots Synthesized from Ethylene Glycol and β-Alanine for Detection of Cr(VI) and 4-Nitrophenol via Photoluminescence Quenching, ACS Appl. Nano Mater., 2021, 4, 3444–3454 CrossRef CAS.
- B. J. Matsoso, K. Ranganathan, B. K. Mutuma, T. Lerotholi, G. Jones and N. J. Coville, Time-dependent evolution of the nitrogen configurations in N-doped graphene films, RSC Adv., 2016, 6, 106914–106920 RSC.
- N. Hellgren, R. T. Haasch, S. Schmidt, L. Hultman and I. Petrov, Interpretation of X-ray photoelectron spectra of carbon-nitride thin films: New insights from in situ XPS, Carbon, 2016, 108, 242–252 CrossRef CAS.
- X. Chen, X. Wang and D. Fang, A review on C1s XPS-spectra for some kinds of carbon materials, Fullerenes, Nanotub. Carbon Nanostruct., 2020, 28, 1048–1058 CrossRef CAS.
- M. Ayiania, A. J. R. Hensley, K. Groden, M. Garcia-Perez and J.-S. McEwen, Thermodynamic stability of nitrogen functionalities and defects in graphene and graphene nanoribbons from first principles, Carbon, 2019, 152, 715–726 CrossRef CAS.
- S. Kabir, K. Artyushkova, A. Serov, B. Kiefer and P. Atanassov, Binding energy shifts for nitrogen-containing graphene-based electrocatalysts – experiments and DFT calculations, Surf. Interface Anal., 2016, 48, 293–300 CrossRef CAS.
- S. J. L. Billinge, The rise of the X-ray atomic pair distribution function method: a series of fortunate events, Philos. Trans. R. Soc., A, 2019, 377, 20180413 CrossRef CAS PubMed.
- W. Dmowski, C. I. Contescu, A. Llobet, N. C. Gallego and T. Egami, Local atomic density of microporous carbons, J. Phys. Chem. C, 2012, 116, 2946–2951 CrossRef CAS.
- F. H. Allen, O. Kennard, D. G. Watson, L. Brammer, A. G. Orpen and R. Taylor, Tables of Bond Lengths determined by X-Ray and Neutron Diffraction. Part I. Bond Lengths in Organic Compounds, J. Chem. Soc., Perkin Trans. 2, 1987, S1–S19 RSC.
- H. Krzton and M. Niewiara, Studies on commercial carbon black by radial distribution function and Rietveld refinement, Phys. Scr., 1995, 1995, 98–101 CrossRef.
- J. A. Garlow, L. K. Barrett, L. Wu, K. Kisslinger, Y. Zhu and J. F. Pulecio, Large-Area Growth of Turbostratic Graphene on Ni(111) via Physical Vapor Deposition, Sci. Rep., 2016, 6, 19804 CrossRef CAS PubMed.
- A. Lasia, Electrochemical Impedance Spectroscopy and its Applications, ed B. E. Conway, J. O. Bockris and R. E. White, Springer US, Boston, MA, 2002, pp. 143–248 Search PubMed.
- R. Li, J. Fan, H. Li, X. Yan and Y. Yu, Dynamic behaviors and transport properties of ethanol molecules in transmembrane cyclic peptide nanotubes, J. Chem. Phys., 2015, 143, 15101 CrossRef PubMed.
- B. K. Mutuma, C. I. Garcia-Martinez, R. C. Dias, B. J. Matsoso, N. J. Coville and I. A. Hümmelgen, Nitrogendoped hollow carbon spheres as chemical vapour sensors, New J. Chem., 2019, 43, 8418–8427 RSC.
- A. Wisitsoraat, A. Tuantranont, E. Comini, G. Sberveglieri and W. Wlodarski, Characterization of n-type and p-type semiconductor gas sensors based on NiOx doped TiO2 thin films, Thin Solid Films, 2009, 517, 2775–2780 CrossRef CAS.
- K. Zhang, Y. Feng, F. Wang, Z. Yang and J. Wang, Two dimensional hexagonal boron nitride (2D-hBN): synthesis, properties and applications, J. Mater. Chem. C, 2017, 5, 11992–12022 RSC.
- S. Navale, M. Shahbaz, A. Mirzaei, S. S. Kim and H. W. Kim, Effect of Ag Addition on the Gas-Sensing Properties of Nanostructured Resistive-Based Gas Sensors: An Overview, Sensors, 2021, 21, 6454 CrossRef CAS PubMed.
- Z. Cai and S. Park, Enhancement mechanisms of ethanol sensing properties based on Cr2O3 nanoparticle-anchored SnO2 nanowires, J. Mater. Res. Technol., 2020, 9, 271–281 CrossRef CAS.
- S. Homayoonnia and S. Zeinali, Design and fabrication of capacitive nanosensor based on MOF nanoparticles as sensing layer for VOCs detection, Sens. Actuators, B, 2016, 237, 776–786 CrossRef CAS.
- P. Bindra and A. Hazra, Impedance behavior of n-type TiO2 nanotubes porous layer in reducing vapor ambient, Vacuum, 2018, 152, 78–83 CrossRef CAS.
- M. Barzegar, M. Berahman and A. I. Zad, Sensing behavior of flower-shaped MoS2 nanoflakes: Case study with methanol and xylene, Beilstein J. Nanotechnol., 2018, 9, 608–615 CrossRef CAS PubMed.
- R. Souissi, N. Bouguila and A. Labidi, Ethanol sensing properties of sprayed β-In2S3 thin films, Sens. Actuators, B, 2018, 261, 522–530 CrossRef CAS.
- G. Chakraborty, G. Pugazhenthi and V. Katiyar, Exfoliated graphene-dispersed poly (lactic acid)-based nanocomposite sensors for ethanol detection, Polym. Bull., 2019, 76, 2367–2386 CrossRef CAS.
- P. Shankar and J. B. B. Rayappan, Room temperature ethanol sensing properties of ZnO nanorods prepared using an electrospinning technique, J. Mater. Chem. C, 2017, 5, 10869–10880 RSC.
Footnote |
| † Electronic supplementary information (ESI) available. See https://doi.org/10.1039/d2ra03931a |
| This journal is © The Royal Society of Chemistry 2022 |

