
 Open Access Article
 This Open Access Article is licensed under a
 Creative Commons Attribution 3.0 Unported Licence
High electrocatalytic activity of Pt on porous Nb-doped TiO2 nanoparticles prepared by aerosol-assisted self-assembly
Xin Fua,
Ruisong Lib and
Yucang Zhang *a
*a
aCollege of Ocean Food and Biological Engineering, Jimei University, Xiamen 361021, China. E-mail: yczhang@jmu.edu.cn
bKey Laboratory of Advanced Materials of Tropical Island Resources, Ministry of Education, School of Chemical Engineering and Technology, Hainan University, Haikou 570228, China
First published on 10th August 2022
Abstract
This study explores an aerosol-assisted method to prepare an efficient support for the Pt catalyst of polymer electrolyte membrane fuel cells (PEMFCs). Titania nanoparticles and mesoporous niobium-doped titania nanoparticles were prepared by aerosol-assisted self-assembly using titanium(IV) isopropoxide and niobium(V) ethoxide as the titanium and niobium sources for application as non-carbon supports for the platinum electrocatalyst. The structural characteristics and electrochemical properties of the supports were investigated by transmission electron microscopy, X-ray diffraction, Fourier-transform infrared spectroscopy, X-ray photoelectron spectroscopy, electron paramagnetic resonance, inductively coupled plasma optical emission spectrometry, and dynamic light scattering. The Brunauer–Emmett–Teller method was used to calculate the specific surface areas of the samples, and the pore size distribution was also examined. The results demonstrated that under a radial concentration gradient, the aerosol droplets self-assembled into a spherical shape, and mesoporous supports were obtained after subsequent removal of the surfactant cetyltrimethylammonium bromide by annealing and washing. The hydrothermal technique was then used to deposit platinum on the TiO2-based supports. The electrical conductivity of the non-carbon support was enhanced by the strong metal–support interaction effect between the platinum catalyst particles and the porous niobium-doped TiO2 support. The half-wave potential, electrochemical surface area, mass activity, and specific activity of the obtained Pt/Nb-TiO2 catalyst all surpassed those of commercial Pt/C.
1. Introduction
To fulfill the growing global demand for high-density energy production and storage in the context of the eventual depletion of fossil fuels, researchers are attempting to develop highly efficient, environmentally friendly, renewable, and clean alternative energy sources.1 Proton-exchange membrane fuel cells (PEMFCs) are commonly regarded as a viable option for long-term energy conversion. Because of their high energy conversion, zero carbon emissions, and low operating temperature, PEMFCs are considered to be ideal renewable energy-storage systems for overcoming future energy concerns.2,3 However, they require remarkably active and stable electrocatalysts for both fuel oxidation and the oxygen reduction reaction (ORR).4 The most frequently used ORR electrocatalysts in PEMFCs are composed of platinum nanoparticles supported on porous carbon materials (e.g., graphene oxide, carbon nanotubes, mesoporous carbon, and nitrogen-doped graphene). Although these carbon-based supports have the advantages of low cost and good electrical conductivity, they are also susceptible to corrosion and have low durability.5 Consequently, replacing carbon-based supports with materials displaying excellent electrical conductivity and corrosion resistance under typical PEMFC operating conditions is crucial for improving system longevity.6 Transition-metal oxides are interesting candidates for support materials because they can exhibit the strong metal–support interaction (SMSI) effect with platinum. The SMSI effect describes variations in the chemisorption behavior of organic molecules on metals, where supports of variable oxidation states affect metal adhesion properties to alter the electronic structure of the metal.7 The strong adsorption properties gained by changing the electronic structure of the metal have been reported to account for the increased catalytic stability and activity.8,9Because of their extraordinary mechanical strength and chemical stability in extremely acidic or basic environments, metal oxides represent appealing support materials for electrode catalysts.10 Conductive or semi-conductive metal oxides such as Ti0.7Mo0.3O2, titanium–ruthenium oxide, Ta0.3Ti0.7O2, oxygen-deficient titanium dioxide (TiO2), indium tin oxide, antimony tin oxide, and TiO2/C have been investigated as suitable support materials.11–14 Because metal oxides and platinum nanoparticles have such a strong surface contact, the application of the former as support materials is expected to improve the stability and corrosion resistance of platinum catalysts. On account of its stability under typical fuel-cell operating conditions, low cost, commercial availability, lack of toxicity, and amenability to shape and structural alterations, TiO2 is regarded as a unique support material among these metal oxides.15 TiO2 is a well-known semiconductor with good stability and high abundance on earth. As a result, TiO2 has the potential to be used in energy conversion and storage systems.16 However, the sluggish charge mobility of TiO2 greatly reduces its overall performance. Niobium ion (Nb5+) is frequently used as the ideal dopant to modify the electrical characteristics of TiO2 in order to enhance electron transport. The Nb-doping presented two crucial justifications: (1) niobium(V) ethoxide has a 3.4 eV bandgap, which is very close to the TiO2 bandgap of 3.2 eV; (2) its comparable ionic radius (64 pm) to that of titanium (60.5 pm).
In previous studies, a variety of methods have been used to synthesize Nb-TiO2, including hydrothermal, sol–gel, ionic liquid microemulsion aided synthesis, and template-assisted multistep synthesis approaches.17–19 However, these methods generally suffer from low product yields and comprise multiple steps, potentially limiting reproducibility. Owing to their practicality, scalability, cost effectiveness, and minimal waste generation, aerosol-assisted techniques for producing hollow spherical nanoparticles have gained favor in recent years. The obtained nanomaterials possess a large number of active sites owing to their high specific surface area, homogeneous pore size, and large pore volume.20 These methods usually result in a range of nanostructured composites, which combine nanocrystalline host materials with carbon frameworks to drastically improve electrochemical performance. Guan et al. combined an aerosol-assisted process with the hot-press technique to establish a scalable route to a bio-inspired synthetic nanocomposite.21 In addition, Meng et al. devised an aerosol-assisted hydrothermal process for synthesizing zeolites, particularly Sn-beta zeolites.22 Furthermore, Poostforooshan et al. described a simple new method for preparing hollow mesoporous silica microspheres by spray-drying colloidal silica nanoparticles and polymethacrylate-based copolymer/surfactant nanosphere templates followed by calcination.23
In this work, in response to these eye-opening reports concerning TiO2 catalytic supports and the application of aerosol-assisted techniques,24 hollow mesoporous TiO2 nanoparticles with a large specific surface area were generated by aerosol-assisted self-assembly followed by annealing. As a synthetic technique, this gas-phase technology has several advantages over more conventional liquid-phase approaches, including simple operation, rapid particle formation, and the ability to continuously produce spherical particles.25 Because the dried samples departing the furnace were collected using membrane filters, no time-consuming separation procedures were necessary. Surprisingly, the aggregation of the formed nanoparticles could be minimized because each droplet can be regarded as an independent microreactor while passing through the furnace following atomization.26 These nanoparticles were then applied as a support for a platinum electrocatalyst. In addition, a niobium-doped TiO2 support with high electrical conductivity was prepared by a similar approach. The titanium and niobium sources were combined in a precursor solution containing cetyltrimethylammonium bromide (CTAB), and after the aerosol-assisted self-assembly the platinum was loaded by a hydrothermal process using ethylene glycol as a reducing agent. Finally, the electrocatalytic performance of the samples was evaluated.
2. Experimental
2.1. Catalyst preparation
Niobium-doped TiO2 nanoparticles (Nb-TiO2) were prepared by a similar procedure with the addition of niobium(V) ethoxide (1 mL) alongside TTIP, end up with a white product.
![[thin space (1/6-em)]](https://www.rsc.org/images/entities/char_2009.gif) 000 rpm, repeated washing with deionized water, and overnight (>8 h) drying at 80 °C in a vacuum oven. With the exception of reaction time, the samples such as Pt/Nb-TiO2-10 and Pt/Nb-TiO2-40 were prepared in an identical manner.
000 rpm, repeated washing with deionized water, and overnight (>8 h) drying at 80 °C in a vacuum oven. With the exception of reaction time, the samples such as Pt/Nb-TiO2-10 and Pt/Nb-TiO2-40 were prepared in an identical manner.2.2. Material characterization
The crystal structure and morphology of the nanoparticles were also examined by X-ray diffraction (XRD; D8 Advance, Bruker AXS, Germany) and transmission electron microscopy (TEM; Talos F200X, FEI, USA). The specific surface area was determined by the Brunauer–Emmett–Teller (BET) method and the pore structure was calculated by the Barrett–Joyner–Halenda (BJH) method using a surface analytical instrument (ASAP 2460, Micromeritics, USA) for N2 gas adsorption at 77 K. The surface structures were analyzed by Fourier-transform infrared (FT-IR) spectroscopy (Tensor 27, Bruker) and X-ray photoelectron spectroscopy (XPS) (ESCALAB 250Xi, Thermo Scientific). The titanium, niobium, and platinum contents were analyzed by inductively coupled plasma optical emission spectrometry (ICP-OES; 730 series, Agilent, USA). The particle size was determined using a particle size analyzer (Mastersizer 2000, Malvern, UK). The zeta potentials were recorded on a zeta potential analyzer (Zetasizer Nano ZS, Malvern, UK). The electrical conductivity of the powder samples was measured by the standard four-probe technique using a resistivity tester (FM100GH, YAOS, China) at 1 MPa. Electron paramagnetic resonance (EPR) spectra were recorded at 300 K using an EPR spectrometer (A300, Bruker).2.3. Electrochemical characterization
Cyclic voltammetry (CV) curves were recorded from +0.2 to −0.8 V (vs. RHE) in O2-saturated 0.1 M KOH solution at a scan rate of 50 mV s−1. The rotating disk electrode approach was used to acquire ORR polarization curves by linear sweep voltammetry (LSV) from +0.2 to −0.8 V in O2-saturated 0.1 M KOH solution at a scan rate of 10 mV s−1 and rotational speeds 1600 rpm. All current densities were normalized to the geometric surface area of the electrode.
The electrochemical surface area (ECSA) of platinum was calculated using the equation
| ECSA = QH/mc | (1) |
The kinetic current was calculated from the ORR polarization curves by the Koutecký–Levich equation:
 | (2) |
3. Results and discussion
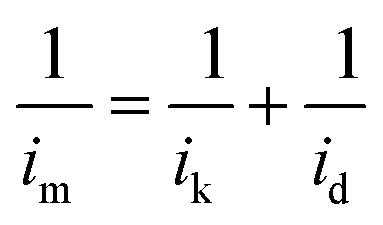
The morphologies of the TiO2 and Nb-TiO2 supports were first examined by TEM, as shown in Fig. 1(a) and (h), respectively. Both supports were composed of spherical particles (200–400 nm) alongside small amounts of irregular TiO2. This was in accordance with the results of dynamic light scattering, which revealed Z-average values of 369 nm for TiO2 and 247 nm for Nb-TiO2. The high-resolution TEM image presented in Fig. 1(b) indicates the presence of highly stacked TiO2 layers, which displayed a spotty selected-area electron diffraction (SAED) pattern as shown in Fig. 1(c), demonstrating that single-crystalline TiO2 was obtained as expected. The lattice fringes with a spacing of 0.352 nm for both samples corresponded to the TiO2 (101) crystal plane. The EDS elemental mapping images shown in Fig. 1(d)–(g) and (k)–(o) revealed homogeneous distributions of titanium, oxygen, and niobium (in the case of Nb-TiO2) across the TiO2 nanoparticles. In Fig. 1(i) and (j), a high-resolution TEM image of Nb-TiO2 and a corresponding SAED pattern are presented. The SAED pattern contained diffuse rings corresponding to amorphous phases, whereas Nb-TiO2 was produced from amorphous TiO2. No lattice spacings corresponding to the Nb2O5 crystal plane at 0.375 nm were detected, and the observed lattice spacing of 0.369 nm indicated the successful doping of TiO2 with niobium.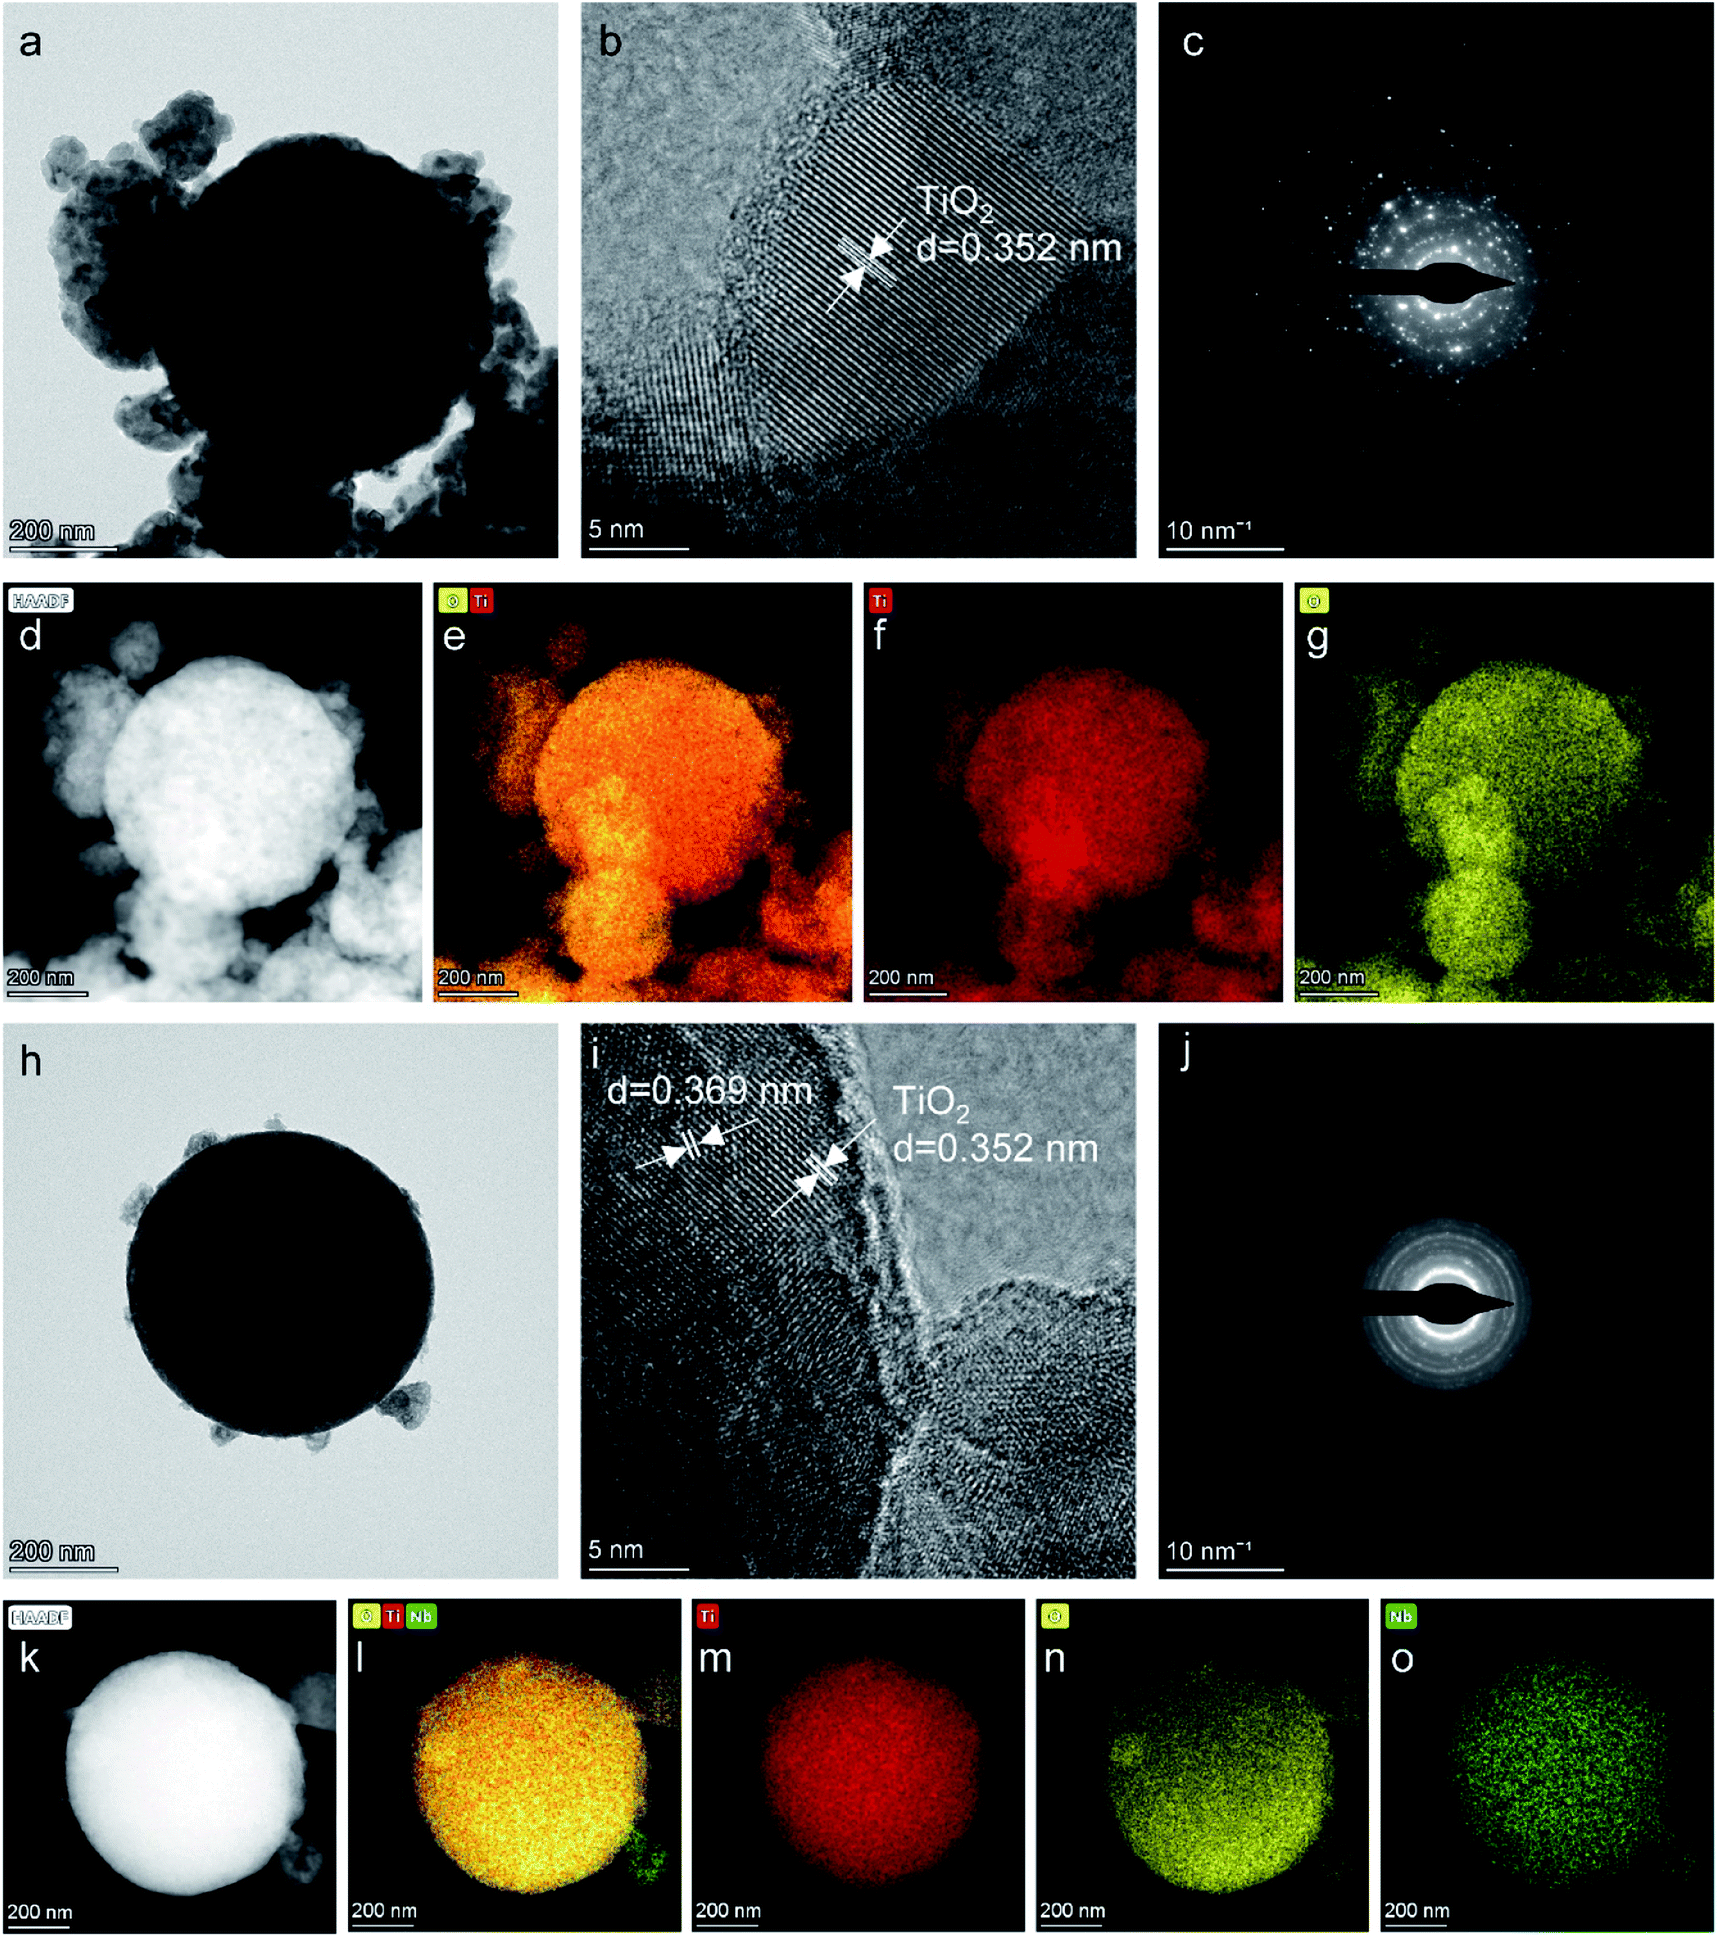 | ||
| Fig. 1 (a) Low-magnification and (b) high-resolution TEM images of TiO2. (c) SAED pattern of TiO2. (d)–(g) HAADF-STEM image of TiO2 and corresponding EDS elemental mapping images for titanium, oxygen, and an overlay of the two. (h) Low-magnification and (i) high-resolution TEM images of Nb-TiO2. (j) SAED pattern of Nb-TiO2. (k)–(o) HAADF-STEM image of Nb-TiO2 and corresponding EDS elemental mapping images for titanium, oxygen, niobium, and an overlay of the three. | ||
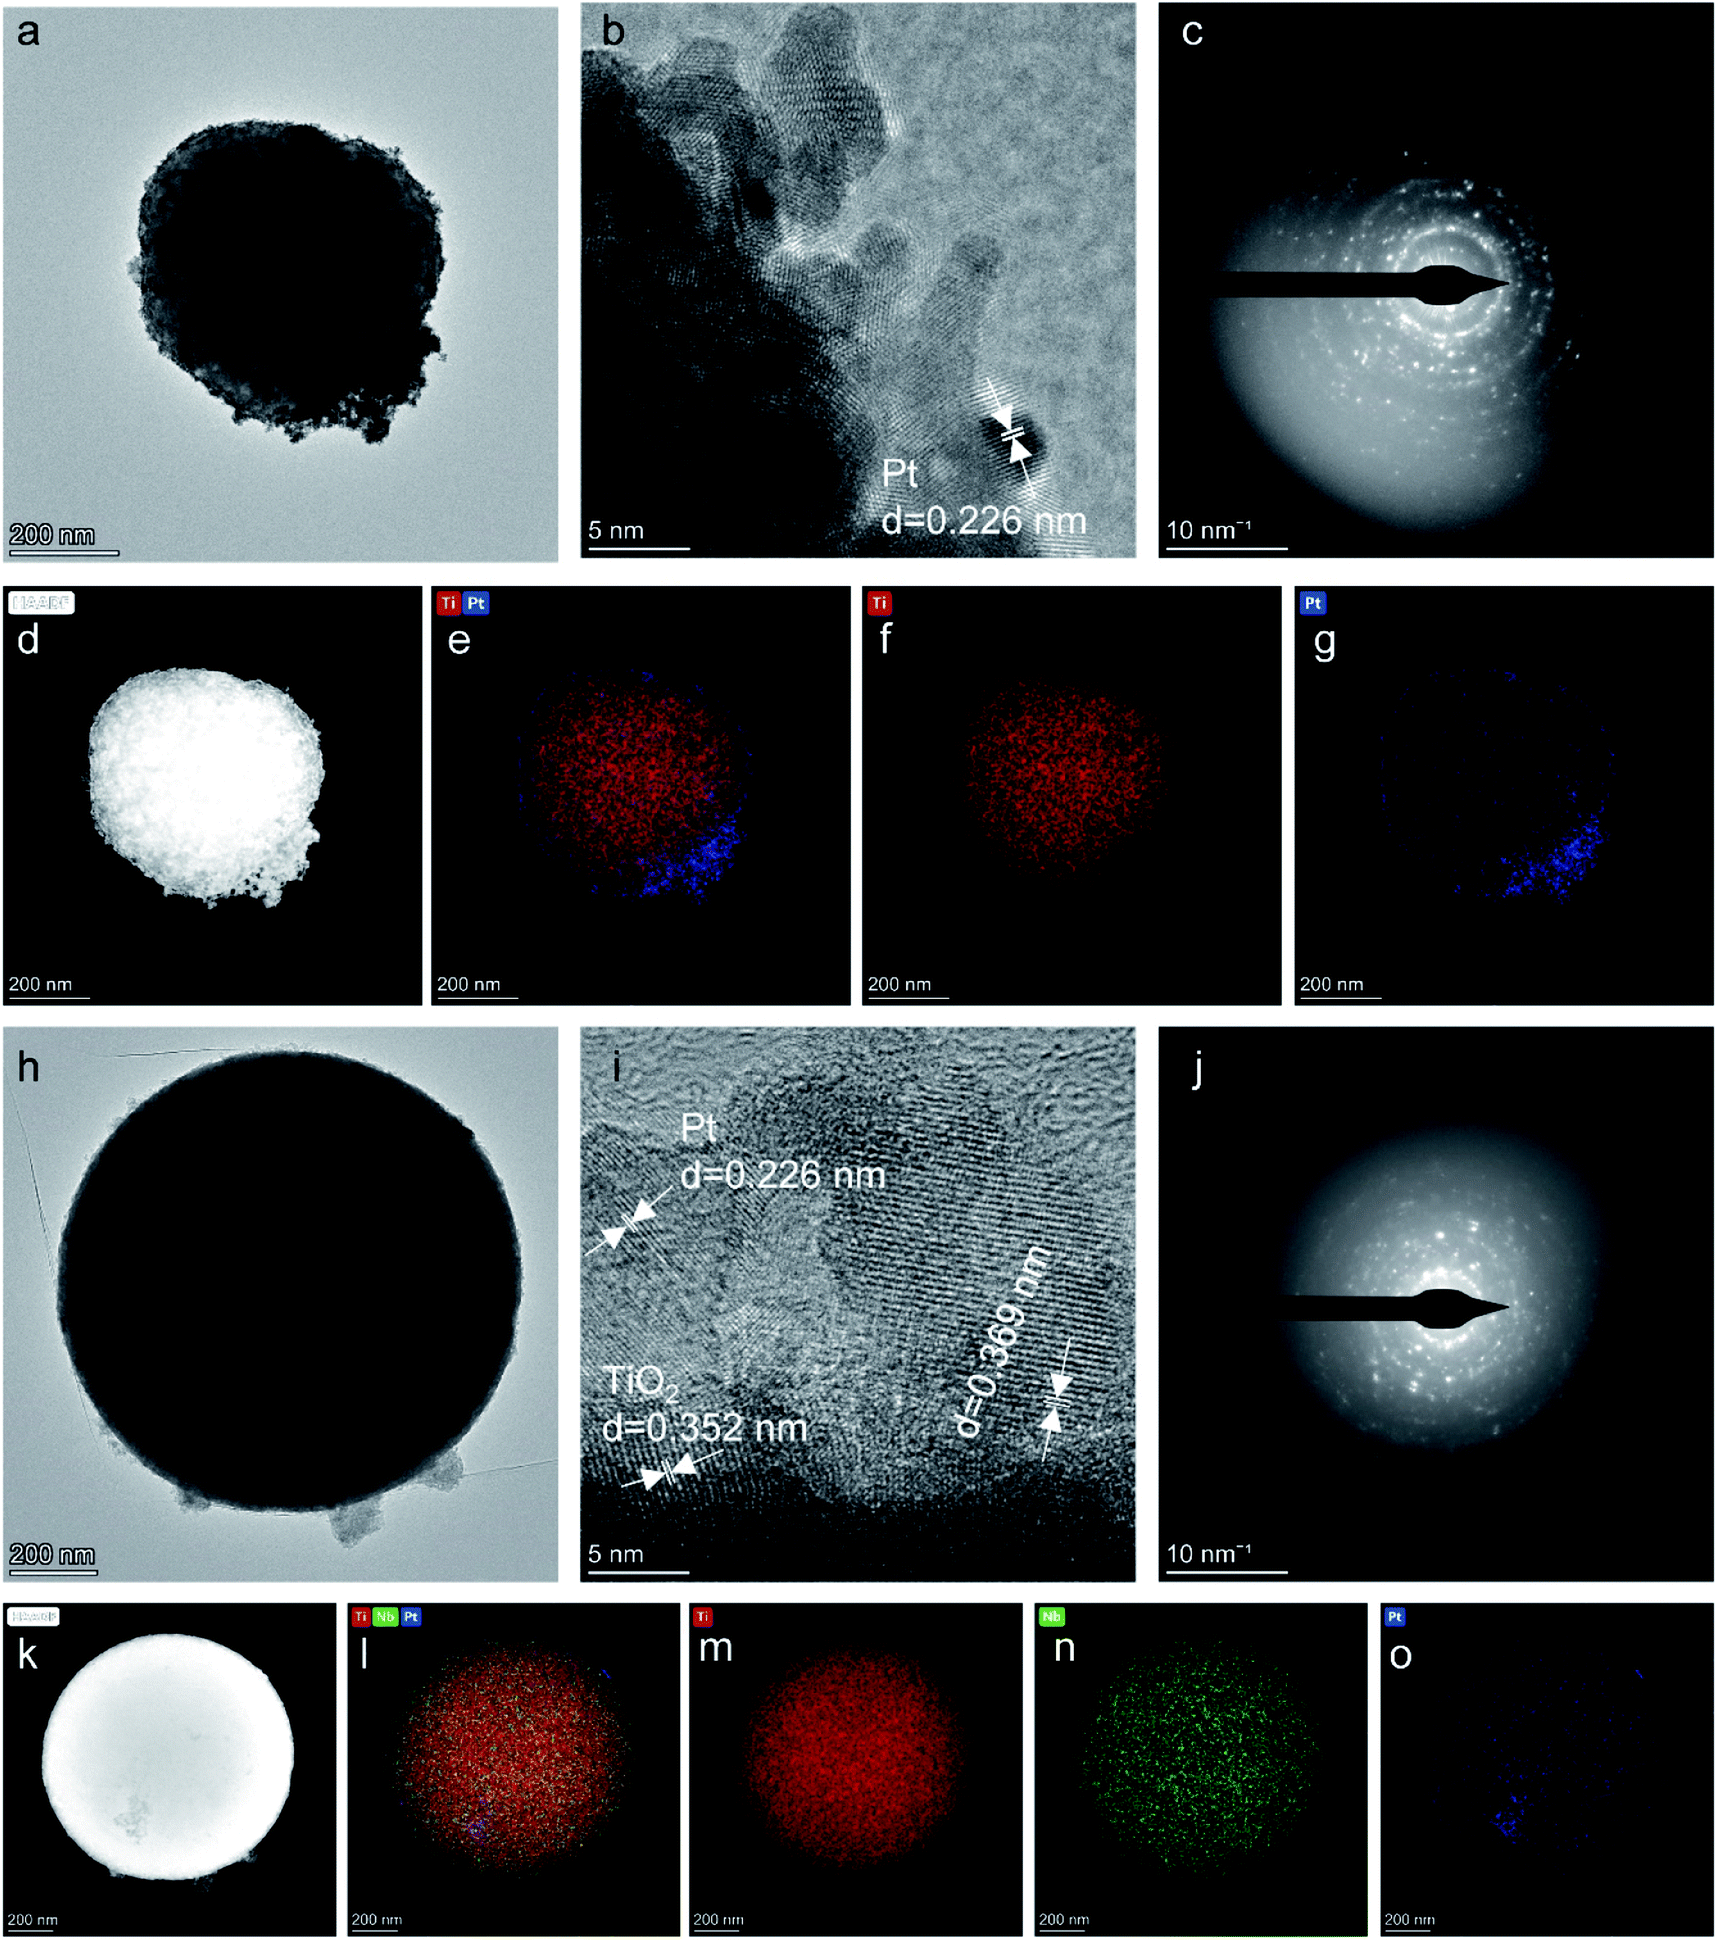
TEM images of the as-prepared Pt/TiO2 and Pt/Nb-TiO2 are shown in Fig. 2(a) and (h) to explore the influence of the morphology on the electrochemical performance. Fig. 2(g) and (o) reveal that each support was coated with a thin platinum layer, confirming that the platinum nanoparticles were evenly distributed across the support surface. This dispersion indicates good contact between the catalyst and support, allowing the supported catalyst to exhibit good electronic conductivity.28 This layer structure of the platinum nanoparticles was further demonstrated by the EDS line scanning profiles, as shown in Fig. 3. Furthermore, the elemental compositions were determined by ICP-OES, as summarized in Table 1. The high-resolution TEM images and corresponding SAED patterns are presented in Fig. 2(b), (c), (i), and (j), which confirmed the presence of coexisting crystalline phases. In addition to the TiO2(101) crystal plane, the lattice fringes with a spacing of 0.226 nm corresponded to platinum, confirming the successful anchoring of this element on the TiO2 support. The EDS mapping results revealed that titanium, oxygen, and niobium were homogeneously dispersed as shown in Fig. 2(d)–(f) and (k)–(n), whereas some aggregation was observed for platinum on Pt/TiO2 as shown in Fig. 2(g). In the case of Pt/Nb-TiO2, the aggregation of the platinum nanoparticles was limited and they were well attached to the support, as observed in Fig. 2(o).
 | ||
| Fig. 2 (a) Low-magnification and (b) high-resolution TEM images of Pt/TiO2. (c) SAED pattern of Pt/TiO2. (d)–(g) HAADF-STEM image of Pt/TiO2 and corresponding EDS elemental mapping images for titanium, platinum, and an overlay of the two. (h) Low-magnification and (i) high-resolution TEM images of Pt/Nb-TiO2. (j) SAED pattern of Pt/Nb-TiO2. (k)–(o) HAADF-STEM image of Pt/Nb-TiO2 and corresponding EDS elemental mapping images for titanium, niobium, platinum, and an overlay of the three. | ||
 | ||
| Fig. 3 (a and b) High-resolution TEM and (c) EDS line scanning profiles images of Pt/TiO2. (d and e) High-resolution TEM and (f) EDS line scanning profiles images of Pt/Nb-TiO2. | ||
| Sample | Elemental content (wt%) | ||
|---|---|---|---|
| Ti | Nb | Pt | |
| TiO2 | 58.04 | — | — |
| Nb-TiO2 | 38.96 | 18.39 | — |
| Pt/TiO2 | 40.16 | — | 22.77 |
| Pt/Nb-TiO2 | 31.36 | 14.19 | 21.99 |
Fig. 4 presents the nitrogen adsorption/desorption isotherms and pore size distribution curves calculated by the BJH technique for TiO2, Nb-TiO2, Pt/TiO2, and Pt/Nb-TiO2. According to the IUPAC classification scheme, the isotherm for TiO2, as shown in Fig. 4(a), was a combination of type-II and type-IV curves and was comparable to the isotherms previously reported for metallic aerogels.29 In contrast, the isotherm for Nb-TiO2 was a type-IV curve, featuring an apparent hysteresis loop with strong adsorption and desorption branches (capillary condensation step) at intermediate relative pressure, which can be ascribed to the presence of mesopores in this sample. The H2 hysteresis loop indicated the presence of ink-bottle-like pores with narrow necks and broader bodies, while also demonstrating the presence of mesopores (2–50 nm). This is supported by the pore size distribution curve, which indicated that the pore size for the Nb-TiO2 support was centered at 6.48 nm, as shown in Fig. 4(d) and Table 2. The distribution of the pore diameter of TiO2 at 21.04 differed from Nb-TiO2 in Fig. 4(d) and Table 2. The detailed pore and surface area characteristics for all samples are reported in Table 2. These findings suggest that niobium doping favors the production of homogeneous mesopores while inhibiting the formation of larger mesopores, which is in accordance with the isotherm results. The specific surface area and pore volume increased upon niobium incorporation, with the former displaying values of 9.65 and 60.00 m2 g−1 for TiO2 and Nb-TiO2, respectively.
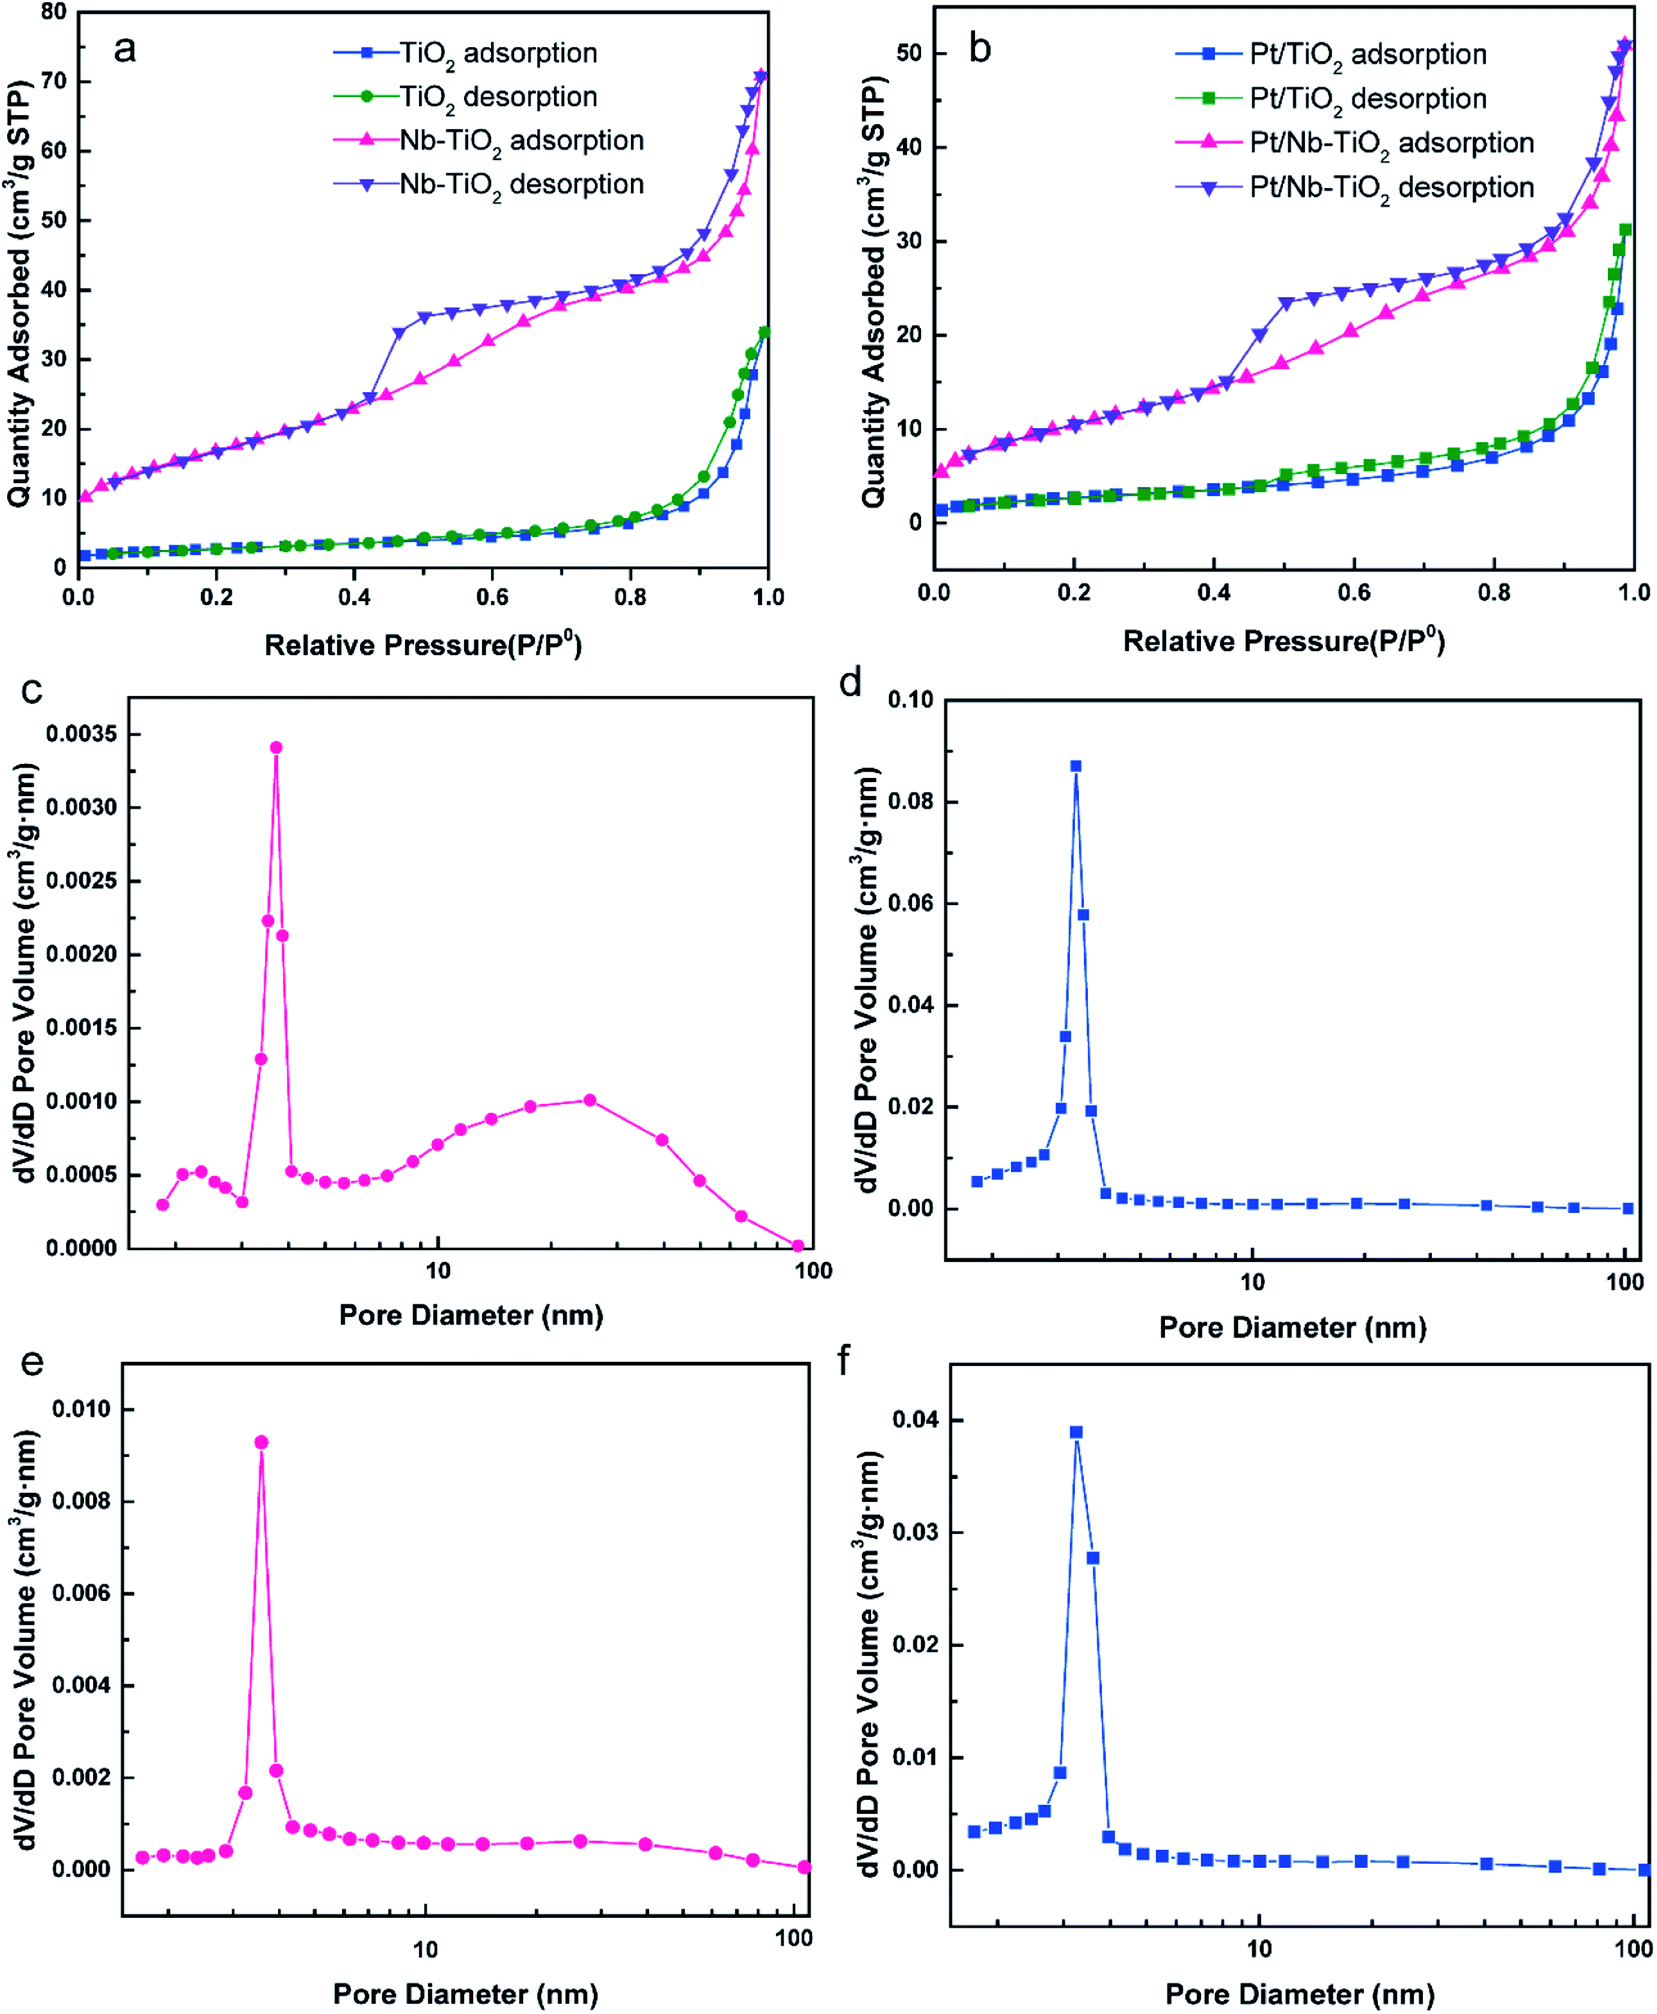 | ||
| Fig. 4 (a) N2 adsorption/desorption isotherms for TiO2 and Nb-TiO2. (b) N2 adsorption/desorption isotherms for Pt/TiO2 and Pt/Nb-TiO2. (c)–(f) Pore size distributions for (c) TiO2, (d) Nb-TiO2, (e) Pt/TiO2, and (f) Pt/Nb-TiO2. | ||
| Sample | Surface area (m2 g−1) | Pore diameter (nm) | Pore volume (cm3 g−1) |
|---|---|---|---|
| TiO2 | 9.65 | 21.04 | 0.052 |
| Nb-TiO2 | 60.00 | 6.48 | 0.11 |
| Pt/TiO2 | 9.54 | 18.44 | 0.048 |
| Pt/Nb-TiO2 | 37.52 | 7.80 | 0.078 |
Fig. 4(b), (e), and (f) show the corresponding nitrogen adsorption/desorption isotherms and pore size distribution curves for Pt/TiO2 and Pt/Nb-TiO2. The isotherms displayed a similar trend to those of the samples prior to loading with platinum, although the specific surface area of the undoped TiO2 remained essentially unaltered upon platinum loading whereas that of Nb-TiO2 decreased dramatically, indicating that the platinum entered the Nb-TiO2 channels to afford a large number of active sites. The minimal change in the pore size distribution suggested that the porous structure was not markedly obstructed and that the platinum would be able to exhibit high electrocatalytic activity.
The XRD patterns of the samples were used to analyze their crystal structures, and the results are presented in Fig. 5(a). The sharp and intense diffraction peaks detected for TiO2 indicate a highly crystalline structure, in accordance with the sharp lattice fringes observed by TEM. The typical diffraction pattern shown in Fig. 5(a) is in good agreement with the reference data for anatase (JCPDS: 99-0008) and rutile (JCPDS: 76-0649), the two naturally occurring phases of TiO2. The diffraction peaks (2θ) at 25.30°, 37.79°, 48.04°, 53.88°, 55.06°, 62.68°, 68.75°, 70.29°, 75.04°, and 82.67° correspond to the (101), (004), (200), (105), (211), (204), (116), (220), (215), and (224) crystal planes of anatase, while those at 27.44°, 36.08°, 41.24°, 54.32°, 56.63°, 62.75°, 64.06°, 69.01°, 76.53°, and 82.35° were indexed to the (110), (101), (111), (211), (220), (002), (310), (301), (202), and (321) crystal planes of rutile, respectively.
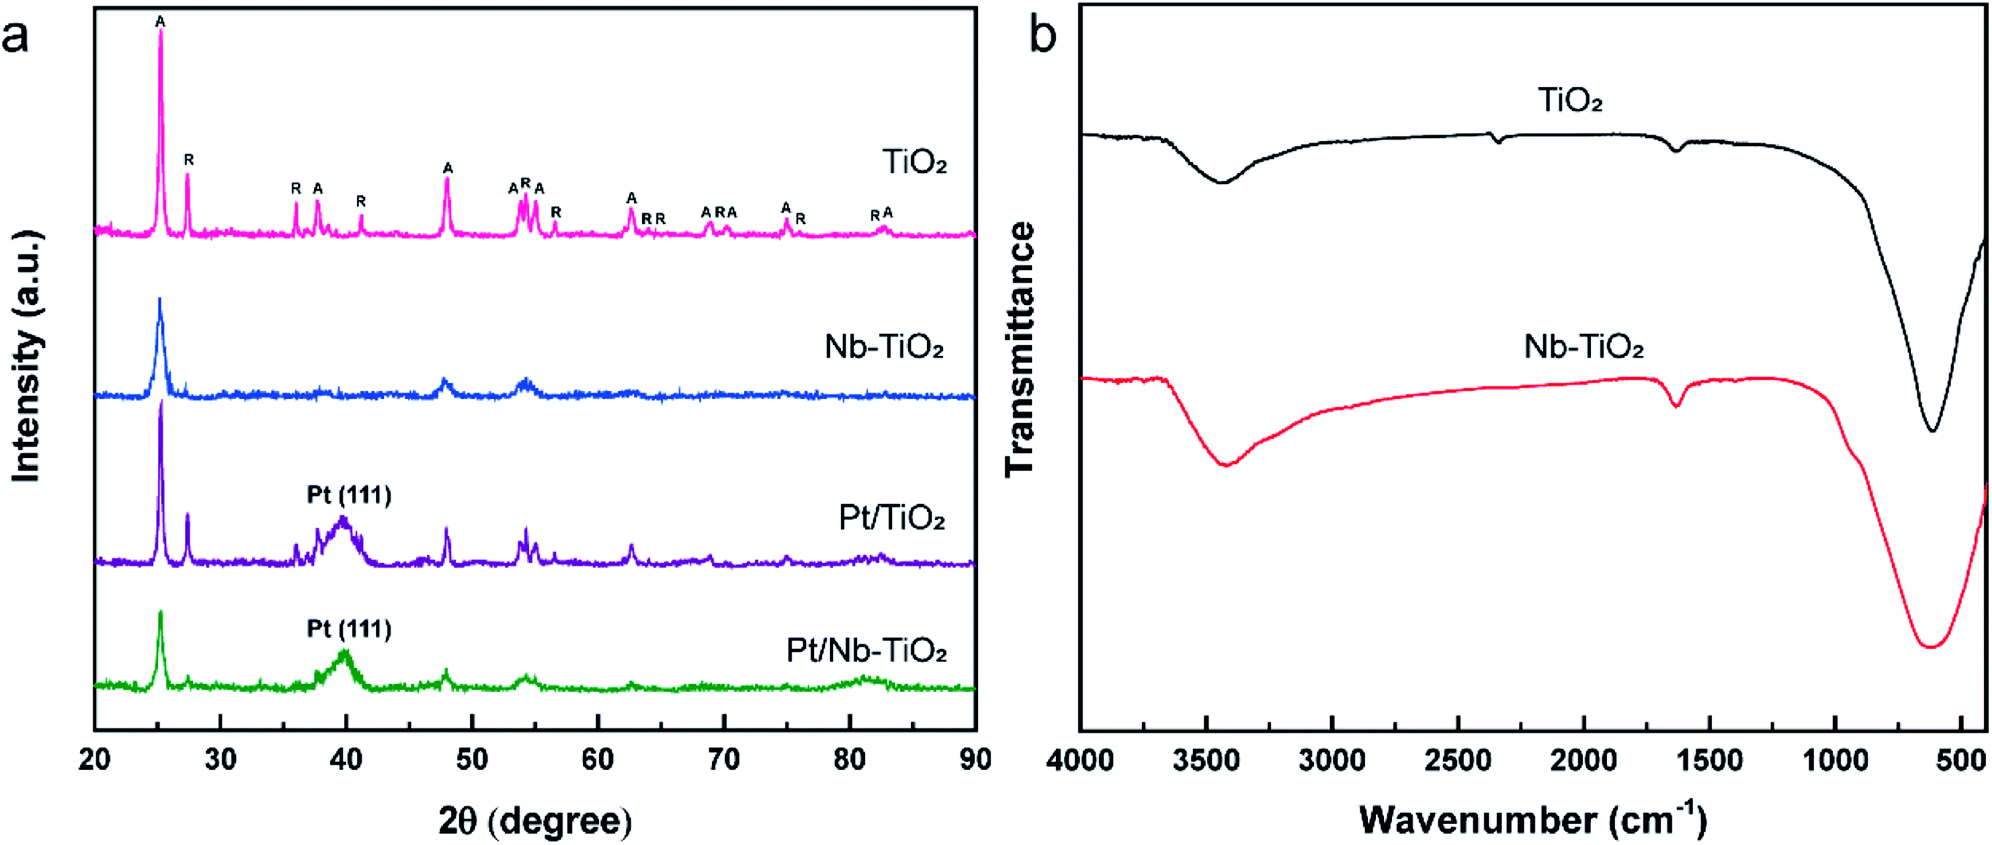 | ||
| Fig. 5 (a) XRD patterns of TiO2, Nb-TiO2, Pt/TiO2, and Pt/Nb-TiO2. The peaks labeled A and R were indexed to the anatase and rutile phases of TiO2, respectively. (b) FT-IR spectra of TiO2 and Nb-TiO2. | ||
No diffraction peaks corresponding to niobium were detected for Nb-TiO2, although the identification of such peaks was expected to be difficult owing to the weak crystallinity of Nb2O5. However, the observed diffraction peaks were noticeably wider than those of undoped TiO2, indicating the incorporation of niobium into the titania lattice to generate disordered Nb-TiO2. This is in accordance with the SAED pattern shown in Fig. 1(j), where niobium species were equally distributed throughout the support to afford diffuse rings corresponding to amorphous phases, while the lattice spacing of 0.369 nm observed by TEM was greater than that of 0.352 nm for pure TiO2, as shown in Fig. 1(i). Because the ionic radius of Nb5+ (64 pm) is larger than that of Ti4+ (60.5 pm), the lattice expansion was ascribed to the substitution of the titanium ions in TiO2 with niobium ions.30 Finally, the diffraction peaks at 39.79° for Pt/TiO2 and Pt/Nb-TiO2 were indexed to the Pt(111) crystal plane (JCPDS: 87-0646), indicating the successful loading of platinum in accordance with the EDS results shown in Fig. 3.
The FT-IR spectra of TiO2 and Nb-TiO2 are presented in Fig. 5(b). Both samples exhibited a broad absorption band at approximately 3400 cm−1 corresponding to the stretching vibrations of water molecules physically adsorbed on the TiO2 surface, in addition to an intense band at approximately 640 cm−1 that was ascribed to Ti–O–Ti and Ti–O stretching vibrations. The weak band at approximately 1634 cm−1 was assigned to the bending vibrations of the surface-bound water molecules.31
XPS was applied to evaluate the elemental composition and chemical states of the surface atoms in TiO2, Nb-TiO2, Pt/TiO2, and Pt/Nb-TiO2, using the carbon 1s peak at 284.8 eV as a reference. As shown in Fig. 6(a), the XPS survey spectra for TiO2 and Nb-TiO2 confirmed the presence of titanium, oxygen, and niobium (in the case of Nb-TiO2), while Pt/TiO2 and Pt/Nb-TiO2 displayed an additional peak corresponding to platinum, which is in good agreement with the EDS results. As shown in Fig. 6(b) and (c), narrow-scan XPS spectra further confirmed the successful doping with niobium and loading with platinum.
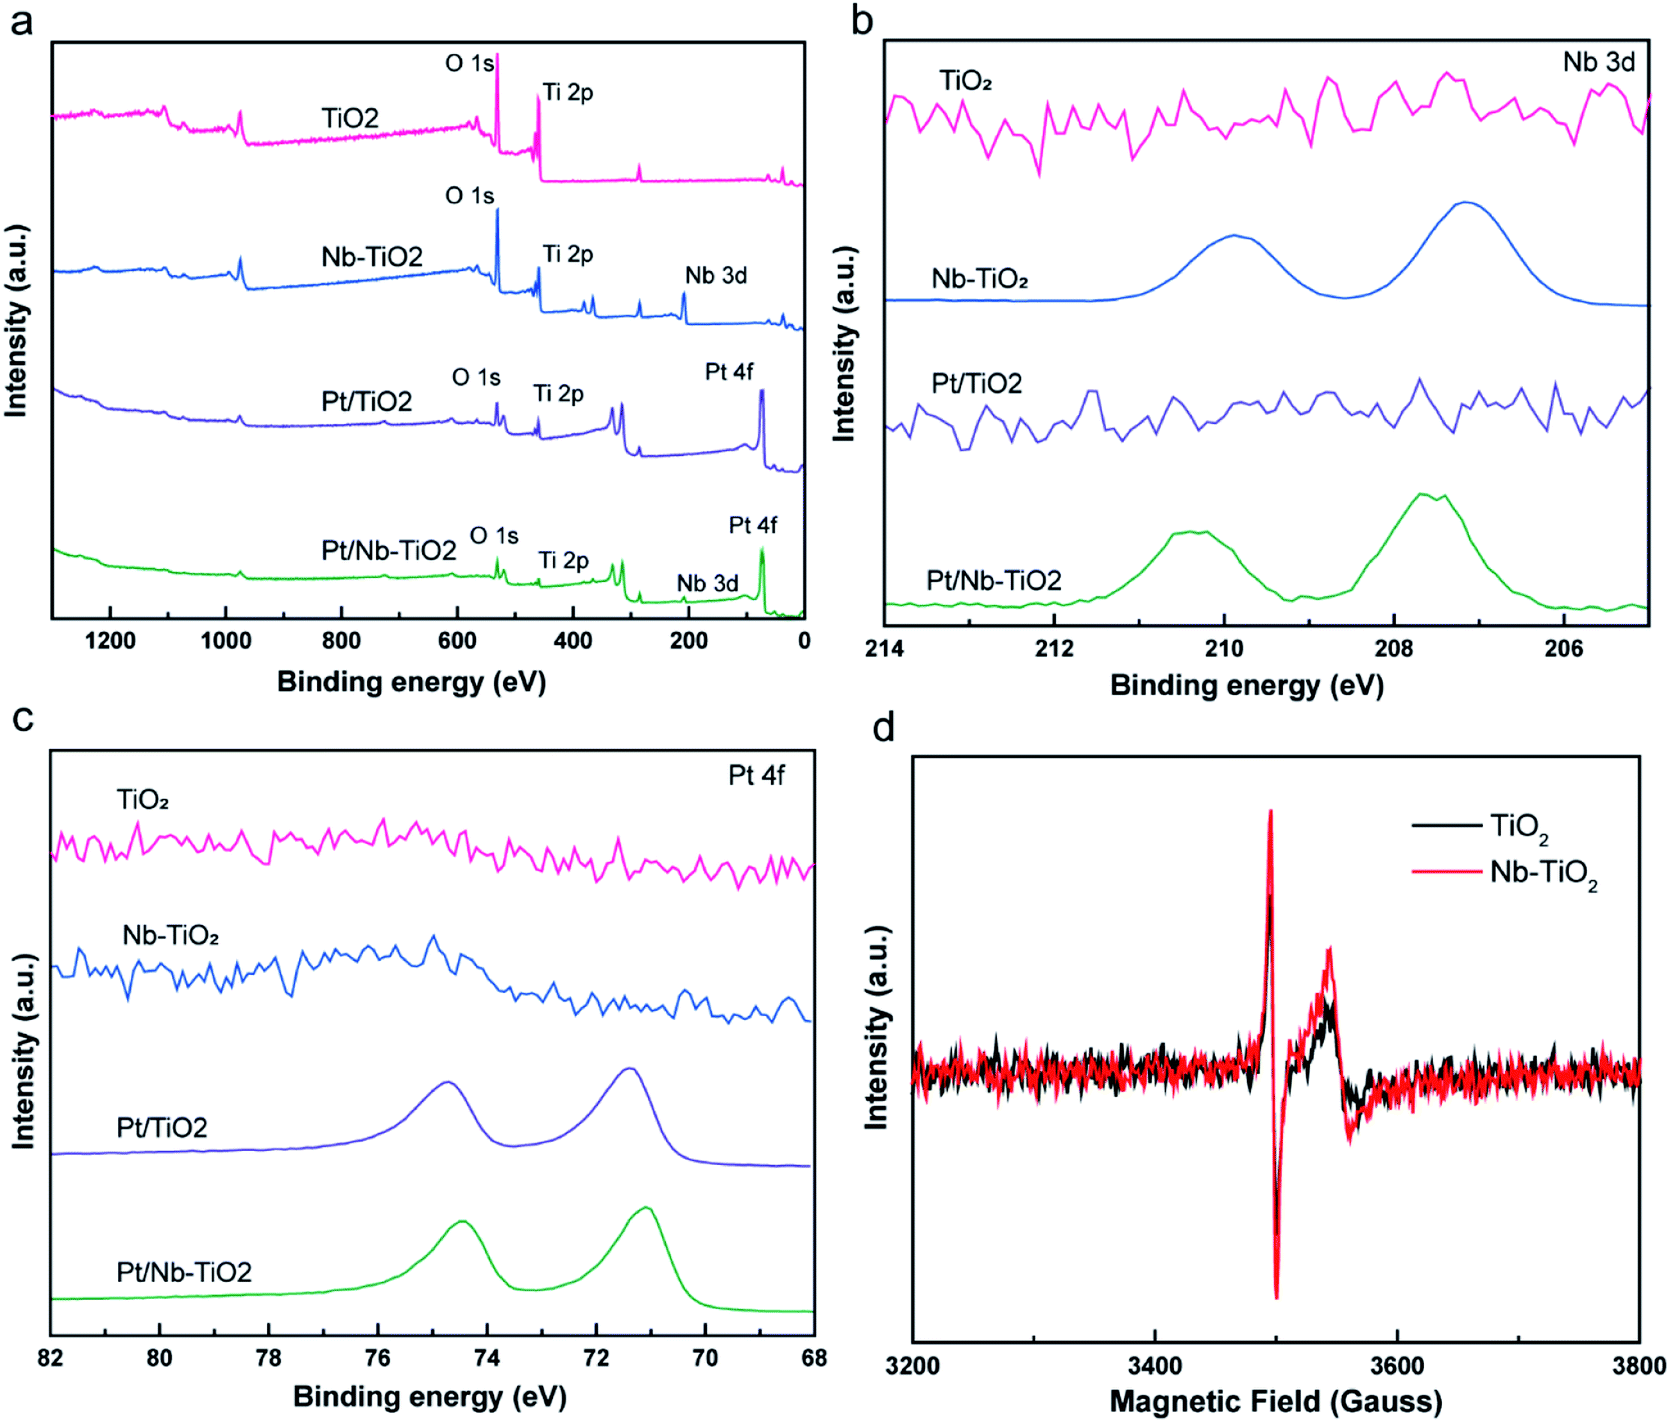 | ||
| Fig. 6 (a) XPS survey spectra, (b) niobium 3d XPS spectra, (c) platinum 4f XPS spectra for all samples and (d) EPR spectra of TiO2 and Nb-TiO2. | ||
As shown in Fig. 7(a), the high-resolution titanium 2p spectrum of TiO2 could be deconvolved into two peaks with binding energies of approximately 464.2 and 458.5 eV and an energy separation of 5.7 eV, confirming a valence state of +4 for the titanium ions in the support.32 The corresponding binding energies for Nb-TiO2 were 464.5 and 458.9 eV, respectively. The substitution of niobium into the TiO2 lattice may lead to a synergistic effect with oxygen vacancies, causing an electron structural change between the conduction and valence bands. Thus, the partially replaced titanium and combined effects of niobium ions and oxygen vacancies may account for the shift of the peaks in the titanium 2p spectra toward higher binding energies. Furthermore, EPR spectroscopy was employed to confirm the presence of oxygen vacancies. As shown in Fig. 6(d), strong single-electron peaks were observed as expected.33 Nb-TiO2 afforded a characteristic EPR signal with high intensity at a g value of 2.003, corresponding to bridging oxygen vacancies (Ti4+–O–O˙).34 The EPR signal was slightly enhanced upon niobium incorporation.
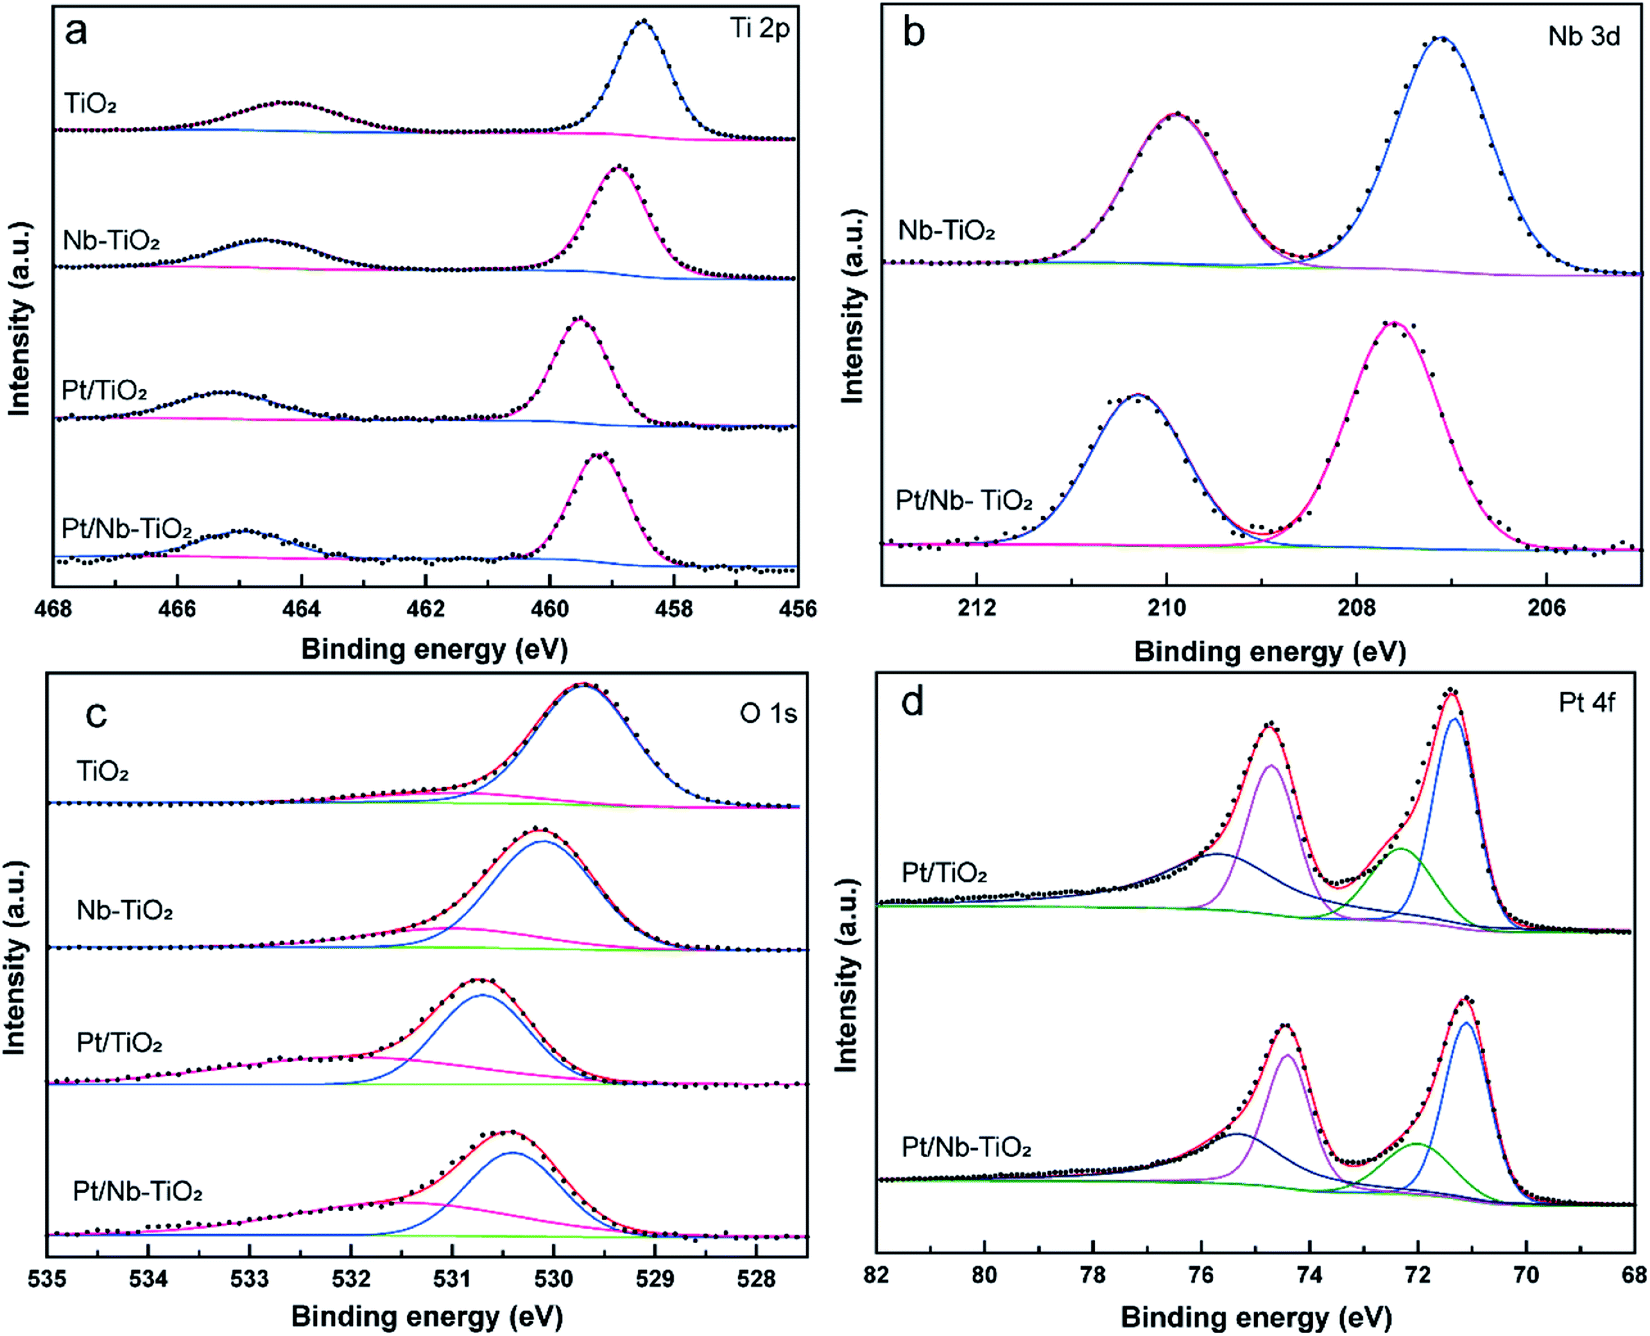 | ||
| Fig. 7 High-resolution XPS spectra of TiO2, Nb-TiO2, Pt/TiO2, and Pt/Nb-TiO2: (a) titanium 2p, (b) niobium 3d, (c) oxygen 1s, and (d) platinum 4f. | ||
As shown in Fig. 7(b), the high-resolution niobium 3d5/2 and 3d3/2 spectrum of Nb-TiO2 displayed peaks at 207.1 and 209.9 eV, which is in good agreement with previously published spectra for the Nb5+ valence state in niobium-doped TiO2.35 Niobium doping is known to increase electronic conductivity, which was anticipated to be advantageous for the electrochemical performance of Pt/Nb-TiO2 in this study. The electronic conductivity of the Nb-TiO2 nanoparticles was estimated to be approximately 9.85 × 10⁻⁵ S m−1 using the conventional four-probe technique, which was higher than that of the undoped TiO2 nanoparticles (3.48 × 10⁻⁵ S m−1), confirming that the niobium doping enhanced the conductivity. FBecause of this activation of the dispersed metal, this type of metal–support interaction can alter the electrical and catalytic properties of the catalytic centers, which is critical for an efficient electrocatalytic system. Consequently, the platinum metal in contact with the Ni–TiO2 support can be converted to a more active phase with enhanced charge transfer, resulting in greater catalytic activity.36
Deconvolution of the high-resolution oxygen 1s spectrum of TiO2 revealed a dominant peak at 529.7 eV and a secondary peak at 531 eV, which were assigned to Ti–O bonds and surface O–H bonds, respectively, as shown in Fig. 7(c).37 Furthermore, the oxygen 1s peaks of Nb-TiO2 shifted to higher binding energies compared with TiO2, indicating that the doped sample contained oxygen vacancies and niobium substitution in the TiO2 lattice, resulting in increased conductivity. The peaks for Pt/Nb-TiO2 also shifted to higher binding energies than those for pure TiO2, indicating strong interactions between the components of the Pt/Nb-TiO2 ternary system and improved electron transport.
As shown in Fig. 7(d), the high-resolution platinum 4f spectra were deconvolved into two doublets corresponding to Pt0 and Pt2+ species. The strong platinum 4f peaks were highly correlated with platinum in its zero-valent state. The Pt0 4f7/2 binding energies were 71.32 eV for Pt/TiO2 and 71.1 eV for Pt/Nb-TiO2. This decrease in binding energy of 0.22 eV upon niobium incorporation indicates the occurrence of electron donation from the Nb-TiO2 to the platinum, resulting in a local increase in the electron density on platinum, i.e., reduction of the platinum on the surface. This shift toward lower binding energies has also been observed in other support systems, implying that the niobium doping of TiO2 can alter the electronic structure of platinum atoms as a result of the SMSI effect,38 leading to a kinetic enhancement of the ORR due to the positive influence of the substrate.
To evaluate the electrocatalytic performance of the as-obtained Pt/Nb-TiO2 in the ORR, catalysts with and without niobium doping were prepared with different hydrothermal reaction times of 10 or 40 min, which are referred to hereinafter as Pt/TiO2-10, Pt/TiO2-40, Pt/Nb-TiO2-10, and Pt/Nb-TiO2-40. The ORR performance of the repared catalysts was investigated by CV and LSV. The ORR polarization curves were recorded in O2-saturated 0.1 M KOH solution with a scan rate of 10 mV s−1 and a rotational speed of 1600 rpm. The cyclic voltammograms were obtained at a scan rate of 50 mV s−1 in the same electrolyte to determine the ECSA of platinum based on hydrogen adsorption/desorption.39 The ORR polarization and CV curves are presented in Fig. 8(a) and (b). As demonstrated in Fig. 8(b), the hydrogen adsorption/desorption peak area in the CV curves steadily decreased with voltage cycles, indicating a reduction in the ECSA of platinum.40 The results indicated that Pt/Nb-TiO2-10 possessed the optimal electrochemical properties. Therefore, this catalyst was next compared to commercial Pt/C, as shown in Fig. 8(c) and (e). The Pt/Nb-TiO2-10 sample, but not Pt/C, exhibited a large Faradaic region, which may have been attributable to the SMSI of metal-oxide supported catalysts.41
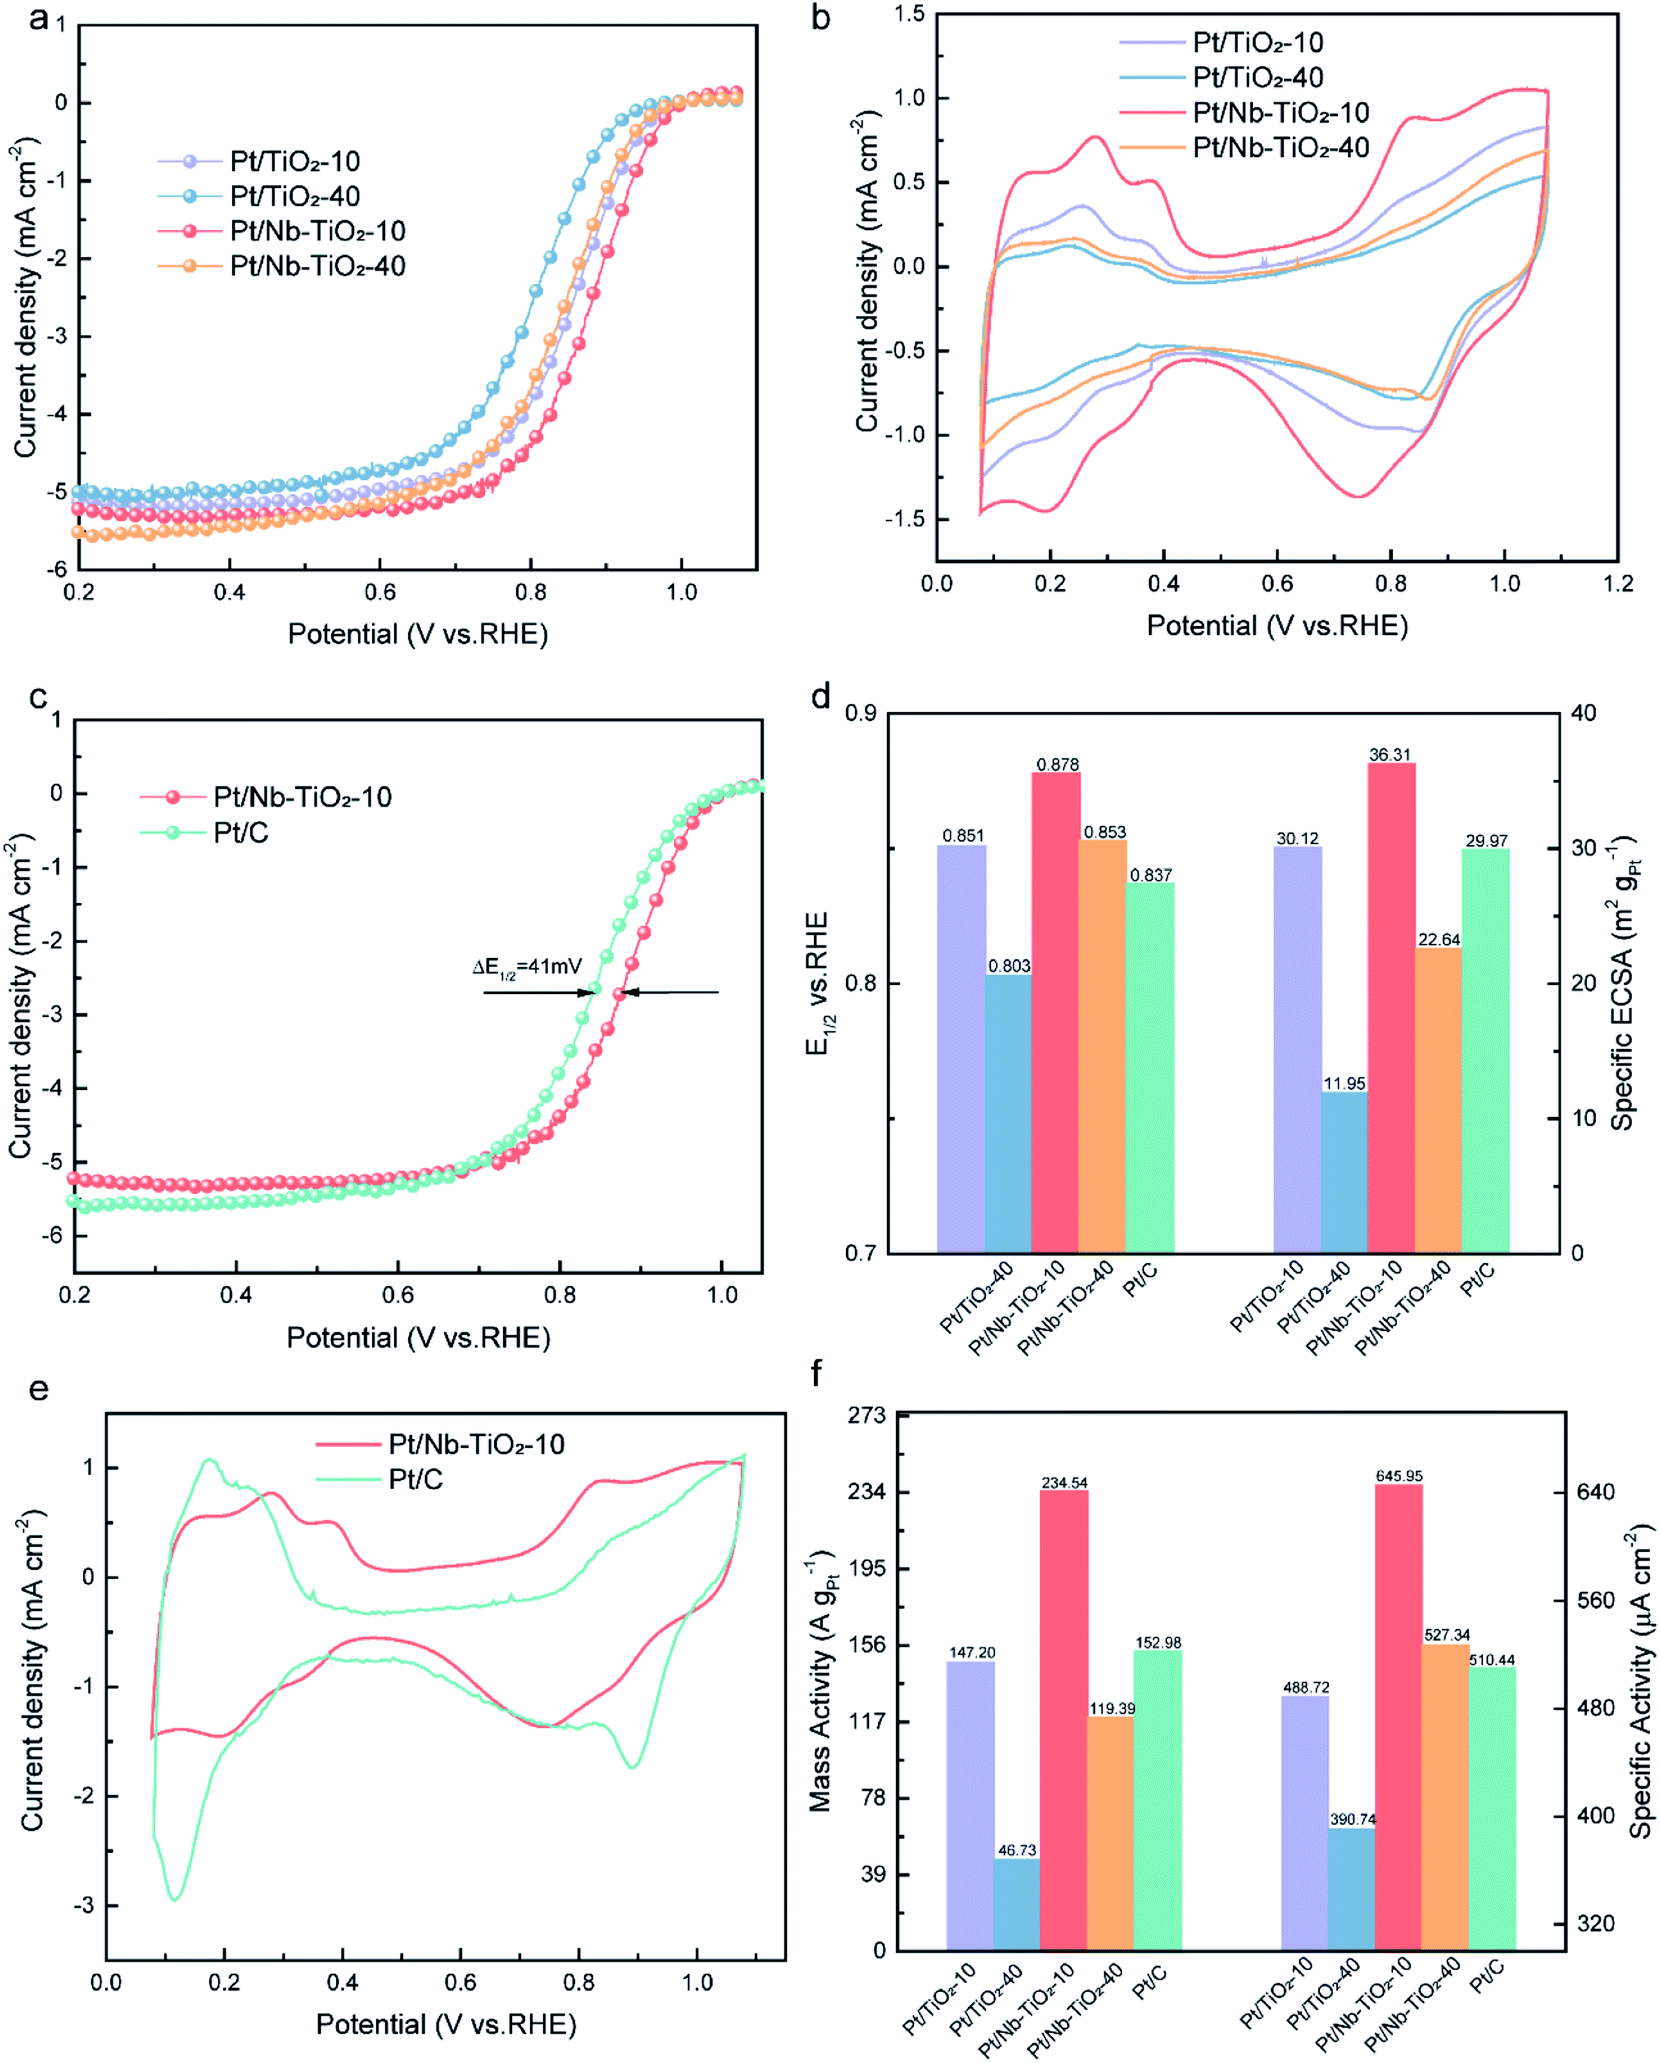 | ||
| Fig. 8 (a) ORR polarization curves and (b) CV curves for Pt/TiO2-10, Pt/TiO2-40, Pt/Nb-TiO2-10, and Pt/Nb-TiO2-40 in O2-saturated 0.1 M KOH electrolyte at a scan rate of 10 mV s−1 with a rotational speed of 1600 rpm. (c) ORR polarization curves for Pt/C and Pt/Nb-TiO2-10. (d) Comparison of the E1/2 and ECSA values for Pt/TiO2-10, Pt/TiO2-40, Pt/Nb-TiO2-10, Pt/Nb-TiO2-40, and Pt/C. (e) CV curves for Pt/C and Pt/Nb-TiO2-10. (f) Comparison of the mass activities and specific activities at 0.85 V. | ||
As shown in Fig. 8(c) and (d), the half-wave potential (E1/2) of Pt/TiO2-10 was measured to be 0.851 V vs. RHE. Upon extending the hydrothermal reaction time to 40 min, E1/2 decreased to 0.803 V. The activity of the platinum nanoparticles thus decreased with increasing hydrothermal reaction time as a result of particle expansion and agglomeration. Following niobium doping, Pt/Nb-TiO2-10 displayed an E1/2 of 0.878 V, which surpassed that of Pt/C (0.837 V, ΔE = 0.41 mV). SMSI effect show that the incorporation of niobium can enhance the ORR activity, which is consistent with prior findings.42 In addition, the ECSA of platinum was found to be markedly greater for Pt/Nb-TiO2-10 (36.31 m2 g−1) than for the Pt/C catalyst (29.97 m2 g−1), which was ascribed to the small size and efficient dispersion of the platinum catalyst on the porous Nb-TiO2-10 support. These findings suggested that Pt/Nb-TiO2 would exhibit outstanding ORR activity. Indeed, as shown in Fig. 8(f), the mass activity of Pt/Nb-TiO2-10 (234.54 A gPt−1 at 0.85 V) was found to greatly exceed that of Pt/C (152.98 A gPt−1 at 0.85 V), and the former also displayed a superior specific activity (645.95 μA cm−1) compared with Pt/C (510.44 μA cm−1).
The obtained results demonstrate that niobium addition can improve the electrocatalytic efficiency of Pt/Nb-TiO2 catalysts because the distributed platinum, niobium, and titanium can promote the SMSI effect and act synergistically to regulate the ORR activity. Thus, the Pt/Nb-TiO2 catalyst outperformed a commercial Pt/C catalyst in mediating the ORR, which can be attributed to the advantages of the Pt/Nb-TiO2 support over conventional carbon black supports, such as the electronic structure change of platinum due to synergistic interactions with the Pt/Nb-TiO2 support.
4. Conclusions
The results described in this work demonstrate the successful application of an aerosol-assisted method to prepare a non-carbon electrocatalyst support. The obtained findings are consistent with previous research indicating that niobium doping can improve electrical conductivity and enhance the SMSI effect. When comparing our results to those of previous studies in Table 3, our work achieved the excellent mass activity. Furthermore, it is important to note that the aerosol-assisted approach has the advantages of reproducibility, simplicity, and high efficiency. These findings have some significant implications, but they also have certain limitations. Although samples prepared in this manner are resistant to agglomeration, the particle size distribution is not uniform owing to the inability of current aerosol-based technology to precisely control the diameter of each droplet. Consequently, further work is required to construct improved systems in which the aperture and particle size can be carefully regulated. Exploring the underlying mechanisms of aerosol-assisted technology to enable tuning of the structure of the target product by adjusting the composition and ratio of the precursor solution is an important direction for the future.Author contributions
Xin Fu: writing – original draft. Ruisong Li: investigation, conceptualization. Yucang Zhang: conceptualization, methodology, investigation, writing – original draft, writing – review & editing.Conflicts of interest
There are no conflicts to declare.Acknowledgements
This work was supported by the National Natural Science Foundation of China (Grant No. 21978059).References
- N. Sazali, W. N. Wan Salleh, A. S. Jamaludin and M. N. Mhd Razali, Membranes, 2020, 10, 99 CrossRef CAS PubMed
.
- J. Yang, X. Zhang, C. Wang, P. Sun, L. Wang, B. Xia and Y. Liu, Solid State Sci., 2012, 14, 139–144 CrossRef CAS
- S. Ott, A. Orfanidi, H. Schmies, B. Anke, H. N. Nong, J. Hübner, U. Gernert, M. Gliech, M. Lerch and P. Strasser, Nat. Mater., 2020, 19, 77–85 CrossRef CAS PubMed
- L. Yang, J. Shui, L. Du, Y. Shao, J. Liu, L. Dai and Z. Hu, Adv. Mater., 2019, 31, 1804799 CrossRef PubMed
- X. Tian, X. Zhao, Y.-Q. Su, L. Wang, H. Wang, D. Dang, B. Chi, H. Liu, E. J. Hensen and X. W. Lou, Science, 2019, 366, 850–856 CrossRef CAS PubMed
- Q. Li, H. Peng, Y. Wang, L. Xiao, J. Lu and L. Zhuang, Angew. Chem., 2019, 131, 1456–1460 Search PubMed
- D. Banham, J. Y. Choi, T. Kishimoto and S. Ye, Adv. Mater., 2019, 31, 1804846 CrossRef PubMed
- H. Yang, X. Chen, W.-T. Chen, Q. Wang, N. C. Cuello, A. Nafady, A. M. Al-Enizi, G. I. Waterhouse, G. A. Goenaga and T. A. Zawodzinski, ACS Nano, 2019, 13, 8087–8098 CrossRef CAS PubMed
- J. Liang, N. Li, Z. Zhao, L. Ma, X. Wang, S. Li, X. Liu, T. Wang, Y. Du and G. Lu, Angew. Chem., Int. Ed., 2019, 58, 15471–15477 CrossRef CAS PubMed
- S. L. Gojković, B. M. Babić, V. R. Radmilovíć and N. V. Krstajić, J. Electroanal. Chem., 2010, 639, 161–166 CrossRef
- Y. O. Ibrahim, A. Hezam, T. Qahtan, A. Al-Aswad, M. Gondal and Q. Drmosh, Appl. Surf. Sci., 2020, 534, 147578 CrossRef CAS
- A. Meng, L. Zhang, B. Cheng and J. Yu, ACS Appl. Mater. Interfaces, 2018, 11, 5581–5589 CrossRef PubMed
- N. Zhang, S. Liu, X. Fu and Y.-J. Xu, J. Phys. Chem. C, 2011, 115, 9136–9145 CrossRef CAS
- S. Hejazi, S. Mohajernia, B. Osuagwu, G. Zoppellaro, P. Andryskova, O. Tomanec, S. Kment, R. Zbořil and P. Schmuki, Adv. Mater., 2020, 32, 1908505 CrossRef CAS PubMed
- K.-W. Park and K.-S. Seol, Electrochem. Commun., 2007, 9, 2256–2260 CrossRef CAS
- X. Wang, L. Zhang, Y. Bu and W. Sun, Appl. Surf. Sci., 2021, 540, 148357 CrossRef CAS
- B. Mei, M. D. Sánchez, T. Reinecke, S. Kaluza, W. Xia and M. Muhler, J. Mater. Chem., 2011, 21, 11781–11790 RSC
- D. Macwan, P. N. Dave and S. Chaturvedi, J. Mater. Sci., 2011, 46, 3669–3686 CrossRef CAS
- L. Wang, Y. Cai, L. Song, W. Nie, Y. Zhou and P. Chen, Colloids Surf., A, 2014, 461, 195–201 CrossRef CAS
- D. Ziental, B. Czarczynska-Goslinska, D. T. Mlynarczyk, A. Glowacka-Sobotta, B. Stanisz, T. Goslinski and L. Sobotta, Nanomaterials, 2020, 10, 387 CrossRef CAS PubMed
- Q.-F. Guan, Z.-C. Ling, Z.-M. Han, H.-B. Yang and S.-H. Yu, Matter, 2020, 3, 1308–1317 CrossRef
- Q. Meng, J. Liu, L. Liu and G. Xiong, Microporous Mesoporous Mater., 2021, 320, 111090 CrossRef CAS
- J. Poostforooshan, S. Belbekhouche, M. Shaban, V. Alphonse, D. Habert, N. Bousserrhine, J. Courty and A. P. Weber, ACS Appl. Mater. Interfaces, 2020, 12, 6885–6898 CrossRef CAS PubMed
- Z. Si, X. Zhang, Y. Liu, H. Zhou, X. Chen, X. Yang, H. Chen and J. Zhan, J. Mater. Sci., 2020, 55, 565–576 CrossRef CAS
- M. Kubo, T. Saito and M. Shimada, Microporous Mesoporous Mater., 2017, 245, 126–132 CrossRef CAS
- X.-J. Guo, C.-H. Xue, S. Sathasivam, K. Page, G. He, J. Guo, P. Promdet, F. L. Heale, C. J. Carmalt and I. P. Parkin, J. Mater. Chem. A, 2019, 7, 17604–17612 RSC
- Y. Chen, S. Ji, W. Sun, Y. Lei, Q. Wang, A. Li, W. Chen, G. Zhou, Z. Zhang and Y. Wang, Angew. Chem., 2020, 132, 1311–1317 CrossRef
- F. Alcaide, R. V. Genova, G. Álvarez, H.-J. Grande, Ó. Miguel and P. L. Cabot, Int. J. Hydrogen Energy, 2020, 45, 20605–20619 CrossRef CAS
- W. Liu, D. Haubold, B. Rutkowski, M. Oschatz, R. Hübner, M. Werheid, C. Ziegler, L. Sonntag, S. Liu and Z. Zheng, Chem. Mater., 2016, 28, 6477–6483 CrossRef CAS
- H. Usui, Y. Domi, S. Ohnishi and H. Sakaguchi, ACS Appl. Nano Mater., 2019, 2, 5360–5364 CrossRef CAS
- Y. Li, J. Chen, P. Cai and Z. Wen, J. Mater. Chem. A, 2018, 6, 4948–4954 RSC
- Y. Zhao, Y. Wei, X. Wu, H. Zheng, Z. Zhao, J. Liu and J. Li, Appl. Catal., B, 2018, 226, 360–372 CrossRef CAS
- S. Liang, X. Deng, G. Xu, X. Xiao, M. Wang, X. Guo, P. a. Ma, Z. Cheng, D. Zhang and J. Lin, Adv. Funct. Mater., 2020, 30, 1908598 CrossRef CAS
- S. Wang, Y. Wang, Y. Song, X. Jia, J. Yang, Y. Li, J. Liao and H. Song, Energy Storage Mater., 2021, 43, 422–429 CrossRef
- Y. Liu, M. Liu, T. Lan, J. Dou and M. Wei, J. Mater. Chem. A, 2015, 3, 18882–18888 RSC
- Y. Ji, Y. il Cho, Y. Jeon, C. Lee, D.-H. Park and Y.-G. Shul, Appl. Catal., B, 2017, 204, 421–429 CrossRef CAS
- M. Imran, A. B. Yousaf, X. Zhou, Y.-F. Jiang, C.-Z. Yuan, A. Zeb, N. Jiang and A.-W. Xu, J. Phys. Chem. C, 2017, 121, 1162–1170 CrossRef CAS
- R. M. Antoniassi, J. Quiroz, E. C. Barbosa, L. S. Parreira, R. A. Isidoro, E. V. Spinacé, J. C. Silva and P. H. Camargo, ChemCatChem, 2021, 13, 1931–1939 CrossRef CAS
- A. Lewera, L. Timperman, A. Roguska and N. Alonso-Vante, J. Phys. Chem. C, 2011, 115, 20153–20159 CrossRef CAS
- K. Huang, K. Sasaki, R. R. Adzic and Y. Xing, J. Mater. Chem., 2012, 22, 16824–16832 RSC
- M. Kim, C. Kwon, K. Eom, J. Kim and E. Cho, Sci. Rep., 2017, 7, 1–8 CrossRef PubMed
- V. T. T. Ho, C.-J. Pan, J. Rick, W.-N. Su and B.-J. Hwang, J. Am. Chem. Soc., 2011, 133, 11716–11724 CrossRef CAS PubMed
- L. Chevallier, A. Bauer, S. Cavaliere, R. Hui, J. Roziere and D. J. Jones, ACS Appl. Mater. Interfaces, 2012, 4, 1752–1759 CrossRef CAS PubMed
- C. He, S. Sankarasubramanian, I. Matanovic, P. Atanassov and V. Ramani, ChemSusChem, 2019, 12, 3468–3480 CrossRef CAS PubMed
- K. Senevirathne, V. Neburchilov, V. Alzate, R. Baker, R. Neagu, J. Zhang, S. Campbell and S. Ye, J. Power Sources, 2012, 220, 1–9 CrossRef CAS
- N. R. Elezović, B. M. Babić, L. Gajić-Krstajić, V. Radmilović, N. V. Krstajić and L. Vračar, J. Power Sources, 2010, 195, 3961–3968 CrossRef
| This journal is © The Royal Society of Chemistry 2022 |