DOI:
10.1039/D2RA03654A
(Paper)
RSC Adv., 2022,
12, 23215-23220
A novel quinoline derivative as a highly selective and sensitive fluorescent sensor for Fe3+ detection†
Received
13th June 2022
, Accepted 9th August 2022
First published on 16th August 2022
Abstract
In this research, a novel selective and sensitive fluorescent sensor for detecting Fe3+ was designed and synthesized; it revealed an obvious fluorescence quenching effect upon addition of Fe3+, and possessed the quantitative analysis ability on account of the formation of a 1![[thin space (1/6-em)]](https://www.rsc.org/images/entities/char_2009.gif) :1 metal–ligand complex. Furthermore, the density functional theory calculations were utilized to study the molecular orbitals as well as the spatial structure. Simultaneously, the cell experiments and zebra fish experiments verified the application value of the sensor in the biological field.
:1 metal–ligand complex. Furthermore, the density functional theory calculations were utilized to study the molecular orbitals as well as the spatial structure. Simultaneously, the cell experiments and zebra fish experiments verified the application value of the sensor in the biological field.
Introduction
Fe3+ is the fourth most abundant element in the environment and is the backbone of industrial development.1–3 Meanwhile Fe3+ is one of the necessary ions for life, and is involved in many cellular biochemical processes. The deficiency or excess of Fe3+ will lead to a series of diseases, for example, Fenton reaction may take place in the presence of excess Fe3+ in cells, and the generated reactive oxygen species (ROS) from Fenton reaction are able to induce neurodegenerative diseases such as Alzheimer's disease, Parkinson's disease and Huntington's disease.4–6 In addition, the deficiency or inadequate intake of Fe3+ may cause arteriosclerosis, anemia, physical dysfunction, heart damage, and even death in severe cases. So the development of effective Fe3+ detection methods is critical in modern society. In recent years, atomic absorption spectrometry, inductively coupled plasma mass spectrometry, inductively coupled plasma spectrometry, flow injection analysis, voltammetry and microbiology have been reported in detection of Fe3+, and these methods have disadvantages such as complex preprocessing, burdensome process, high operating costs, limited sensitivity and long analysis time.7–13 Therefore, the above methods cannot be utilized as analytical tools for real-time or site inspection of target analytes, which greatly limits their practical application. As an alternative method, fluorescence sensors possess the advantages of high sensitivity, strong selectivity, fast response, low cost, real-time analysis and good portability, hence it is of great significance to design and prepare a simple and efficient fluorescence sensor.14–22 Nitrogen heterocyclic compounds are nucleophilic or alkaline, and commonly found in natural products such as nucleic acids, coenzymes, amino acids and alkaloids. In heteroaromatic rings, nitropyrrole has special electronic properties that contribute to π conjugation.23 Pyrrole, imidazole, pyrazole, pyridine and pyrimidine are relatively common in chemical reactions due to their high stability and applicability. Quinoline is a common nitrogen heterocyclic compound, and at the same time is also good at complexing to metals. The structure of quinoline makes it provide weak alkalinity, rigid structure and high quantum yield, and it's reactive to both nucleophiles and electrophiles, so quinoline and its derivatives can be used as fluorophores to design metal ion fluorescence sensors.
In this research, a novel fluorescent sensor 1 was successfully designed and synthesized through chemical modification of quinoline fluorophore; sensor 1 exhibited good selectivity and sensitivity to Fe3+, and it was capable of effective recognition of Fe3+ among common metal ions. At the same time, the cell viability assay, the cell fluorescence imaging experiments and specific labeling experiments on zebra fish proved that sensor 1 could be used to detect Fe3+ in organisms.
Experimental
Materials and instrumentations
The chemical reagents and solvents utilized in experiments were commercially available analytical grade, without further purification, and solvents for spectra detection were HPLC reagent without fluorescent impurity. 1H and 13C NMR spectra were taken on a Varian Mercury-300 spectrometer with TMS as an internal standard. HRMS spectra was analysed on an Agilent 1290-Micro TOF QII. UV-visible absorption spectrum was applied on a UV-1900 spectrometer. Fluorescence spectrum was applied on a Hitachi F-4600 spectrofluorimeter. The pH measurement was made with Metteler-Toledo Instruments DELTE 320 pH. Cell experiments were performed on an inverted fluorescence microscope (Olympus IX-70) connected to a digital camera (Olympus, c-5050).
UV-vis and fluorometric analysis
The metal ions (Na+, Ca2+, Hg2+, Cd2+, Mg2+, Zn2+, Pb2+, Co2+, Mn2+, Cu2+, Al3+, Cr3+, Fe2+ and Fe3+) used in experiments were purchased from Aladdin reagent official website and stored in the vacuum storage boxes. The above metal ions were prepared as buffer solution (HEPES–NaOH, pH = 7.4) and diluted to 5 × 10⁻⁴ M to obtain the corresponding ionic solution, the experimental samples were prepared by placing appropriate amounts of ions stock into matching concentration solutions of sensor 1 [V(DMF)/V(H2O) = 1:1, pH = 7.4]. The fluorometric analysis of sensor 1 was investigated with 314 nm as excitation wavelength, both the excitation and emission slit widths were 5 nm and 5 nm, respectively.
Synthesis of sensor 1
Anhydrous potassium carbonate (3.8 g, 28 mmol) and 8-hydroxyquinoline (2.0 g, 14 mmol) were dissolved in 50 mL acetonitrile and stirred continuously at room temperature for 30 minutes, then ethyl bromoacetate (2.5 g, 15 mmol) was added into the mixture and stirred for another 6 h. The product was extracted three times with dichloromethane and deionized water, the organic phase was dried with anhydrous magnesium sulfate for 24 hours, and the solvent was steamed after drying. The crude product was separated and purified by column chromatography (developing agent: petroleum ether/ethyl acetate = 2/1). After purification, the reddish-brown oily product was obtained (about 0.9 g). The reddish-brown oily product (0.50 g, 2.2 mmol) was accurately weighed and dissolved in 5 mL ethanol, then hydrazine hydrate was added into the methanol solution dropwise. After stirring at room temperature for 1 hour, the generated white precipitate was collected and purified by column chromatography (developing agent: ethanol/dichloromethane = 1/1) to obtain a white solid (0.32 g). The product of the previous step (0.22 g, 1 mmol) and excess 3-nitrophenyl isothiocyanate (0.36 g, 2 mmol) were added to tetrahydrofuran, heated and refluxed for 6 hours, and the crude product was obtained by evaporation of the solvent. The crude product was separated and purified by column chromatography to obtain sensor 1 (developing agent: ethyl acetate/petroleum ether = 2/1). Finally sensor 1 was obtained about 0.19 g as white solid, yield 33%. 1H NMR (300 MHz DMSO, 25 °C, TMS): δ 4.47 (s, 2H), 7.20 (s, H), 7.26 (s, H), 7.30 (s, H), 8.11 (s, 2H), 8.14 (s, H), 8.17 (s, H), 8.28 (s, 2H), 8.36 (s, 2H), 10.40 (s, 1H), 11.68 (s, 1H). 13C NMR (75 MHz DMSO, 25 °C, TMS): 68.37, 112.19, 118.77, 121.49, 122.48, 125.60, 127.23, 129.78, 136.51, 140.31, 143.57, 144.33, 148.23, 149.83, 154.42, 164.19, 167.32, 182.20. HRMS. Calc. for: C18H15N5O4S m/z = 397.08, found [(M + 1)+] m/z = 398.2 (Scheme 1).
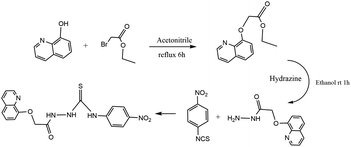 |
| | Scheme 1 Synthesis of sensor 1. | |
Results and discussion
Absorption spectral response
The changes of the UV-vis spectra for sensor 1 in different concentrations of Fe3+ were investigated. 5 × 10⁻⁴ M sensor 1 solution was prepared with DMF:HEPES–NaOH buffer solution (V:V = 1:1, pH = 7.4). Then added different concentrations of Fe3+ buffer solutions of equal volume into sensor 1 solutions, respectively. As illustrated in Fig. 1, the maximum absorption peak of UV-vis spectra was located at 314 nm, as the Fe3+ content increases, the absorbance at 314 nm increases gradually, this means that the addition of Fe3+ affected the UV absorption spectrum of sensor 1, and it was mainly caused by the formation of metal complexes between them; the binding constants of metal complexes would be discussed by modified Stern–Volmer. And we took 314 nm as the maximum excitation wavelength in the fluorescence emission spectrum.
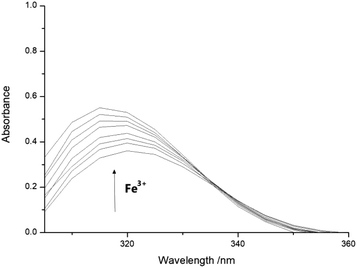 |
| | Fig. 1 UV-vis absorption response of sensor 1 in different concentrations of Fe3+. | |
Fluorescence spectral response
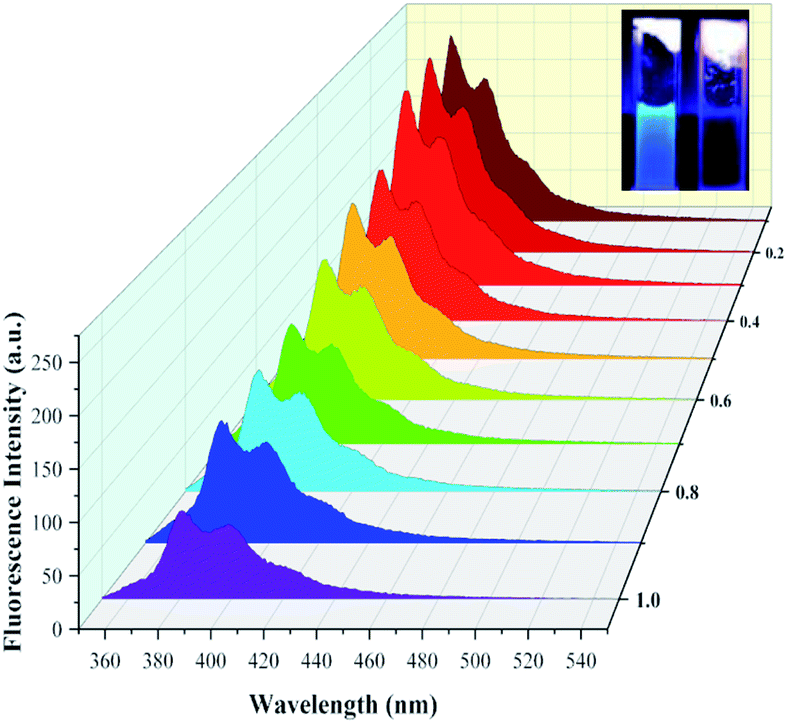
For realizing the fluorescence response of sensor 1 toward Fe3+, the fluorescence emission spectra of sensor 1 [V(DMF)/V(H2O) = 1:1, 5 × 10⁻⁴ M] in different concentrations of Fe3+ (5 × 10⁻⁵ M to 5 × 10⁻⁴ M, HEPES–NaOH buffer solution, pH = 7.4) was investigated. As illustrated in Fig. 2, sensor 1 alone exhibited obvious fluorescence at 420 nm (λex = 314 nm); with the increasing addition of Fe3+, the fluorescence emission at 420 nm gradually diminished until quenching. It could also be seen from the appended picture in Fig. 2 that the specific fluorescence response from sensor 1 to Fe3+ was very intuitive under UV lamps.
 |
| | Fig. 2 Fluorescence response of sensor 1 to Fe3+ in different concentration. | |
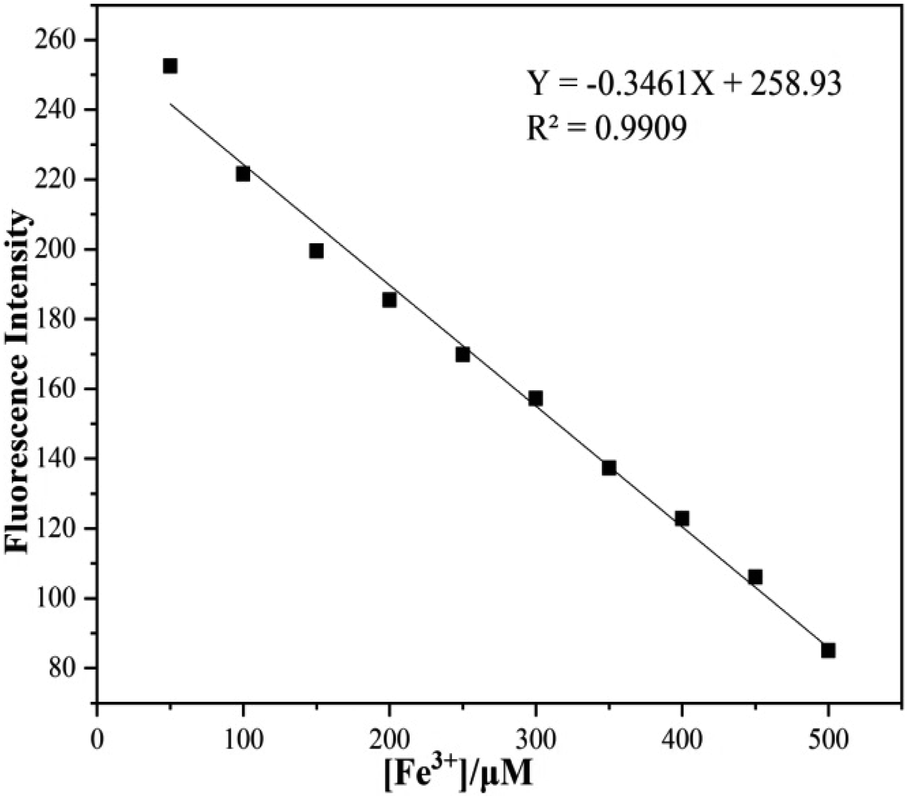
The concentration dependent changes in fluorescence spectra of sensor 1 in 5 × 10⁻⁵ to 5 × 10⁻⁴ M Fe3+ were illustrated in Fig. 3; as can be seen from Fig. 3 the reduction of fluorescence intensities revealed a good linear relationship, the linear equation y = −0.3461x + 258.93 was obtained through linear fitting (R2 = 0.9909). The detection limit of sensor 1 was calculated to be 8.67 × 10⁻⁵ M according to the detection limit formula: LODs = 3σ/m.24 So these above results indicated that sensor 1 was provided with the ability of quantitative analysis of Fe3+.
 |
| | Fig. 3 Normalized response of fluorescence signal to Fe3+ in the range of 5 × 10⁻⁵ to 5 × 10⁻⁴ M. | |
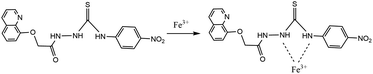
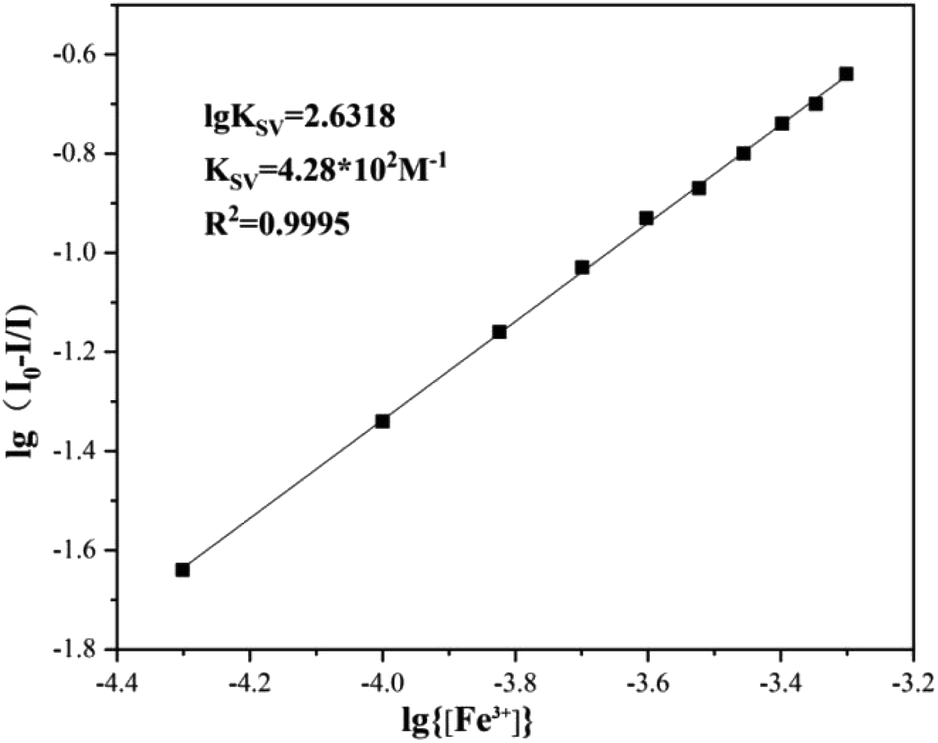
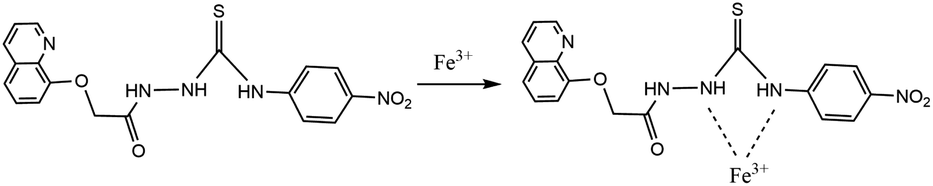
For further realizing the complexing capacity and complexing ratio of sensor 1 molecule to Fe3+, the modified Stern–Volmer equation was used to calculate the binding constant and ratio. As demonstrated in Fig. 4, the experimental data was substituted into the equation, with a coefficient R2 = 0.9995, and the binding constant of sensor 1 for Fe3+ was 4.28 × 10² M−1. The complexation ratio of sensor 1 to Fe3+ was 1:1. According to the form of 1:1 binding mode, and referring to previous relevant literature reports,25 the possible binding model between sensor 1 and Fe3+ was further inferred as depicted in Fig. 5. In the absence of Fe3+, sensor 1 alone emitted fluorescence quinoline group. After complexing with Fe3+, two nitrogen atoms bonded with Fe3+, resulted in a spin-blocking N–π transition; nitrogen coordinated with Fe3+ could not continue to hinder the non-radiative relaxation of its lone pair electrons, and produced photoinduced electron transfer effects, thus the fluorescence quenching of sensor 1 was caused.
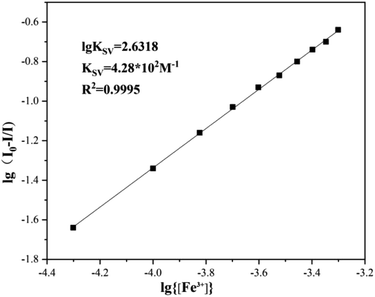 |
| | Fig. 4 The linear fitting of the fluorescence titration curve of sensor 1. | |
 |
| | Fig. 5 The combined model diagram between sensor 1 and Fe3+. | |
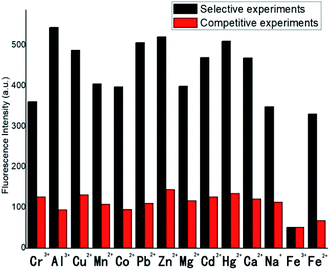
Selectivity is an important criterion for evaluating fluorescence sensors, in order to realize the effect of common metal ions on the fluorescence intensity of sensor 1, a series of metal ions such as Na+, Ca2+, Hg2+, Cd2+, Mg2+, Zn2+, Pb2+, Co2+, Mn2+, Cu2+, Al3+, Cr3+, Fe2+ and Fe3+ were utilized to conduct selective experiments of sensor 1. Under the same experimental conditions, the experiments were performed by added the above metal ion solutions of equal volume and concentration (5 × 10⁻⁴ M) to sensor 1 solutions (5 × 10⁻⁴ M), respectively. The fluorescence intensities of selective experiments in emission spectrum at 420 nm were adopted as illustrated in Fig. 6, the black histograms represented the data of the selective experiments. As shown in Fig. 6, sensor 1 displayed an emission peak at 420 nm (λex = 314 nm), the introduction of Na+, Ca2+, Hg2+, Cd2+, Mg2+, Zn2+, Pb2+, Co2+, Mn2+, Cu2+, Al3+, Fe2+, Cr3+ did not affect fluorescence emission obviously, but Fe3+ significantly weakened the fluorescence intensity at 420 nm. Moreover, the competitive experiments were brought in further validation of anti-interference capability of sensor 1 in Fe3+ recognition. Na+, Ca2+, Hg2+, Cd2+, Mg2+, Zn2+, Pb2+, Co2+, Mn2+, Cu2+, Al3+, Cr3+, Fe2+ were selected to conduct competitive experiments. Under the same solvent conditions [V(DMF)/V(H2O) = 1:1, pH = 7.4], sensor 1 solution was first induced to fluorescence quenching by 1 equivalent Fe3+ solution (5 × 10⁻⁴ M), whereafter 10 equivalent (5 × 10⁻³ M) of the other kinds of metals ions solutions were added into the fluorescent quenching solution, and the fluorescence intensities of mixed system in emission spectrum at 420 nm were adopted as the data of the competitive experiments. As illustrated in Fig. 6, the selective and competitive experiments were used for comparison to make the experimental results more intuitive, the red histograms represented the competitive experiments, as depicted in red histograms, the fluorescence intensities of the solutions mixed with competing metal ions were not significantly affected and were still in quenching states. So we believed that the exclusive bonding between Fe3+ and sensor 1 was more steady than the other metal ions, which proved the ability of sensor 1 to detect Fe3+ in complex systems. The good selectivity between sensor 1 and Fe3+ could be explained by the paramagnetic effect of Fe3+ in d6 configuration. Since the  dx2−y2 orbital of Fe3+ in d6 configuration was half full, sensor 1 was inhibited from excited state to ground state through emission of fluorescence in the process of energy transfer, resulting in significant fluorescence quenching.
 |
| | Fig. 6 Histograms of fluorescence selective experiments and competitive experiments of sensor 1 in different metal ions. | |
Theoretical calculation research
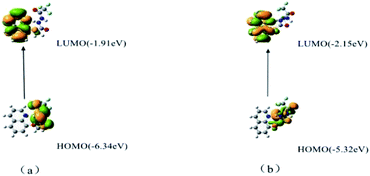
To realize the identification ability of sensor 1 towards Fe3+, the density functional theory (DFT) calculations were applied. The HOMO (highest occupied molecular orbitals) and LUMO (lowest unoccupied molecular orbitals) distributions of sensor 1 used the Gaussian 09 package with PBE0 to calculate the optimal geometry configuration, spatial electron cloud arrangement and spatial structure of molecules, the 3-21G basis set was employed for the H, C, N, and O atoms, and the LANL2DZ effective core potential was employed for Fe3+. Sensor 1 synthesized in this research was rich in electrons and had a favourable conjugated structure to combine with Fe3+. As illustrated in Fig. 7, the emission peak of the fluorescence molecule was generated by S0, which corresponded to LUMO → HOMO. The fluorescence emission peak of the complex molecule was larger than the emission peak wavelength of the sensor molecule, and the large gap in fluorescence signal was conducive to fluorescence detection and practical application. All the theoretical calculation results were in good agreement with the actual experimental data, which also verified the scientific nature of the experimental results from the theoretical level.
 |
| | Fig. 7 Molecular orbitals involved in the vertical emission of (a) sensors 1 and (b) sensor 1-Fe3+. | |
Cell imaging study of fluorescence sensor 1
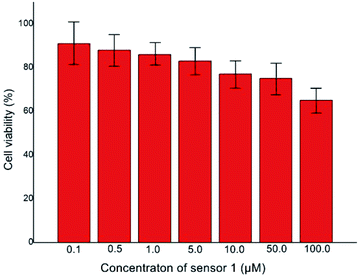
In order to ulteriorly explore the potential biological application, the MTT assay was performed in Hi-7702 cells (normal liver cells) to confirm the cytotoxicity in different concentrations (0.1, 0.5, 1, 5, 10, 50 and 100 μM) of sensor 1. As illustrated in Fig. 8, the cells were healthy and did not display any remarkable reduction in cell viability in the concentration range of 0.1 to 50 μM. At the highest concentration of sensor 1 (100 μM), the cells revealed a mild decrease in the viability (65%). These experimental results proved that sensor 1 has extraordinary low cytotoxicity under the experimental conditions. Furthermore, the IC50 value was ascertained as 225.2 μM. Compared with other quinoline derivative sensor molecules, sensor 1 had good selectivity and low cytotoxicity.26–28 Accordingly, the sensor 1 was suggested for monitoring Fe3+ status in vivo.
 |
| | Fig. 8 Concentration-dependent cell viability assay. | |
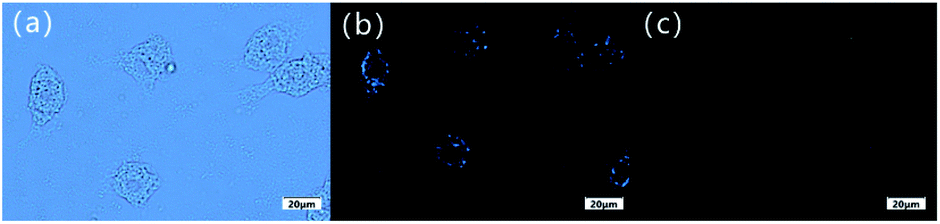
For further exploring the application of sensor 1 in biological field, Hi-7702 cells were utilized to test the biocompatibility of the sensor 1. Hi-7702 cells were utilized to test the biocompatibility of the sensor 1. The Hi-7702 cells were first bred with 20 μM sensor 1 for 1 h at 25 °C in 5% CO2 atmosphere, washed with phosphate buffered saline (PBS, PH = 7.4) for 3 times, and added 20 μM Fe3+ into the solution for 1 h. As illustrated in Fig. 9(a) and (b), cells treated by sensor 1 displayed evident blue fluorescence emission and still maintained clear contours, which proved sensor 1 smoothly penetrate the cell membrane into HI-7702 cell. And in Fig. 9(c) after the addition of Fe3+, the blue fluorescence in Hi-7702 cells basically disappeared. According to the Fig. 9 we were sure of that sensor 1 had successfully immersed into the cells and could track the intracellular Fe3+ in Hi-7702 cells. The cell imaging experiments showed that sensor 1 was membrane-permeable and could be applied in biological processes involving Fe3+. Hence, we were certain that sensor 1 possessed potential application in the biological field.
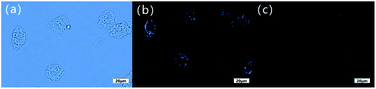 |
| | Fig. 9 (a) Bright field transmission image of Hi-7702 cells treated with sensor 1; (b) fluorescence imaging of Hi-7702 cells treated with sensor 1; (c) fluorescence imaging of Hi-7702 cells treated with sensor 1-Fe3+. | |
Fluorescence imaging of small animals with fluorescence sensor 1
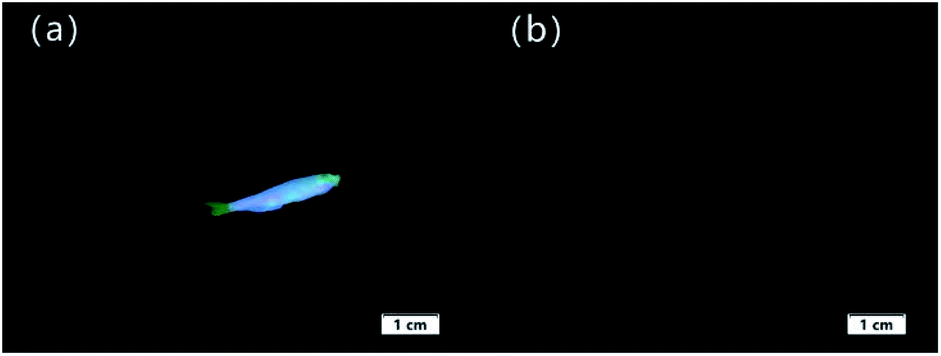
Zebra fish is a common freshwater fish with 87% genetic similarity to humans, and the average body length of it is 2–4 cm. To research the biocompatibility of sensor 1, zebra fish was adopted to explore whether sensor 1 could be applied in visual recognition of Fe3+ in live animals. Zebra fish was first cultivated in sterile purified water for 2 days at 25 °C, and DMF solution dissolved with sensor 1 (10 mM) was added into the culture solution for breeding for 1 h. Then the zebra fish were washed with HEPES–NaOH buffer solution for 3 times. After finishing the above operations, as shown in Fig. 10(a), it was found that the zebra fish absorbed sensor 1 revealed obvious fluorescence, the morphology of it was visible under 365 nm UV light. However, after further feeding zebra fish with Fe3+ (20 mM) for another 1 h, as illustrated in Fig. 10(b), the shape outline of zebra fish was barely observable under 365 nm UV light. These Fig. 10 demonstrated that sensor 1 was successfully absorbed into the body of zebra fish, so the recognition of Fe3+ by sensor 1 had taken place in zebra fish successfully. These phenomena gave evidence that sensor 1 could be used as an effective method in biological application.
 |
| | Fig. 10 Images of zebra fish under 365 nm UV light; (a) zebra fish bred with only sensor 1 for 1 h; (b) zebra fish bred with sensor 1 and then bred with Fe3+ for 1 h. | |
Conclusions
In summary, a selective and sensitive fluorescent sensor was successfully developed by chemically modifying the quinoline fluorophore. Fe3+ was able to reduce the fluorescence emission from sensor 1 by generating a 1:1 complex, the complexation constant of sensor 1 for Fe3+ was calculated to be 4.28 × 10² M−1 from the Stern–Volmer equation, and the detection limit of sensor 1 to Fe3+ was 8.67 × 10⁻⁵ M. While the biocompatibility experiments proved sensor 1 could recognize Fe3+ in Hi-7702 cells and zebra fish. Thus, we believed that sensor 1 could be a valuable Fe3+ fluorescent sensor in chemical and biomedical fields.
Ethical statement
All animal procedures were performed in accordance with the Guidelines for Care and Use of Laboratory Animals of Changchun University of Science and Technology, and experiments were approved by the Animal Ethics Committee of Changchun University of Science and Technology.
Conflicts of interest
No potential conflict of interest was reported by the authors.
Acknowledgements
We acknowledge the Scientific Research project of Education Department of Jilin Province (JJKH20220730KJ) for the support of our work.
Notes and references
- Y. P. Zhang, X. F. Li, Y. S. Yang, J. L. Wang, Y. C. Zhao and J. J. Xue, J. Fluoresc., 2021, 31, 29–38 CrossRef CAS PubMed.
- K. Wechakorn, S. Chomngam, U. Eiamprasert and P. Kongsaeree, Chem. Pap., 2021, 75, 883–892 CrossRef CAS.
- M. Yang, S. C. Lee, M. Kim, H. L. Mi and C. Ki, Spectrochim. Acta, Part A, 2021, 245, 118899–118909 CrossRef CAS PubMed.
- S. Erdemir and O. Kocyigit, Talanta, 2016, 158, 63–69 CrossRef CAS PubMed.
- K. P. Carter, A. M. Young and A. E. Palmer, Chem. Rev., 2014, 114, 4564–4601 CrossRef CAS PubMed.
- Y. Wu, Y. Li, L. Zou and J. F. X. Wu, J. Coord. Chem., 2017, 70, 1077–1088 CrossRef CAS.
- F. Hardoyono and K. Windhani, New J. Chem., 2021, 45, 17930–17940 RSC.
- P. Koralli and D. E. Mouzakis, Chemosensors, 2021, 9, 99–121 CrossRef CAS.
- Y. Wang, L. Yang, X. R. Wei, R. Sun, Y. J. Xu and J. F. Ge, Anal. Methods, 2018, 10, 5291–5296 RSC.
- X. L. Qu, D. Gui, X. L. Zheng, R. Li, H. L. Han, X. Li and P. Z. Li, Dalton Trans., 2016, 45, 6983–6989 RSC.
- N. Gao, J. Yu, Q. Tian, J. Shi and L. Zang, Chemosensors, 2021, 9, 79–105 CrossRef CAS.
- C. M. Ngue, M. K. Leung and K. L. Lu, Inorg. Chem., 2020, 59, 2997–3003 CrossRef CAS PubMed.
- K. Xu, Y. Y. Li, Y. Si, Y. L. He, J. B. Ma, J. He, H. W. Hou and K. Li, J. Lumin., 2018, 204, 182–188 CrossRef CAS.
- R. Wang, X. S. Huang, T. F. Liu and R. Cao, Chem. J. Chin. Univ., 2020, 41, 2174–2184 CAS.
- X. Meng, J. Zhao and W. Ma, Chin. J. Org. Chem., 2020, 40, 276–283 CrossRef CAS.
- J. Wu, H. Zhang, Y. H. Luo, W. Y. Geng and Y. Q. Lan, Chem. J. Chin. Univ., 2022, 43, 20210616–20210617 Search PubMed.
- W. Li, J. Y. Qiao, X. Y. Liu and Y. L. Liu, Chem. J. Chin. Univ., 2022, 43, 20210654–20210672 Search PubMed.
- S. Ghaderahmadi, M. Kamkar, N. Tasnim, M. Arjmand and M. Hoorfar, New J. Chem., 2021, 45, 17727–17752 RSC.
- J. L. Du, X. Y. Zhan, C. P. Li, J. P. Gao, J. X. Hou, X. Jing, Y. J. Mu and L. J. Li, Sens. Actuators, B, 2018, 257, 207–213 CrossRef CAS.
- A. Manna, M. Das, S. Mukherjee and S. Das, Macromol. Rapid Commun., 2021, 42, e2000469 CrossRef PubMed.
- A. Tigreros and J. Portilla, RSC Adv., 2020, 10, 19693–19712 RSC.
- H. Mizuno and G. Fukuhara, Bunseki Kagaku, 2020, 69, 607–617 CrossRef CAS.
- M. C. Rios, N. F. Bravo, C. C. Sanchez and J. Portilla, RSC Adv., 2021, 11, 34206–34234 RSC.
- X. Hu, H. Cao, W. Dong and J. S. Tang, Talanta, 2021, 233, 122480–122487 CrossRef CAS PubMed.
- J. S. Wang, Y. X. Song, J. Y. Sun, X. D. Wu, Y. Q. Sun, X. X. Pan and D. Q. Li, Measurement, 2013, 46, 3982–3987 CrossRef.
- P. C. Zhang, Y. H. Chen, W. W. Song, G. L. Liu, Z. C. Liu, L. Yun and R. Q. Han, J. Mol. Struct., 2021, 1231, 129965–129980 CrossRef.
- C. H. Cai, H. L. Wang and R. J. Man, Spectrochim. Acta, Part A, 2021, 255, 119729–119734 CrossRef CAS PubMed.
- P. Madhu and P. Sivakumar, J. Mol. Struct., 2019, 1193, 378–385 CrossRef CAS.
|
| This journal is © The Royal Society of Chemistry 2022 |
Click here to see how this site uses Cookies. View our privacy policy here. 
 Open Access Article
 This Open Access Article is licensed under a Creative Commons Attribution-Non Commercial 3.0 Unported Licence
 *a,
Qingqing Pan
*a,
Qingqing Pan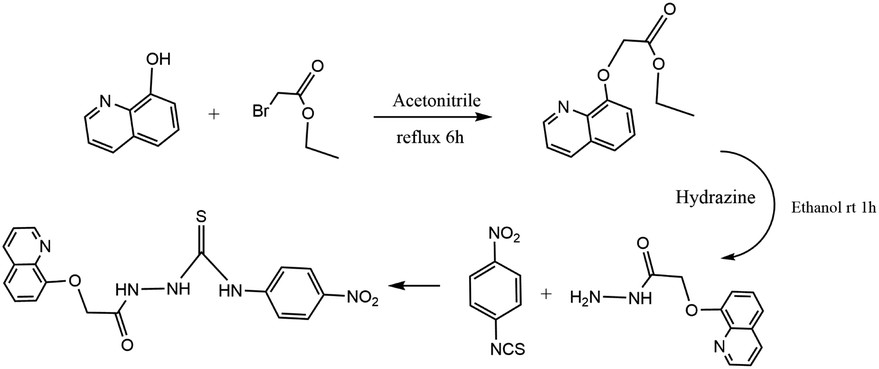

 dx2−y2 orbital of Fe3+ in d6 configuration was half full, sensor 1 was inhibited from excited state to ground state through emission of fluorescence in the process of energy transfer, resulting in significant fluorescence quenching.