 Open Access Article
Creative Commons Attribution 3.0 Unported Licence
Super-stable SnO2/MoS2 enhanced the electrocatalytic hydrogen evolution in acidic environments†
Kun Huang‡
a,
Lan Yang‡a,
Yihong Gaoa,
Shikuo Li*b,
Hui Zhang *b and
Fangzhi Huang
 *a
*a
aSchool of Chemistry and Chemical Engineering, Anhui University, Hefei, Anhui 230601, P. R. China. E-mail: huangfangzhi@163.com
bSchool of Materials Science and Engineering, Anhui University, Hefei, Anhui 230601, P. R. China. E-mail: lishikuo@ahu.edu.cn; zhhui@ahu.edu.cn
First published on 17th August 2022
Abstract
For electrocatalytic hydrogen evolution in acidic environments, the stability of catalysts has always been a significant factor restricting development. Here, we prepared a superstable SnO2/MoS2 coupled nanosheet array on carbon cloth (CC@SnO2/MoS2), exhibiting an overpotential of 166 mV at a current density of 10 mA cm−2. According to the results of various tests and theoretical calculations, it is shown that the establishment of SnO2/MoS2 interface engineering is to accelerate the electron transmission on the heterogeneous interface and S defects on the edge of MoS2, and finally improve the conductivity and catalytic activity of the catalyst. More importantly, the formation of an SnO2 interface layer during in situ transformation improves the stability and hydrophilicity of the material surface. We have proposed a strategy for engineering an interface with fast electron transport and proton adsorption, providing some new ideas for the design of HER catalysts in acid electrolytes.
Introduction
Benefiting from the advantages, a pollution-free and simple equipment, electrocatalytic hydrogen evolution technology is expected to replace the current industrial hydrogen production technology with high pollution and consumption.1–5 However, high-performance HER electrocatalysts expected to industrialization are precious metals such as Pt, which cannot acheive producation with large scale due to their rareness at present.6,7 Therefore, non-noble metal based electrocatalysts with high efficiency are urgently needed in the field of electrocatalytic hydrogen production.8,9 Compared with basic electrolytes, acidic electrolytes contain a large amount of free H+, which is more conducive to the occurrence of the electrocatalytic hydrogen evolution reaction.10–12 Unfortunately, the stability of most transition metal electrocatalysts in acidic solutions is so insufficient that the research of acidic HER catalysts is behind that of alkaline catalysts.13,14 Therefore, it is of practical value to develop non-noble metal electrocatalytic HER catalysts in acidic electrolytes.15–17 Some strategies have been developed to prepare acidic HER catalysts with low consumption or no precious metals.18,19 Liu et al. prepared a single-atom Pt catalyst on the surface of amorphous MoO3 and performed the HER in an acidic environment.20 The construction of monoatomic Pt contributes to the low consumption of precious metals and high performance, and the acid resistance of MoO3 can improve the corrosion resistance of the material.21–23 Using acid-resistant materials such as carbon materials to provide a protective layer for some transition metal semiconductors or materials is another promising strategy.24–27 However, instability and cumbersome problems in the preparation process will exist in the above strategies.13,28 Perhaps another way to think about it is that exploring materials with excellent intrinsic properties of acid resistance is an effective strategy to avoid the above triviality and instability.29–33Molybdenum disulfide (MoS2) has excellent acid resistance, electrochemical properties and abundant reserves, and has been widely used in the field of electrocatalysis.34,35 Its catalytic activity is mainly derived from the unsaturated S atom edge of its layered structure, as shown in some reports.36–40 Therefore, increasing the edge part of MoS2 is an effective way to improve its catalytic performance. It has been reported that changing the morphology of molybdenum disulfide, such as nanoplatelets, nanoparticles, and quantum dots, expands the number of edges.30,31,41 Among them, dispersing MoS2 nanoparticles on an acid-resistant nanosheet array is a feasible method to increase the number of unsaturated S atoms and prevent the aggregation.30 Secondly, it is possible to construct the defects and vacancies of MoS2 to increase the degree of unsaturation at the edge of the S atom, thereby increasing the number of active sites. The research of Baker et al. showed that the competitive reaction between metal ions (such as Mo4+ and Sn4+) and non-metals in the in situ conversion process can effectively produce more defects.42 Finally, the resistance of electron transfer between the layers of MoS2 leads to poor conductivity and activity, which hinders the catalytic performance.43,44 The electron injection of the conductive medium into the molybdenum disulfide can effectively reduce this resistance.30,45 In summary, growing MoS2 nanoparticles on a nanosheet array with high conductivity and strong corrosion resistance through the competitive reaction of ions in the solution is a promising strategy. The thus obtained SnO2/MoS2 interface layer with fast electron transfer and proton adsorption is expected to be developed as a highly efficient and stable non-noble metal self-supporting HER electrocatalyst in acidic electrolytes.
Following the above idea, we used SnS2 grown on carbon cloth as a precursor, and MoS2 particles were grown on it to obtain a SnO2/MoS2 coupled nanosheet array. First, the uniform distribution of MoS2 nanoparticles on the nanosheets and the conversion of sulfides to oxides during the reaction increase the number of MoS2 unsaturated sulfur defects; secondly, the good hydrophilicity and stability of the SnO2 nanosheet substrate enhanced the hydrophilicity and stability of the catalyst;46 the heterogeneous interface layer formed by the coupling of SnO2 and MoS2 can accelerate the injection of electrons into MoS2 and reduce the resistance to electron transfer between molybdenum disulfide layers. The SnO2/MoS2 heterogeneous nanosheet arrays obtained by us maintain good activity and stability in acidic electrolytes. At a current density of 10 mA cm−2, the overpotential is 166 mV, which is significantly lower than that of pure MoS2 and SnO2. In the 0.5 M H2SO4 electrolyte, the catalyst can be utilized for more than 20 hours, accompanied by a current density decay within an acceptable range (less than 20%). Experimental results have proved that our proposed strategy of constructing an interface layer in designing an efficient and stable non-noble metal self-supporting HER electrocatalyst in an acidic electrolyte is effective and promising.
Experimental
Chemicals and materials
WOS1009 carbon cloth (CC) was purchased from Taiwan CeTech Co., Ltd. Other chemicals were of analytical grade and used as received without further purification. They were purchased from Shanghai Aladdin Biochemical Technology Co., Ltd and Sinopharm Chemical Reagent Co., Ltd. Ultrapure water was used throughout the experiments.Pretreatment of carbon cloth
The conductive carbon cloth was soaked in concentrated nitric acid and allowed to stand for three days. The soaked carbon cloth was rinsed three times with ultrapure water, and different solvents were used for ultrasonic cleaning for 10 minutes. The obtained carbon cloth was soaked in absolute ethanol for later use.Synthesis of CC@SnS2 NSs
The typical synthesis process of CC@SnS2 nanosheets is conducted by the solvothermal method. 140 mg of SnCl4·5H2O was dissolved in 20 mL of absolute ethanol, and then 60.4 mg of TAA (thioacetamide) was added and rotated for 20 min. The resulting liquid was injected into a 50 mL reactor. The treated carbon cloth was leaned against the bottom of the reaction kettle so that the carbon cloth was completely immersed in the solution, which was placed in an oven to react at 100 °C for 6 h, and then cooled naturally. The obtained sample was washed three times with water and C2H5OH each. The finally obtained CC@SnS2 nanosheets were activated in a vacuum drying oven at 70 °C for 12 h.Synthesis of CC@SnO2@MoS2 NSs
CC@SnO2@MoS2 nanosheets are synthesized by the hydrothermal method. 1 mL, 2 mL, 3 mL and 4 mL of 1.44 mg mL−1 TAA ethanol solution were injected into four clean beakers in turn. Then, 1 mL, 2 mL, 3 mL and 4 mL of 4.84 mg mL−1 molybdate solution were added, respectively. After mixing, the above solutions were diluted to 20 mL with ethanol respectively. The above solution was transferred to four 50 mL reactors, and the synthesized CC@SnS2 nanosheets were leaned against the bottom of the reactor to completely immerse the carbon cloth in the solution. The reaction was carried out at 200 °C for 12 h. After cooling down, the obtained sample was washed with water and C2H5OH three times each. The finally obtained CC@SnO2@MoS2 nanosheets were dried in a vacuum drying oven at 70 °C for 12 h. The different samples obtained were named CC@SnO2@MoS2-1, CC@SnO2@MoS2-2.5, CC@SnO2@MoS2-5, and CC@SnO2@MoS2-10.Synthesis of CC@MoS2 NSs
The synthesis of CC@MoS2 nanosheets is roughly the same as the above CC@SnO2@MoS2-5 nanosheets except just replacing CC@SnS2 with conductive carbon cloth.Synthesis of CC@SnO2 NSs
The solvothermal method was used to prepare CC@SnO2 NSs. 140 mg of SnCl4 5H2O and the corresponding Na3C6H5O7 2H2O were dissolved in 20 mL of distilled water. After stirring the solution for 5 minutes, a certain concentration of NaOH solution was added. The resulting liquid was injected into a 50 mL reactor. The treated carbon cloth was leaned against the bottom of the reaction kettle so that the carbon cloth was completely immersed in the solution, which was placed in an oven to react at 180 °C for 12 h, and then cooled naturally. The obtained sample was washed three times with water and C2H5OH each. The finally obtained CC@SnO2 nanosheets were activated in a vacuum drying oven at 70 °C for 12 h.Results and discussion
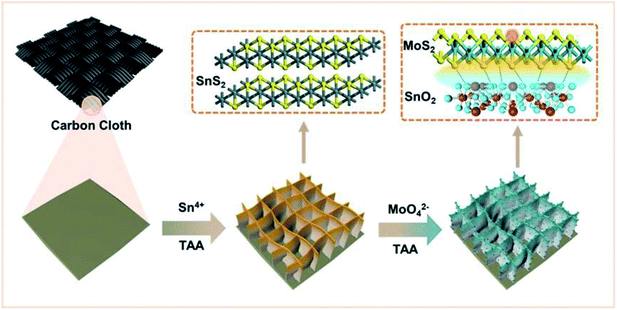
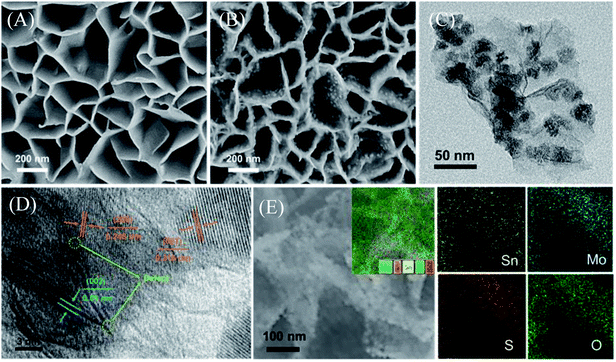
A schematic diagram of the material synthesis is shown in Scheme 1. First, SnS2 NSs are constructed on the carbon cloth substrate using the solvothermal method. The thickness of the SnS2 nanosheets is about 10 nm in the SEM image (Fig. 1A), growing uniformly and vertically on the carbon cloth.The honeycomb-like porous structure of vertical array is open-type so that it is more conducive to the introduction of electrolytes. Subsequently, MoS2 nanoparticles with uniform distribution and very uniform diameter were grown on the surface of SnS2, as shown in Fig. 1B. SnS2 will also be converted to SnO2 at this time, which is confirmed in the following characterization analysis. In addition, some MoS2 nanosheets will epitaxially grow along the edge of the SnO2 nanosheets, which also exposes more MoS2 unsaturated S edges. With the increase of S source and Mo source, MoS2 on the surface of SnO2 gradually transformed into nanoparticles, and finally formed multiple folds covering the surface, shown in the SEM of samples (Fig. S1A–D†). The SEM results indicate that the coverage of the folds from nanoparticles to MoS2 on the substrate is controllable. The combination of MoS2 nanoparticles and SnO2 nanosheets can be clearly observed from the transmission electron microscope image (TEM), as shown in Fig. 1C. The uniformly distributed MoS2 nanoparticles shown in the image will not agglomerate and have a diameter of about 25 nm. The high-magnification TEM of SnO2/MoS2 NSs clearly shows the lattice spacing of SnO2 and MoS2, as shown in Fig. 1D. The lattice spacing of SnO2 is 0.245 nm and 0.316 nm, and the distribution corresponds to the (200) and (001) crystal planes. In addition, the crystal lattice fracture is clearly observed, which corresponds to the defects formed during the crystal phase transformation. The formation of these defects is closely related to the competitive reaction of non-metal elements in the solvothermal reaction process. The lattice spacing of 0.61 nm corresponds to the (002) crystal plane of MoS2. The element distribution image of SnO2/MoS2 NSs shows that Sn, Mo, S, and O are evenly distributed on the nanosheet, which reveals the existence and distribution of each element, confirming the accomplished loading of MoS2 (Fig. 1E).
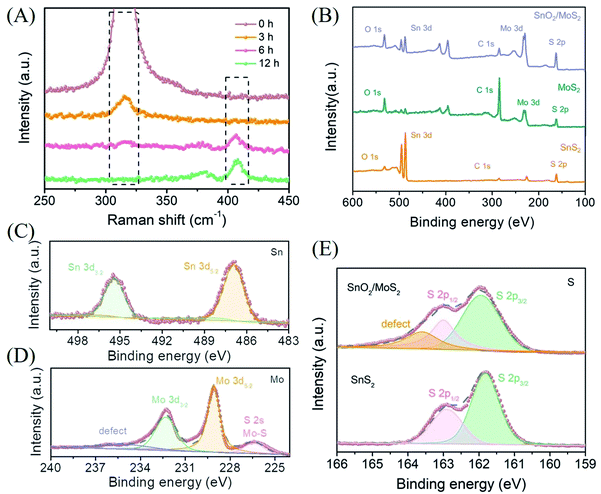
The results of XRD prove that the phase change from sulfide to oxide actually occurred during the second step of the reaction (Fig. S2A†). However, due to the low content and poor crystallinity of MoS2 on the surface as well as the strong peak of SnO2, the corresponding diffraction peak of MoS2 is difficult to find. In order to completely prove that the samples are loaded with MoS2 and to research the details of the transition from SnS2 to SnO2, we performed Raman spectroscopy analysis with different reaction times (Fig. 2A). In the unreacted pure SnS2 curve, a single strong Raman peak is observed at 317 cm−1, which corresponds to the A1g characteristic peak of SnS2. When the reaction time is 3 h, the intensity of the characteristic peak corresponding to 317 cm−1 is significantly reduced, indicating that the SnS2 composition is decreasing. Since Sn ions are more easily coordinated with oxygen in solution and are less sulfur-loving than Mo ions, the transformation of SnS2 to SnO2 has begun. However, the characteristic peak of MoS2 is still not observed at this time, which reflects that the formation of MoS2 requires more time or is later than the transformation of SnS2. We prefer the former. As the formation reaction of MoS2 has begun, the more sulfur-philic nature of Mo compared to Sn promotes the transition from SnS2 to SnO2 to occur more quickly. Accompanied by a reaction time of 6 h, the disappeared A1g characteristic peak of SnS2 indicates that the phase change from SnS2 to SnO2 has been completely completed. The E12g in-plane and A1g out-of-plane characteristic peaks corresponding to MoS2 at 380 and 408 cm−1 indicate that MoS2 has initially formed. With the reaction for 12 hours, the further enhanced characteristic peaks at 380 and 408 cm−1 corresponded to the complete transition from SnS2 to SnO2/MoS2. The results of the Raman diagram indicate that the competition between Sn and Mo for S2− does exist during the reaction, which leads to the transformation of Sn from sulfide to oxide.
In order to further research the valence composition of typical SnO2/MoS2 nanosheets, we performed XPS characterization of the samples. The characteristic peaks of Mo and Sn further proved the successful preparation of SnO2/MoS2 nanosheets, shown in the XPS total spectrum (Fig. 2B). The high-resolution XPS spectra of each element in SnO2/MoS2 NSs have been obtained (Fig. 2C–E). Sn 3d5/2 and Sn 3d3/2 located at 486.9 eV and 495.4 eV, respectively, are attributed to the characteristic peaks of Sn4+, indicating the presence of positive tetravalent Sn elements in the material (Fig. 2C). The formation of MoS2 is also certified by two characteristic peaks in the high-resolution XPS spectrum of Mo, as shown in Fig. 2D. The characteristic peaks at 229.1 eV and 232.3 eV correspond to Mo 3d5/2 and Mo 3d3/2, which confirms the above point. The S 2s energy peak near 226.4 eV is derived from the Mo–S bond, which once again verifies the existence of molybdenum disulfide. A broad peak can also be observed at 235.4 eV, which may be related to the defects in the competitive reaction. The characteristic peaks of S 2p2/3 and S 2p1/3 are observed at 161.96 eV and 163.0 eV, indicating that the valence states of S elements in SnS2 and SnO2/MoS2 are all negative divalent (Fig. 2E). And a peak can be observed at 163.6 eV, which is attributed to the defects of the unsaturated sulfur atoms contained. The XPS results once again confirmed that we successfully synthesized the SnO2/MoS2 nanosheet structure, and the sample contains a large number of defects that can provide active sites due to the competitive reaction of metal ions for S2−.
With a scan rate of 1 mV s−1, CC@SnO2/MoS2 NS samples were tested for HER performance in 0.5 M H2SO4 electrolyte. The comparative samples are CC@Pt/C, CC@SnS2, CC@SnO2 and CC@MoS2 with roughly the same load mass. All electrocatalytic results have been compensated for resistance to obtain accurate catalyst intrinsic performance. As shown in Fig. 3A, the CC@SnO2/MoS2 NS-2.5 sample exhibits a current density of 10 mA cm−2 at an overpotential of only 166 mV, which is better than other comparative samples. Pt/C exhibits the best activity as a conventional HER catalyst with an overpotential of 90 mV. It is worth noting that the overpotential of CC@SnO2/MoS2 NSs-2.5 is the lowest, better than samples with other loadings (Fig. 3B). This means that only the most suitable load of MoS2 can maximize performance. The CC@SnO2 sample has poor electrocatalytic activity, which makes it difficult to measure the standard current density. Compared with CC@SnS2 (494 mV) and CC@MoS2 (330 mV), the overpotential of CC@SnO2/MoS2 NSs-2.5 has a voltage reduction of 330 mV and 164 mV, respectively. The Tafel slope of CC@SnO2/MoS2 NSs-2.5 is 68.49 mV dec−1, which is much smaller than that of the other comparative samples, indicating that the CC@SnO2/MoS2 NS-2.5 sample has the most excellent electrochemical reaction kinetics among many materials (Fig. 3B). The results of LSV and Tafel slope show that we optimize electron transfer, proton adsorption and wettability of MoS2 through designing the SnO2/MoS2 interface layer, which is reflected in the catalytic performance.
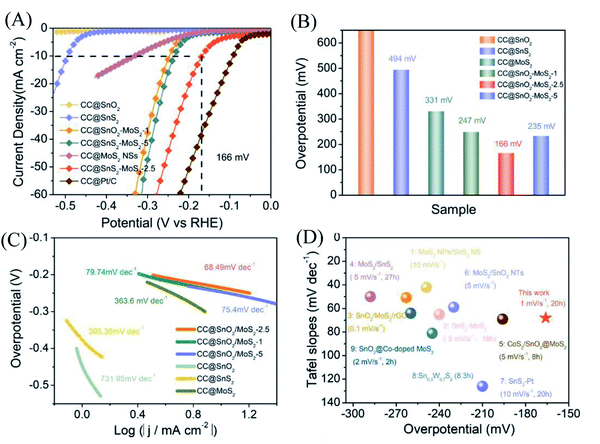 | ||
| Fig. 3 (A) LSV curves of different SnO2/MoS2 NSs (1, 2.5, and 5), SnS2, SnO2, Pt/C and MoS2 at 1 mV s−1. (B) Overpotential (η) of different samples at 10 mA cm−2. (C) Tafel slope plots corresponding to different samples. (D) A performance comparison diagram of this work with the work in 0.5 M H2SO4 of published relevant materials, with the sweep rate of the LSV curve and the stabilization time at 10 mA cm−2 in parentheses.29–32,47–52 | ||
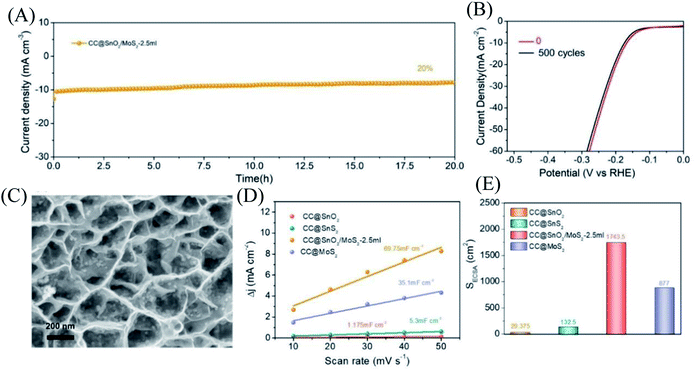
For electrocatalysts used in acid electrolytes, the stability is a significant parameter for evaluating catalysts. The i–t curve of the CC@SnO2/MoS2 sample was recorded with a voltage of 166 mV in order to test the stability of performance (Fig. 5A). After 20 hours of continuous electrolysis, samples with less than 20% attenuation of current indicate that the synthesized CC@SnO2/MoS2 heterogeneous nanosheets are expected to achieve long-term electrocatalytic processes. The test of the continuous 500-cycle cyclic voltammetry curve without obvious attenuation shows that the catalyst can withstand continuous catalytic reactions of different potentials and shows good stability (Fig. 4B). The sample after 500 cycles maintained the original morphology and showed strong toughness (Fig. 4C). The performance of this work is compared with the reported performance of related materials 1–9, as shown in Fig. 3D.29–32,47–52 The abscissa and ordinate of the graph are the overpotential of the catalyst at 10 mA cm−2 and the Tafel slope, respectively. The overpotential of the electrode material reported in this work is better than that of related materials, and its Tafel slope reflects that the electrochemical kinetics also has outstanding competitiveness. The electrochemical active area is usually an important basis for evaluating the intrinsic activity of a catalyst. The double-layer capacitor area of the material can be used to estimate the size of the electrochemically active area, as shown in Fig. S3.† The linear function image of the CV scan rate and current density difference (Δj) is obtained by fitting (Fig. 4E). From the figure, we can acquire that the Cdl of samples CC@SnO2 NSs, CC@SnS2 NSs, CC@MoS2 NSs and CC@SnO2/MoS2 NSs-2.5 is 1.175, 5.3, 35.1 and 69.75 mF cm−2, respectively. The electrochemically active area of the CC@SnO2/MoS2 NS-2.5 sample is 1743.5 cm2, which is much higher than that of CC@MoS2 NSs and other samples (Fig. 4F). On the basis of the above results, we also calculated ESCA-normalized LSV curves to confirm the intrinsic activity of the catalysts (Fig. S4†). With the largest electrochemical active area, SnO2@MoS2 still has the best intrinsic activity compared to other samples. The measurement results of electrochemically active area show that the construction of an interface layer in CC@SnO2/MoS2 nanosheets can effectively increase the number of active sites.
Furthermore, the hydrophilicity of electrode materials affects the performance of electrocatalytic hydrogen production. Hydrophilic samples can absorb more protons, and the H2 generated on the surface is easier to desorb, which is more conducive to the occurrence of the HER. The surface wettability of CC@MoS2 NS and CC@SnO2/MoS2 NS-2.5 samples was compared (Fig. S5A and B†). The surface of the CC@MoS2 sample is hydrophobic and has weak adhesion to liquids. The CC@SnO2/MoS2 NS-2.5 sample turned into a surface hydrophilic material, which may be the result of the improvement of the overall material due to the hydrophilic nature of SnO2. In addition, the electrical conductivity of the material has also been studied through the electrochemical impedance test, as shown in Fig. S6.† The electrochemical impedance test shows that the impedance of the SnO2 nanosheet structure grown with MoS2 nanoparticles is much smaller than that of pure MoS2 and pure SnO2 nanosheets, indicating that the construction of the SnO2/MoS2 interface layer speeds up electron transmission and reduces the resistance of the material. All these are further illustrated in the resistance fitting curve and equivalent circuit of the electrochemical impedance spectrum of SnO2/MoS2 (Fig. S7†).
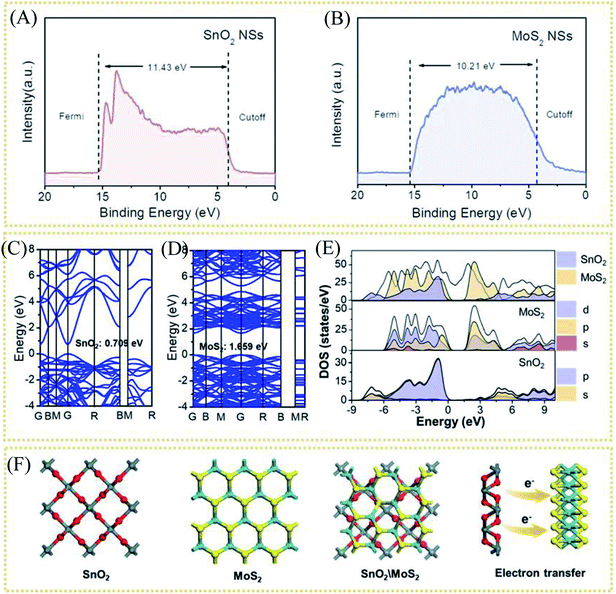
As mentioned above, through the electron injection of SnO2 into MoS2, the design of the interface layer reduces the resistance of the lateral surface of MoS2 to electron transfer and the strong van der Waals effect between layers to improve the conductivity. To study the electron transfer relationship between SnO2 and MoS2, the UV photoelectron spectroscopy (UPS) test of pure MoS2 and pure SnO2 was used to calculate their respective work functions (Φ). When an electron transitions from the inside of the conductor to the outside of the conductor, the minimum energy value required is Φ. Therefore, electrons will be transferred from components with a small work function to components with a large work function, accelerating electron transport. The UV photoelectron spectroscopy shows the value of the Fermi edge (EFermi) and the truncated edge (Ecut off) of the sample, as shown in the formula.
| Φ = hυ + Ecut off − EFermi |
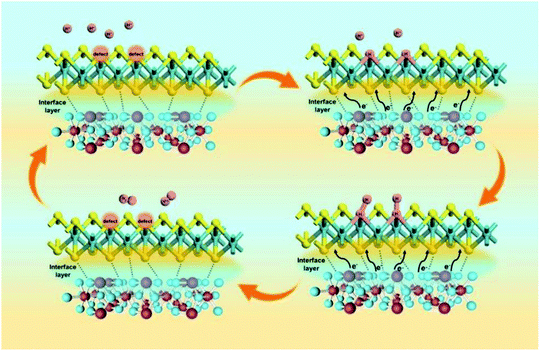
Among them, Φ is the work function of the material, also known as work function; hυ is the monochromatic light source with a value of 21.2 eV. The UPS energy spectra of pure MoS2 and pure SnO2 are shown in Fig. 5A and B. The difference value of SnO2 between the Fermi edge and the truncated edge is 11.43 eV (Fig. 5A). Similarly, for MoS2, the calculation result of the difference value between the Fermi edge and the truncated edge is 10.21 eV (Fig. 5B). According to the formula, the work functions of SnO2 NSs and MoS2 NSs are 9.79 eV and 11.01 eV, respectively. The result shows that less energy is required for electrons in SnO2 to escape from the inside of the material to the surface of the material, which confirms the electron injection of SnO2 into MoS2 during the catalysis process. The previous performance test also demonstrates that this electron transfer does enhance the performance of the catalyst. The energy band structure and density of states (DOS) of SnO2, MoS2, and SnO2/MoS2 are also calculated to support the UPS test results, as shown in Fig. 5C and D. The theoretical calculation results of the energy band structure of SnO2 and MoS2 show that the band gap of SnO2 is only 0.709 eV, showing excellent conductivity (Fig. 5C). In the conduction band position, the p orbit and s orbit of SnO2 are more upward than those of MoS2, which means that the electrons of SnO2 are more easily transferred to the MoS2 component, which is consistent with the results of UPS (Fig. 5D). Fig. 5E is the simulation diagram of SnO2, MoS2 and SnO2/MoS2 corresponding to the above theoretical calculation respectively. A simulation diagram of the electron transfer of the SnO2/MoS2 NS heterogeneous interface layer is shown in Fig. 6. Due to the small work function of SnO2, electrons can be injected into the MoS2 component at an accelerated rate, which increases the electron transfer rate between the interface; on the other hand, due to the large amount of competing reactions in the reaction liquid unsaturated S atom defects, the structure of nanosheets/nanoparticles and the introduction of the SnO2 increase the number of active sites and improve the hydrophilicity of the material, making H+ easier to be adsorbed and reduced and H2 desorbed.
Conclusions
To sum up, in order to construct an efficient and stable acidic HER electrocatalyst, using SnS2 nanosheets on carbon cloth as the precursor, we transformed SnS2 into SnO2 with hydrophilia and corrosion resistance through the competitive reaction for S2− between Mo4+ and Sn4+. At the same time, MoS2 nanoparticles were grown on SnO2 nanosheets to obtain a SnO2/MoS2 interface layer with fast electron transfer and proton adsorption. The result of high-magnification TEM and XPS proved that the nanosheet/nanoparticle structure and the competitive reaction in the reaction solution increased the number of MoS2 unsaturated sulfur defects and effectively prevented their aggregation; secondly, the interface contact angle test shows that the introduction of SnO2 improved the overall hydrophilicity of the material, being beneficial to the HER; finally, the interface layer formed by SnO2 and MoS2 can accelerate the injection of electrons into molybdenum disulfide and reduce the resistance to electron transfer between molybdenum disulfide layers, which is proved by UPS and theoretical calculation. The typical SnO2/MoS2 heterogeneous nanosheets maintain good activity and stability in acid electrolytes. At a current density of 10 mA cm−2, the overpotential of the SnO2/MoS2 is only 166 mV, having a significant performance improvement, compared with pure MoS2, pure SnO2 and pure SnS2. We have proposed a strategy for constructing an interface layer with fast electron transport and proton adsorption, providing some new ideas for the design of HER catalysts in acid electrolytes.Author contributions
Kun Huang: conceptualization, investigation, formal analysis, data curation, methodology, writing – original draft, and writing – review & editing. Lan Yang: conceptualization, investigation, formal analysis, data curation, and validation. Yihong Gao: theoretical calculation. Hui Zhang: methodology and investigation. Shikuo Li: methodology and investigation. Fangzhi Huang: conceptualization, data curation, formal analysis, funding acquisition, resources, and supervision.Conflicts of interest
There are no conflicts to declare.Acknowledgements
This work was supported by the National Natural Science Foundation of China (52172147 and 21771001), Key Projects of Quality Engineering Teaching and Research in Anhui Province (2018jyxm0365), the Key Natural Science Research Project of the Anhui Provincial Education Department (KJ2017A007), the Program of Anhui Scientific and Technical Leaders Reserve Candidates (2018H168), the Scholar Program for the Outstanding Innovative Talent of College Discipline (Specialty), and Open Fund for Discipline Construction, Institute of Physical Science and Information Technology, Anhui University.Notes and references
- Y. Wang, H. Su, Y. He, L. Li, S. Zhu, H. Shen, P. Xie, X. Fu, G. Zhou, C. Feng, D. Zhao, F. Xiao, X. Zhu, Y. Zeng, M. Shao, S. Chen, G. Wu, J. Zeng and C. Wang, Chem. Rev., 2020, 120, 12217–12314 CrossRef CAS PubMed.
- T. Kosmala, A. Baby, M. Lunardon, D. Perilli, H. Liu, C. Durante, C. Di Valentin, S. Agnoli and G. Granozzi, Nat. Catal., 2021, 4, 850–859 CrossRef CAS.
- L. Schlapbach and A. Züttel, Nature, 2001, 414, 353–358 CrossRef CAS PubMed.
- W. Yang and S. Chen, Chem. Eng. J., 2020, 393, 12472 CrossRef.
- Q. Zhu, Y. Qu, D. Liu, K. W. Ng and H. Pan, ACS Appl. Nano Mater., 2020, 3, 6270–6296 CrossRef CAS.
- A.-L. Wang, H. Xu and G.-R. Li, ACS Energy Lett., 2016, 1, 445–453 CrossRef CAS.
- H. Cheng, Y.-Z. Su, P.-Y. Kuang, G.-F. Chen and Z.-Q. Liu, J. Mater. Chem. A, 2015, 3, 19314–19321 RSC.
- M. Gu, X. Deng, M. Lin, H. Wang, A. Gao, X. Huang and X. Zhang, Adv. Energy Mater., 2021, 11, 2102361 CrossRef CAS.
- X. Chen, J. Wan, J. Wang, Q. Zhang, L. Gu, L. Zheng, N. Wang and R. Yu, Adv. Mater., 2021, 33, 2104764 CrossRef CAS PubMed.
- N. Han, K. R. Yang, Z. Lu, Y. Li, W. Xu, T. Gao, Z. Cai, Y. Zhang, V. S. Batista, W. Liu and X. Sun, Nat. Commun., 2018, 9, 924 CrossRef PubMed.
- X.-H. Lv, X.-Y. Wang, Y. Zhou, H. Xu and W.-M. Wan, Chem. Commun., 2019, 55, 9821–9824 RSC.
- Z. Chen, H. Qing, R. Wang and R. Wu, Energy Environ. Sci., 2021, 14, 3160–3173 RSC.
- A. P. Murthy, J. Madhavan and K. Murugan, J. Power Sources, 2018, 398, 9–26 CrossRef CAS.
- Y. Dang, T. Wu, H. Tan, J. Wang, C. Cui, P. Kerns, W. Zhao, L. Posada, L. Wen and S. L. Suib, Energy Environ. Sci., 2021, 14, 5433–5443 RSC.
- A. Li, H. Ooka, N. Bonnet, T. Hayashi, Y. Sun, Q. Jiang, C. Li, H. Han and R. Nakamura, Angew. Chem., Int. Ed., 2019, 58, 5054–5058 CrossRef CAS PubMed.
- J. Huang, H. Sheng, R. D. Ross, J. Han, X. Wang, B. Song and S. Jin, Nat. Commun., 2021, 12, 3036 CrossRef CAS PubMed.
- L. Wang, X. Duan, X. Liu, J. Gu, R. Si, Y. Qiu, Y. Qiu, D. Shi, F. Chen, X. Sun, J. Lin and J. Sun, Adv. Energy Mater., 2020, 10, 1903137 CrossRef CAS.
- J. Lim, D. Park, S. S. Jeon, C.-W. Roh, J. Choi, D. Yoon, M. Park, H. Jung and H. Lee, Adv. Funct. Mater., 2018, 28, 1704796 CrossRef.
- P. Wang, X. Zhang, J. Zhang, S. Wan, S. Guo, G. Lu, J. Yao and X. Huang, Nat. Commun., 2017, 8, 14580 CrossRef CAS PubMed.
- J. Xu, C. Zhang, H. Liu, J. Sun, R. Xie, Y. Qiu, F. Lü, Y. Liu, L. Zhuo, X. Liu and J. Luo, Nano Energy, 2020, 70, 104529 CrossRef CAS.
- X. Li, Y. Wang, J. Wang, Y. Da, J. Zhang, L. Li, C. Zhong, Y. Deng, X. Han and W. Hu, Adv. Mater., 2020, 32, 2003414 CrossRef CAS PubMed.
- W. Yang, S. Zhang, Q. Chen, C. Zhang, Y. Wei, H. Jiang, Y. Lin, M. Zhao, Q. He, X. Wang, Y. Du, L. Song, S. Yang, A. Nie, X. Zou and Y. Gong, Adv. Mater., 2020, 32, 2001167 CrossRef CAS PubMed.
- K. L. Zhou, C. Wang, Z. Wang, C. B. Han, Q. Zhang, X. Ke, J. Liu and H. Wang, Energy Environ. Sci., 2020, 13, 3082–3092 RSC.
- V.-T. Nguyen, G.-J. Lee, Q.-T. Ngo, O. Omelianovych, N.-A. Nguyen, V.-H. Trinh, H.-S. Choi, A. Mnoyan, K. Lee, L. L. Larina and G. Chen, Electrochim. Acta, 2021, 398, 139624 CrossRef.
- T. Sun, J. Dong, Y. Huang, W. Ran, J. Chen and L. Xu, J. Mater. Chem. A, 2018, 6, 12751–12758 RSC.
- Y. Gao, Z. Chen, Y. Zhao, W. Yu, X. Jiang, M. He, Z. Li, T. Ma, Z. Wu and L. Wang, Appl. Catal., B, 2022, 303, 120879 CrossRef CAS.
- S. Ali Shah, L. Xu, R. Sayyar, T. Bian, Z. Liu, A. Yuan, X. Shen, I. Khan, A. Ali Tahir and H. Ullah, Chem. Eng. J., 2022, 428, 132126 CrossRef CAS.
- H. Du, X. Zhang, Q. Tan, R. Kong and F. Qu, Chem. Commun., 2017, 53, 12012–12015 RSC.
- G. Shao, X.-X. Xue, B. Wu, Y.-C. Lin, M. Ouzounian, T. S. Hu, Y. Xu, X. Liu, S. Li, K. Suenaga, Y. Feng and S. Liu, Adv. Funct. Mater., 2020, 30, 1906069 CrossRef CAS.
- L. Hu, X.-F. Song, S.-L. Zhang, H.-B. Zeng, X.-J. Zhang, R. Marks and D. Shan, J. Catal., 2018, 366, 8–15 CrossRef CAS.
- T. Ali, X. Wang, K. Tang, Q. Li, S. Sajjad, S. Khan, S. A. Farooqi and C. Yan, Electrochim. Acta, 2019, 300, 45–52 CrossRef CAS.
- Q. He, S. Huang, M. Liu, P. Li, W. Sun and L. Hou, Inorg. Chem. Front., 2020, 7, 2660–2668 RSC.
- B. Liu, Y. Cheng, B. Cao, M. Hu, P. Jing, R. Gao, Y. Du, J. Zhang and J. Liu, Appl. Catal., B, 2021, 298, 120630 CrossRef CAS.
- Q. Zhang, H. Bai, Q. Zhang, Q. Ma, Y. Li, C. Wan and G. Xi, Nano Res., 2016, 9, 3038–3047 CrossRef CAS.
- X. Geng, W. Sun, W. Wu, B. Chen, A. Al-Hilo, M. Benamara, H. Zhu, F. Watanabe, J. Cui and T.-p. Chen, Nat. Commun., 2016, 7, 10672 CrossRef CAS PubMed.
- L. P. Hansen, Q. M. Ramasse, C. Kisielowski, M. Brorson, E. Johnson, H. Topsøe and S. Helveg, Angew. Chem., Int. Ed., 2011, 50, 10153–10156 CrossRef CAS PubMed.
- T. F. Jaramillo, K. P. Jørgensen, J. Bonde, J. H. Nielsen, S. Horch and I. Chorkendorff, Science, 2007, 317, 100 CrossRef CAS PubMed.
- B. Hinnemann, P. G. Moses, J. Bonde, K. P. Jørgensen, J. H. Nielsen, S. Horch, I. Chorkendorff and J. K. Nørskov, J. Am. Chem. Soc., 2005, 127, 5308–5309 CrossRef CAS PubMed.
- X. Liu, B. Li, F. A. Soto, X. Li, R. R. Unocic, P. B. Balbuena, A. R. Harutyunyan, J. Hone and D. V. Esposito, ACS Catal., 2021, 11, 12159–12169 CrossRef CAS.
- T. Ren, W. Tian, Q. Shen, Z. Yuan, D. Chen, N. Li and J. Lu, Nano Energy, 2021, 90, 106527 CrossRef CAS.
- L. Guo, Q. Liu, Y. Liu, Z. Chen, Y. Jiang, H. Jin, T. Zhou, J. Yang and Y. Liu, Nano Energy, 2022, 92, 106707 CrossRef CAS.
- S. Ravula, C. Zhang, J. B. Essner, J. D. Robertson, J. Lin and G. A. Baker, ACS Appl. Mater. Interfaces, 2017, 9, 8065–8074 CrossRef CAS PubMed.
- S. Ji, Z. Yang, C. Zhang, Z. Liu, W. W. Tjiu, I. Y. Phang, Z. Zhang, J. Pan and T. Liu, Electrochim. Acta, 2013, 109, 269–275 CrossRef CAS.
- E. W. Keong Koh, C. H. Chiu, Y. K. Lim, Y.-W. Zhang and H. Pan, Int. J. Hydrogen Energy, 2012, 37, 14323–14328 CrossRef CAS.
- X. Zhou, Y. Liu, H. Ju, B. Pan, J. Zhu, T. Ding, C. Wang and Q. Yang, Chem. Mater., 2016, 28, 1838–1846 CrossRef CAS.
- J. Wu, R. Zhao, H. Xiang, C. Yang, W. Zhong, C. Zhang, Q. Zhang, X. Li and N. Yang, Appl. Catal., B, 2021, 292, 120200 CrossRef CAS.
- S. Ravula, C. Zhang, J. B. Essner, J. D. Robertson, J. Lin and G. A. Baker, ACS Appl. Mater. Interfaces, 2017, 9, 8065–8074 CrossRef CAS PubMed.
- G. Liu, Y. Qiu, Z. Wang, J. Zhang, X. Chen, M. Dai, D. Jia, Y. Zhou, Z. Li and P. Hu, ACS Appl. Mater. Interfaces, 2017, 9, 37750–37759 CrossRef CAS PubMed.
- X. Xiao, Y. Wang, X. Xu, T. Yang and D. Zhang, Mol. Catal., 2020, 487, 110890 CrossRef CAS.
- Y. Huang, Y.-E. Miao, L. Zhang, W. W. Tjiu, J. Pan and T. Liu, Nanoscale, 2014, 6, 10673–10679 RSC.
- Y. Yu, J. Xu, J. Zhang, F. Li, J. Fu, C. Li and C. An, Nanomaterials, 2020, 10, 2337 CrossRef CAS PubMed.
- I. Roger, R. Moca, H. N. Miras, K. G. Crawford, D. A. J. Moran, A. Y. Ganin and M. D. Symes, J. Mater. Chem. A, 2017, 5, 1472–1480 RSC.
Footnotes |
| † Electronic supplementary information (ESI) available. See https://doi.org/10.1039/d2ra03627d |
| ‡ Contributed equally to this work. |
| This journal is © The Royal Society of Chemistry 2022 |

