
 Open Access Article
 This Open Access Article is licensed under a Creative Commons Attribution-Non Commercial 3.0 Unported Licence
Functional utilization of biochar derived from Tenebrio molitor feces for CO2 capture and supercapacitor applications†
Saier Wang,
Ying Shi,
Huiming Xiang,
Ru Liu,
Lianghu Su *,
Longjiang Zhang and
Rongting Ji*
*,
Longjiang Zhang and
Rongting Ji*
Nanjing Institute of Environmental Sciences, Ministry of Ecology and Environment, 8 Jiangwangmiao Street, Nanjing 210042, P. R. China. E-mail: sulianghu@126.com; jirongting@nies.org
First published on 15th August 2022
Abstract
Biochar has attracted great interest in both CO2 capture and supercapacitor applications due to its unique physicochemical properties and low cost. Fabrication of eco-friendly and cost-effective biochar from high potential biomass Tenebrio molitor feces can not only realize the functional application of waste, but also a potential way of future carbon capture and energy storage technology. In this study, a novel KOH activation waste-fed Tenebrio molitor feces biochar (TMFB) was developed and investigated in terms of CO2 capture and electrochemical performance. When activated at 700 °C for 1 h, the specific surface area of the feces biochar (TMFB-700A) increased significantly from 232.1 to 2081.8 m2 g−1. In addition, well-developed pore distribution facilitates CO2 capture and electrolyte diffusion. TMFB-700A can quickly adsorb a large amount of CO2 (3.05 mol kg−1) with excellent recycling performance. TMFB-700A also exhibited promising electrochemical performance (335.8 F g−1 at 0.5 A g−1) and was used as electrode material in a symmetrical supercapacitor. It provided a high energy density of 33.97 W h kg−1 at a power density of 0.25 kW kg−1 with 90.47% capacitance retention after 10![[thin space (1/6-em)]](https://www.rsc.org/images/entities/char_2009.gif) 000 charge–discharge cycles. All the results demonstrated that TMFB could be a potential bifunctional material and provided valuable new insights for Tenebrio molitor feces high-value utilization.
000 charge–discharge cycles. All the results demonstrated that TMFB could be a potential bifunctional material and provided valuable new insights for Tenebrio molitor feces high-value utilization.
Introduction
According to the latest global assessment of climate change mitigation progress provided by the Intergovernmental Panel on Climate Change (IPCC), greenhouse gas emissions are continuing to increase world wide.1 CO2, the largest share of greenhouse gases (74.5%), has increased in atmospheric concentrations by about 50% from pre-industrial levels of 280 ppm.2,3 It is the major contributor to global warming, causing irreversible damage to climate, environment, and ecosystems. The goal of keeping global warming below 2 °C or even 1.5 °C seems largely unattainable without immediate CO2 emission reduction.4 On the one hand, CO2 capture technology is considered the most direct and cost-effective way to reduce CO2 emissions in the short or medium term due to high energy utilization efficiency, small energy requirements, and simple operation.5 On the other hand, developing energy storage technologies to reduce reliance on fossil fuel combustion is a fundamental way for CO2 emission reduction.6,7 With high power/energy density, long cycle life, and fast charge/discharge rates, supercapacitors can be used as promising energy storage devices to meet the growing power demand of energy storage systems in the 21st century.8,9Whether CO2 capture or supercapacitor, the development and breakthrough of technology depends on the renewal of materials. Among new materials, biochar, as a renewable carbon source, has a large specific surface area and well-developed pore volume, which is not only beneficial to CO2 capture but also to electrolyte diffusion.10,11 In addition, biochar has stable physicochemical properties, good electrical conductivity, and low resistance.12 Therefore, they can be used as both CO2 capture materials and electrode materials for supercapacitor. Carbonaceous materials such as agricultural and forestry waste and municipal waste can be used as raw materials to prepare biochar.13 Hence, the cost of biochar is only ∼1/10 of other CO2 capture or supercapacitor materials.14 Moreover, the process of converting solid waste to biochar and then to applications belongs to carbon utilization, which also contributes to the reduction of greenhouse gases and reflects the circular economy.15 Currently, there have been some studies confirmed that the CO2 capture or supercapacitor applications performance of biochar depends on physical and chemical properties, such as specific surface area, porosity, basicity of surface, surface functional groups, presence of metals, degree of graphitization and structural defects density.16,17 These properties of biochar are mainly affected by biomass precursor, pretreatment, pyrolysis temperature, activation and modification.18 However, to the best of our knowledge, most of the research in biochar basically focused on a single application instead of synergistic characteristic terms of supercapacitors and CO2 capture performance.
Tenebrio molitor was regarded by the Food and Agriculture Organization of the United Nations as a new type of high-protein edible insect and a future food source in 2003 and has attracted people's attention in recent years.19,20 The scale of Tenebrio molitor breeding has been increasing yearly because of the vigorous promotion by governments of various countries.21 Tenebrio molitor breeding also has environmental benefits, as agricultural waste can be used directly as feed.19,20 Tenebrio molitor will convert 20–50% of the feed into feces, implying that a large number of feces will be produced in large-scale breeding.22 Unlike other animal feces, Tenebrio molitor feces (TMF) have high trace element content, less water content and no peculiar smell, indicating a potential biomass resource.23–25 TMF is often used directly as fertilizer, but its fertility is limited and may cause seedling burnt without fermentation. Compared with traditional composting and anaerobic digestion, converting TMF into biochar through pyrolysis treatment under anaerobic or oxygen-limited conditions can process a large number of feces within a period of time while providing potential materials. A highly aromatized Tenebrio molitor frass biochar synthesized by Yang et al. has a high specific surface area (238.37 m2 g−1) and good adsorption performance for dyes.26,27 However, the application capacity of raw biochar is very limited and there is a lack of in-depth studies on potential TMF biochar. Various activation methods can be used further to increase the specific surface area of TMF biochar, optimize its pore structure and enhance its functionality.28 Therefore, the development of functional TMF biochar using activation for CO2 capture and supercapacitor is the key to the high-value utilization of TMF.
Herein, Tenebrio molitor was fed with fruit waste, and its feces were collected to prepare TMF biochar through pyrolysis and KOH activation. It is worth noting that the Tenebrio molitor feces were selected as a biomass precursor because they have low cost, extensive availability and great potential, and are rarely reported. The physical and chemical properties (specific surface area, surface functional groups, micromorphology, etc.) changes of the prepared TMF biochar under different activation temperature were characterized and analyzed. The CO2 capture capacity and regeneration capacity of TMF biochar were evaluated and compared with other reported biochar. The specific capacitance, stability and energy/power density of TMF biochar were tested in three- and two-electrode systems and an attempt was made to reveal the relationship between electrochemical performance and structure. This study proposed a clean production pathway to convert TMF into functional biochar and offer valuable new insights for resource utilization of TMF.
Experimental
Biochar preparation and activation
Tenebrio molitor was cultivated at the insect-rearing laboratory in Huangshan, Anhui province, China (Fig. S1†). The laboratory was adjacent to a fruit planting base, ensuring the feed source of waste fruit for Tenebrio molitor. Fresh TMF were sieved through a 0.42 mm mesh size and then soaked in 1 M HCl for 12 h to remove impurities. Then, TMF were washed with deionized water until the neutrality was reached, and dried in an oven at 105.0 °C for 6 h. The TMF biochars (TMFB) were prepared via pyrolysis at 500.0 °C (reactor temperature) for 60 min with a heating rate of 10.0 °C min−1 in a muffle furnace (HPM-2G, AS ONE Corp., Japan) under an N2 atmosphere, with a yield of 73.8%.For activation, the TMFB was further mixed homogeneously with KOH at a mass ratio of 1:4 and activated at 600.0 °C, 700.0 °C, and 800.0 °C (reactor temperature) for 1 h using a muffle furnace (HPM-2G, AS ONE Corp., Japan) under N2. After cooling, the activated TMFB was ultrasonically cleaning to remove KOH with deionized water and dried at 105 °C for 6 h, with yields of 75.2%, 63.7%, and 46.6% at 600.0 °C, 700.0 °C, and 800.0 °C. The TMFB samples activated at 600.0 °C, 700.0 °C, and 800.0 °C were named TMFB-600A, TMFB-700A, and TMFB-800A, respectively.
Material characterization and instrument specifications
10.0 g of TMF was dispersed in 25 mL of deionized water and left for 30 minutes, the supernatant was used to test the pH. The pH values were measured using a pH meter (S470 SevenExcellence, Mettler Toledo, Switzerland). The mass (M1) and uncompacted volume (V1) of biochars were determined using an analytical balance and a graduated cylinder, and bulk density was calculated as M1/V1.29 Metal content analysis was performed via inductively-coupled plasma mass spectrometry (ICP-MS, Agilent 7700, Agilent Technologies Inc., USA) after acid digestion pre-treatment. X-ray diffraction (XRD) was used to analyze the surface-phase composition of the biochar sample (D8, Bruker, Germany) using an accelerating voltage of 40.0 kV and current of 40.0 mA over a 2θ range of 5.0°–80.0°. Graphite monochromatic Cu Kα radiation was used. Fourier transform infrared spectroscopy (FT-IR) was performed in the 4000.0–400.0 cm−1 range (Spectrum 200, PerkinElmer, USA) to analyze the functional groups within the samples. Raman spectra were collected using a Raman spectrophotometer (HR800, HORIBA, Japan) with 514.5 nm laser radiation in the 500.0–3000.0 cm−1 range. De-baseline and integration areas of the Raman spectrum were manipulated in PeakFit software. The surface functionalities of the sample were obtained via X-ray photoelectron spectroscopy (XPS) using a photoelectron spectrometer (ESCALAB 250Xi, Thermo Scientific, USA) and calibrated with the C 1s peak. The XPS of materials were deconvoluted and peak-fitted in Advantage software. The morphologies of the resulting biochar samples were characterized via scanning electron microscopy (SEM, Regulus 8230, Hitachi, Japan) and transmission electron microscopy (TEM, Talos 120 L, ThermoScientific, USA). The adsorption/desorption isotherm of N2 at 77.0 K was obtained using a surface area and pore size analyzer (ASAP 2460, Micrometrics, USA). The Brunauer–Emmett–Teller (BET) theory was used to calculate the total specific surface area and the Barret–Joyner–Halenda (BJH) model was used for pore size analysis.30CO2 capture measurements
The CO2 capture capacity of the biochar sample was determined by a volumetric adsorption analyzer (ASAP 2460, Micrometrics, USA) at 25.0 °C and 0.1 MPa. Before each measurement, the sample was degassed under vacuum (10.0 μm Hg) at 150.0 °C for 12 h. The gravimetric CO2 capture capacity of the biochars was assessed using a thermogravimetric analyzer (TGA, DSC 3+, Mettler Toledo, Switzerland). Under N2 flowing at 80.0 mL min−1, 5.0 mg of biochar sample was placed in TGA where it was heated to 120.0 °C at 5.0 °C min−1 for 1 h to remove pre-adsorbed gas molecules such as water vapor. The temperature was lowered to 30.0 °C under a continuous N2 flow and the temperature was maintained for 2 h. Then, CO2 was flowed at 50.0 mL min−1 for 2 h for the capture test to ensure that capture equilibrium was reached. The TGA was also used to evaluate the recyclability of the biochar. The same pretreatment and stabilization conditions used for gravimetric CO2 capture capacity were applied to the cycling stability test. After pretreatment, 10 cycles of adsorption and desorption were performed. Each cycle consisted of adsorption for 1 h under flowing CO2 (50.0 mL min−1) followed by desorption for 1.5 h under an N2 purge (80.0 mL min−1).Electrochemical measurement
Electrochemical performance tests of biochars were carried out using an electrochemical workstation (CHI 760E, Shanghai Chenhua Inc, China) at 25.0 °C. The main tests were cyclic voltammetry (CV), constant current charge and discharge (GCD), alternating current impedance (EIS), and cycling performance tests. The working electrode for the traditional three-electrode system was prepared as follows: 75.0 mg of the active sample and 15.0 mg of acetylene black were ground for 20 min, and then 10.0 mg of adhesive PTEF was added. The mixed sample was dissolved in isopropanol and stirred for 24 h, and the as-obtained slurry was applied to a 1.0 × 1.0 cm2 region on the surface of the foamed nickel. A mass load of 2.0–4.0 mg cm−2 was used. The coated nickel foam was dried at 75.0 °C for 2 h and pressed into thin foil at a pressure of approximately 10.0 MPa to obtain a working electrode. A three-electrode system was constructed with platinum wire used as the counter electrode, saturated calomel as the reference electrode, and 6.0 M KOH as the electrolyte.TMFB, TMFB-600A, TMFB-700A, and TMFB-800A were used as positive and negative electrodes during the manufacture of aqueous symmetrical supercapacitor devices. The electrochemical performance of the two-electrode electrochemical full cell was measured at 25.0 °C with 6.0 M KOH as the electrolyte.
Equations
The mathematical expression of Langmuir equation is as follows:
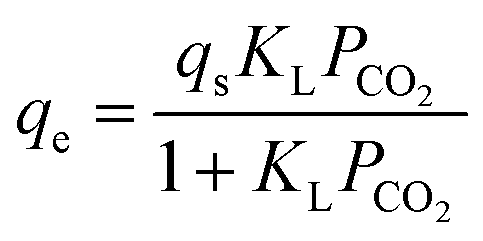 | (1) |
The mathematical expression of Langmuir equation is as follows:
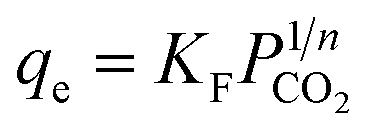 | (2) |
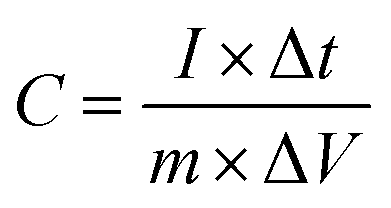
Specific capacitances C derived from galvanostatic charge–discharge (GCD) tests can be determined using the equation:
 | (3) |
The specific capacitance (Ccell, F g−1), energy density (E, W h kg−1) and power density (P, W kg−1) of the symmetric supercapacitor device were calculated with the following equations:
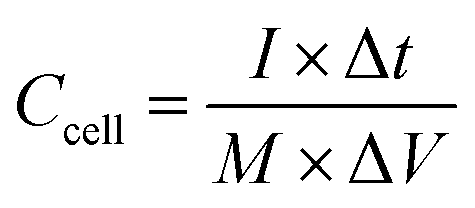 | (4) |
 | (5) |
 | (6) |
Results and discussion
Characteristics of TMF and TMFB
The basic physical and chemical properties of TMF were shown in Table 1. The pH of TMF was close to neutral (6.8). Compared with other animal manure (Table S1†), TMF had a lower moisture content of 8.2%.31 Besides, the bulk density of the TMF was 0.36 g cm−3, and the volatile solid (VS) value of 84.45% indicated a lighter texture and higher organic content. Metal elemental analysis showed that the TMF was rich in trace metal elements but did not include highly toxic heavy metals such as Cd, Hg, Pb, and Cr. Compared to the physical and chemical properties of TMFB and activated TMFB displayed in Table 2, the pH values of TMFB and activated TMFB increased from 6.86 to 8.63 and over 10, which caused by the exposure of surface alkali functional groups and alkali metals.32 The density decreased as pyrolysis proceeded and the activation temperature increased, indicating that the structure of the biochar became looser.| Parameter | TMF | Parameter | TMF |
|---|---|---|---|
| pH | 6.86 ± 0.03 | Fe (mg kg−1) | 307.48 |
| Moisture content (%) | 8.2 ± 0.59 | Hg (mg kg−1) | 0.01 |
| VS (%) | 84.45 ± 1.16 | K (mg kg−1) | 14452.09 |
| Density (g cm−3) | 0.36 | Mg (mg kg−1) | 5833.16 |
| Al (mg kg−1) | 99.86 | Mn (mg kg−1) | 177.26 |
| Ba (mg kg−1) | 23.43 | Na (mg kg−1) | 124.26 |
| Ca (mg kg−1) | 1751.89 | Ni (mg kg−1) | 3.81 |
| Cr (mg kg−1) | 0.16 | P (mg kg−1) | 9701.55 |
| Cd (mg kg−1) | 0.02 | Pb (mg kg−1) | 0.07 |
| Cu (mg kg−1) | 16.24 | Si (mg kg−1) | 47.88 |
| Zn (mg kg−1) | 95.50 |
| Parameter | TMFB | TMFB-600A | TMFB-700A | TMFB-800A |
|---|---|---|---|---|
| a Means BET surface area.b Means micropore surface area.c Means micropore volume.d Means total pore volume.e Means average pore diameters. | ||||
| pH | 8.63 ± 0.01 | 11.01 ± 0.05 | 10.11 ± 0.03 | 10.40 ± 0.05 |
| Density (g cm−3) | 0.24 | 0.20 | 0.18 | 0.18 |
| SBET (m2 g−1)a | 232.1 | 1267.9 | 2081.8 | 1959.3 |
| Smicropore (m2 g−1)b | 222.7 | 1164.6 | 1544.5 | 890.4 |
| Vmicropore (cm3 g−1)c | 0.108 | 0.557 | 0.671 | 0.362 |
| Vtotal (cm3 g−1)d | 0.13 | 0.63 | 1.07 | 1.17 |
| Dap(nm)e | 2.3 | 2 | 2.1 | 2.4 |
TMFB composition analysis
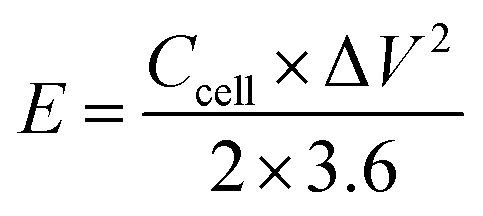
Fig. 1a showed the XRD spectra of the biochar materials. The diffraction pattern for TMFB showed broad amorphous features. There were no peaks indicative of crystalline phases other than two broad peaks at 23° and 43° associated with the (002) crystal plane of amorphous carbon.33 The intensities of the two broad peaks weaken significantly in diffraction pattern of activated TMFB, suggesting that high-temperature activation can increase the graphitization degree of biochar material.34 Besides, the reaction between alkali metals on the surface of biochar and KOH at high temperature during high temperature activation significantly changed the mineralogical properties of TMFB. The diffraction pattern for activated TMFB had two sharp peaks at 19.8° and 34.4°, corresponding to scarbroite (Al5(OH)13(CO3)·5H2O) and thaumasite ([Ca3Si(OH)6·12H2O](SO4)(CO3)) phases. As the activation temperature increased, more and higher mineral peaks can be observed in the XRD spectrum. Additional sharp peaks appearing at 28.5° and 40.2° in the diffraction pattern of TMFB-700A and TMFB-800A can be indexed to plagioclase (Na1−xCax[(Al1+xSi3−x)O8]) and calcite (CaCO3) phase.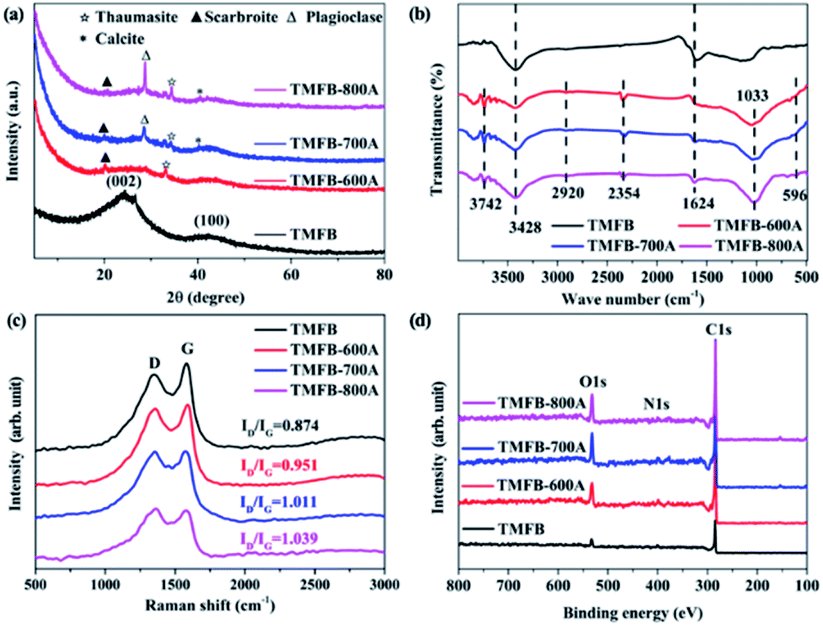 | ||
| Fig. 1 Characterization of TMFB, TMFB-600A, TMFB-700A, and TMFB-800A. (a) XRD patterns; (b) FT-IR spectra; (c) Raman spectra; and (d) XPS survey. | ||
In Fig. 1b, the FT-IR spectra of TMFB had only two peaks. The broad peak at 3428 cm−1 corresponded to the stretching vibration of –OH and the peak at 1624 cm−1 corresponded to the stretching vibrations of C![[double bond, length as m-dash]](https://www.rsc.org/images/entities/char_e001.gif) O and CC. After activation by alkali metal and KOH at high temperatures, more functional groups were exposed and remain on the surface. The peaks of the FT-IR spectra of the three activated TMFB were all similar. The appearance of more basic functional groups corresponded to the increase in pH. The sharp peak at 3742 cm−1 corresponded to the –NH2 stretching vibration, the weak peak at 2920 cm−1 corresponded to the –CH3 stretching vibration, and the broad peak at 1023 cm−1 corresponded to the ester group stretching vibration. The peak at 2354 cm−1 corresponded to the CO2 stretching vibration and the band below 600 cm−1 appeared because of the M–X stretching vibration of inorganic halogen salts (such as KCl and CaCl2).35 Raman spectroscopy was further used to analyze the ratio of crystalline carbon to amorphous carbon in the TMFB and activated TMFB samples. As shown in Fig. 1c, all biochar samples exhibited two peaks attributable to D and G bands near 1349 and 1583 eV. After activation, the Id/Ig value of the biochar sample increased from 0.874 to 0.951 and further increased to 1.039 with the increase in the activation temperature. This indicated that the proportion of crystalline carbon increased with the activation temperature.36 The high ratio also suggested an increased defect density in the activated TMFB sample.37
O and CC. After activation by alkali metal and KOH at high temperatures, more functional groups were exposed and remain on the surface. The peaks of the FT-IR spectra of the three activated TMFB were all similar. The appearance of more basic functional groups corresponded to the increase in pH. The sharp peak at 3742 cm−1 corresponded to the –NH2 stretching vibration, the weak peak at 2920 cm−1 corresponded to the –CH3 stretching vibration, and the broad peak at 1023 cm−1 corresponded to the ester group stretching vibration. The peak at 2354 cm−1 corresponded to the CO2 stretching vibration and the band below 600 cm−1 appeared because of the M–X stretching vibration of inorganic halogen salts (such as KCl and CaCl2).35 Raman spectroscopy was further used to analyze the ratio of crystalline carbon to amorphous carbon in the TMFB and activated TMFB samples. As shown in Fig. 1c, all biochar samples exhibited two peaks attributable to D and G bands near 1349 and 1583 eV. After activation, the Id/Ig value of the biochar sample increased from 0.874 to 0.951 and further increased to 1.039 with the increase in the activation temperature. This indicated that the proportion of crystalline carbon increased with the activation temperature.36 The high ratio also suggested an increased defect density in the activated TMFB sample.37
XPS revealed that the main constituent elements of the four materials were C and small amounts of O and N (Fig. 1d). The C 1s, N 1s, and O 1s XPS of TMFB and activated TMFB were shown in Fig. S2.† The four peaks at binding energies of ∼289.57 eV (CO), ∼286.84 eV (C–O), 285.99 eV (C–N), and ∼284.61 eV (C–C) were observed in the C 1s spectra of the four biochar materials.38 Additional peaks were observed in the C 1s spectrum of TMFB-600A at ∼292.89 eV, TMFB-700A at ∼293.01 eV, and TMFB-800A at 293.14 eV. The peaks became more obvious as the activation temperature increased. This was the characteristic π–π* shakedown feature peak, which further showed that the degree of material graphitization increases after activation and was consistent with the Raman and XRD analysis results.39 Three peaks located at ∼402.11 eV (graphitic N), ∼399.67 eV (pyrrolic N), and ∼397.61 eV (pyridinic N) were observed in the N 1s spectra of the four materials. After activation, the pyridinic N content increased and the graphitic N content decreased. The O 1s spectra of the four materials were all similar. Four peaks were observed at ∼534.22 eV (–OH), ∼533.19 eV (C–OH or C–O–O), ∼531.75 eV (C–O), and ∼530.79 eV (CO).
Microscopic morphology analysis
SEM and TEM were used to study the surface morphology and porous structure of TFMB and activated TFMB samples. In Fig. 2, TMFB essentially showed the smooth surface morphology composing of closely packed carbon sheets almost without any pores. When activated at 600 degrees, the redox reaction between KOH and carbon (eqn (7)) caused the structural cleavage of TMFB from large carbon sheets to small irregular blocks with a particle size of ∼10 μm. The small particles on the surface of the activated TMFB sample probably derived from metals (such as K, Ca, and Al) present in the biomass precursor.40,41 After activation at 700 °C, the surface of TMFB-700A become rough and the unique honeycomb-shaped pits formed via KOH etching can be observed. At this time, KOH was basically reacted completely, while the generated K2CO3 decomposed to produce CO2, which further activated the biochar material through physical activation (eqn (8) and (9)). Gas generation greatly contributed to the formation of the rich porous structure of TMFB-700A. When the activation temperature continued to increase to 800 °C, the potassium compounds (K2CO3, K2O) were reduced by carbon to produce potassium vapor in the singlet state further etching biochar (eqn (10) and (11)). As the carbon blocks were cracked further and become smaller but thicker, the microporous structure collapsed, and the densely distributed small pits on the surface transformed into large pits. TEM observation further reveals the essential structure of carbon sheets grounded from TMFB and activated TMFB. Moreover, rough edges and abundant pores are observed in the TEM image of TMFB-700A but not in the TEM images of TMFB-600A or TMFB-800A.| 6KOH + 2C → 2K + 2K2CO3 + 3H2 | (7) |
| K2CO3 → K2O + CO2 | (8) |
| CO2 + C → 2CO | (9) |
| K2CO3 + 2C → 2K + 3CO | (10) |
| K2O + C → 2K + CO | (11) |
 | ||
| Fig. 2 SEM images: (a and b) TMFB; (d and e) TMFB-600A; (g and h) TMFB-700A; and (j and k) TMFB-800A. TEM images: (c) TMFB; (f) TMFB-600A; (i) TMFB-700A; and (l) TMFB-800A. | ||
N2 adsorption isotherms and pore size distributions
The N2 adsorption–desorption curves and pore size distributions were shown in Fig. S3.† The four types of biochar exhibited Type-I N2 adsorption–desorption curves.42 The N2 adsorption–desorption isotherm of activated TMFB rose rapidly in the 0 < P/P0 < 0.1 low-pressure zone, further indicating the presence of a large number of micropores. These activated micropores derived from KOH activation improved the specific surface areas of the carbon materials substantially. The N2 adsorption–desorption isotherm in the medium-pressure zone (0.1 < P/P0 < 0.5) also exhibited a significant upward trend. This indicated that the prepared carbon materials have mesopores. When the activation temperature increased to 800 °C, the TMF-800A N2 adsorption–desorption isotherm retained a small amount of adsorption in the high-pressure zone (0.5 < P/P0 < 1). This indicated that high-temperature activation made the micropores collapse to form a macroporous structure. The pore size distribution map confirmed that the number of micropores in the activated biochar sample increased significantly and that TMF-800A had significantly fewer micropores than TMF-700A after activation at 800 °C. In summary, an activation temperature of 700 °C can ensure that the TMF was fully activated, while also avoiding the harm to the specific surface area of the carbon material that was noted at higher temperatures. The surface structural characteristics of TMFB and activated TMFB were shown in Table 2. Before activation, the specific surface area of TMFB was only 232.1 m2 g−1, the micropore surface area was 222.7 m2 g−1, and the total pore volume is 0.13 cm3 g−1. After KOH activation, the surface properties of the biochar increased sharply. Upon activation at 600 °C, the specific surface area increased to 1267.9 m2 g−1, the micropore surface area increased to 1164.6 m2 g−1, and the total pore volume increased to 0.63 cm3 g−1. When activated at 700 °C, the specific surface area reached its maximum of 2081.9 m2 g−1 and the total pore volume increased to 1.06 cm3 g−1. These values were almost ten times those of biochar before activation. The micropore surface area increased to 1544.6 m2 g−1, which was almost seven times that before activation. After activation at 800 °C, the specific surface area decreased to 1959.3 m2 g−1. Although the total pore volume increased to 1.17 cm3 g−1, the micropore surface area decreased to 890.4 m2 g−1 and the micropore volume decreased to 0.362 cm3 g−1. This further demonstrated that continuing to increase the temperature caused the microporous structure to be destroyed and became macroporous.In Table S2,† the BET specific surface areas of TMF and TMFB-700A were compared with those of other biochar materials derived from animal manure precursors. TMF had a higher specific surface area than other unactivated animal manure biochar materials. It reached a value associated with activated forms of other animal manure biochars. It had been reported that the specific surface area of animal feces biochar was approximately 100–200 m2 g−1 after activation.31,43–46 The TMFB-700A with the highest specific surface area in this study had a surface area that was 10–20 times those of other activated animal manure biochars.47–49
CO2 capture on TMFB
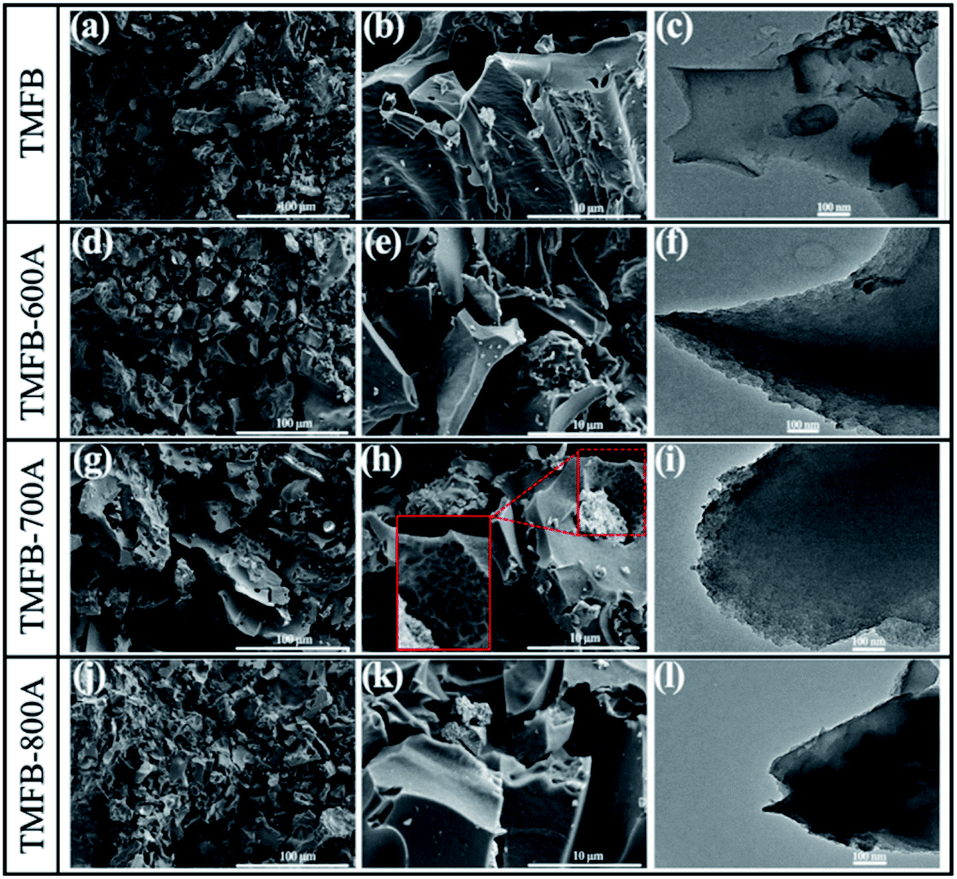
CO2 capture capacity tests of TMFB and activated TMFB were performed and the experimental data were fitted by both Freundlich (Fig. 3a) and Langmuir (Fig. 3b) models.50 The adsorption equation parameters were reported in Table S3.† Apparently, the CO2 capture capacities of TMFB and activated TMFB were positively correlated with the PCO2, which was consistent with the PCO2 being the thermodynamic driving force of the adsorption process. The fitted curves of both Freundlich and Langmuir models showed good agreement with the experimental adsorption isotherms of TMFB and activated TMFB, with fitted correlation coefficients (R2) larger than 0.98. For activated TMFB, Freundlich equation seemed to be more appropriate for the entire partial pressure range, implying that heterogeneous adsorption was distributed on the biochar surface.51 Since the n parameter was always larger than 1, the CO2 adsorption on activated TMFB was mainly physical. | ||
| Fig. 3 Adsorption isotherms of CO2 on TMFB, TMFB-600A, TMFB-700A, and TMFB-800A fitted by (a) Langmuir and (b) Freundlich models; (c) gravimetric CO2 adsorption of TMFB, TMFB-600A, TMFB-700A, and TMFB-800A at 30.0 °C and 0.1 MPa; (d) gravimetric CO2 uptake over 10 adsorption–desorption cycles in TGA at 30.0 °C and 0.1 MPa. | ||
The CO2 capture capacities of TMF, TMFB-600A, TMFB-700A, and TMFB-800A at 0.1 MPa were 1.64, 2.09, 3.05, and 2.59 mol kg−1, respectively. Among activated TMFB, TMFB-700A exhibited the best capture capacity. It can be seen from Fig. 3c that all biochars exceed 90% of their maximum capture capacities after 20 min, showing a rapid adsorption speed. TMFB-700A also exhibited the largest capture capacity in gravimetric CO2 adsorption test. Its saturation value of 2.9 mol kg−1 at 30 min was consistent with the capture isotherm. In addition, TMFB-700A was selected for further evaluation of its CO2 adsorption and desorption cycling stability (Fig. 3d). TMFB-700A maintained more than 99% of its initial capture capacity for 10 consecutive cycles, indicating that it can be regenerated easily and had excellent adsorption–desorption kinetics. Compared with the CO2 capture performance of other biochar materials currently reported in Table S4,† TMFB-700A showed superior performance. The excellent CO2 capture performance of TMFB-700A should be attributed to the high specific surface area and well-developed pore structure. Besides, it could also be due to the following factors: (1) O-containing (i.e., carbonyl, ether, carbonyl, and hydroxyl) or N-containing (amino) functional groups on the surface of biochar produced strong electrostatic interactions with CO2 molecules and provide additional adsorption sites.52 (2) The N-containing sites (pyridine N, oxidized N, and graphitic N) not only enhanced the surface affinity between basic sites and CO2 but also generated π interactions with CO2.53,54 (3) Alkali metals on the biochar surface decorated as electron donors enhanced the adsorption of CO2 as electron acceptors.55
Electrochemical performance
In order to explore the electrochemical performance of activated TMFB, the CV and GCD tests of three electrodes assembled from TMFB-600A, TMFB-700A, and TMFB-800A were carried out in an alkaline electrolyte. The CV curves of the three biochar materials were approximately rectangular, which was the sign of electric double-layer capacitance (EDLC) (Fig. S4a–c†). As the scanning speed increased, the TMFB-600A CV gradually deviated from rectangular but those of TMFB-700A and TMFB-800A remain rectangular. This indicated that TMFB-700A and TMFB-800A can offer good rate performance. In contrast, the pores within TMFB-600A were not as well developed as those within TMFB-700A and TMFB-800A. At high scanning speeds, the charging and discharging times were too short for ions to diffuse into the interiors of their pore networks. A pair of weak redox peaks were observed in the CV curves of the three biochar materials (∼0.4 V), which were related to pseudocapacitance introduced by carboxyl groups, carbonyl groups, and metal elements.56 As shown in Fig. S4d–f,† the GCD curves of the three biochar materials were standard triangles. This was consistent with the CV curve and also a sign of EDLC. The charge and discharge curves of TMFB-600A, TMFB-700A, and TMFB-800A all exhibited good symmetry at different current densities. This further verified that activated TMFB exhibited good capacitance behavior.In Fig. 4a and b, the CV curves of TMFB-600A, TMFB-700A, and TMFB-800A at the same sweep speed and their GCD curves at the same current density were compared. The areas enclosed by the CV curve and the GCD curve discharge time were proportional to the specific surface areas of the three materials. This indicated that the ultra-high specific surface areas provided sufficient adsorption and desorption space for ions.57 It also indicated that the specific surface area utilization rate of activated TMFB was quite high. The relationship between the specific capacitance calculated from the GCD curve and the current density of activated TMFB was shown in Fig. 4c. Overall, TMFB-700A offered the highest specific capacitance. This was consistent with the previous analysis and indicates that it had the best electrochemical performance. At a current density of 0.5 A g−1, the reversible specific capacitances of TMFB-600A, TMFB-700A, and TMFB-800A were as high as 155.8, 335.8, and 216.2 F g−1, respectively. When the current density is 10 A g−1, the reversible specific capacitances of TMFB-600A, TMFB-700A and TMFB-800A were still 110.0, 273.0, and 164.0 F g−1, respectively, and the capacitance retention rates were 70.6%, 81.3%, and 75.9%, respectively.
 | ||
| Fig. 4 (a) Comparison of the CV curves of the three biochar materials. The CV curves were measured at a scan rate of 30 mV s−1. (b) Comparison of the GCD curves of three biochar materials at a current density of 1 A g−1. (c) Specific capacitances of three biochar materials at various current densities. (d) Impedance Nyquist plots of three biochar materials. | ||
To obtain further information on the resistance of activated TMFB, electrochemical impedance spectroscopy (EIS) measurements were performed on three biochar materials at an open circuit potential in the 0.1 Hz to 100 kHz frequency range. As shown in Fig. 4d, the Nyquist diagrams of activated TMFB all included a semicircle in the low-frequency region and a diagonal line in the high-frequency region. The electrolyte resistance and the contact resistance between the active material and the nickel foam were included in the equivalent series resistance (Rs), which can be represented by the first intercept of the real axis in the high-frequency range. The diameter of the semicircle in the high-frequency region can be calculated via the simulation to calculate the charge transfer resistance (Rct), which represented the electron transfer performance of the material. After simulation and calculation in ZView software (Fig. S5†), the Rs values of TMFB-600A, TMFB-700A, and TMFB-800A were 0.71, 0.49, and 0.70 Ω, respectively, and the Rct values were 0.02, 0.09, and 0.05 Ω, respectively. Due to the low electrical resistances of the three biochar materials, these materials had good electrical conductivity.
In practical applications, supercapacitors were assembled from two electrodes. In order to evaluate the practical application of activated TMFB in supercapacitors further, we used two TMFB-700A electrode plates of the same quality to assemble a simple TMFB-700A//TMFB-700A symmetrical capacitor. According to Fig. 5a, the TMFB-700A//TMFB-700A CV curve was approximately rectangular and consistent with the three-electrode system. Moreover, the CV curve remained perfectly rectangular at a high scanning speed of 500 mV s−1. This indicated that the interface between the TMFB-700A electrode and the electrolyte can still form an electric double layer at high magnification quickly (Fig. S6†). As shown in Fig. 5b, the symmetrical capacitor assembled from TMFB-700A exhibited symmetrical charge and discharge curves. This further demonstrated that TMFB-700A//TMFB-700A had excellent electric double-layer capacitance characteristics. From the GCD curve calculation (Fig. 5c) performed with a current density of 0.5 A g−1, the reversible capacitance of TMFB-700A//TMFB-700A was 244.59 F g−1. Even when the current density increased by 40 times to 20 A g−1, the specific capacitance of TMFB-700A//TMFB-700A was 150 F g−1 and the capacitance retention ratio was 80.1%. This demonstrated the excellent rate performance of the material. A comparison of the three- and two-electrode test results indicated that the specific capacitance of the three-electrode system was significantly higher than that of the two-electrode system. This phenomenon can be attributed to the potential window. The potential window of the two-electrode system was attributed to the two TMFB-700A electrodes. In the three-electrode system, the TMFB-700A electrode was equivalent to charging and discharging in a complete voltage range. Thus, there was a difference between the two- and three-electrode test results. The energy transfer efficiency of TMFB-700A//TMFB-700A was measured and the results are shown in Fig. 5d. The energy transmission efficiency of TMFB-700A//TMFB-700A exceeded 90% at each current density (except 88.3% at 0.5 A g−1) and reached a maximum of 98.8% (at 6 A g−1).
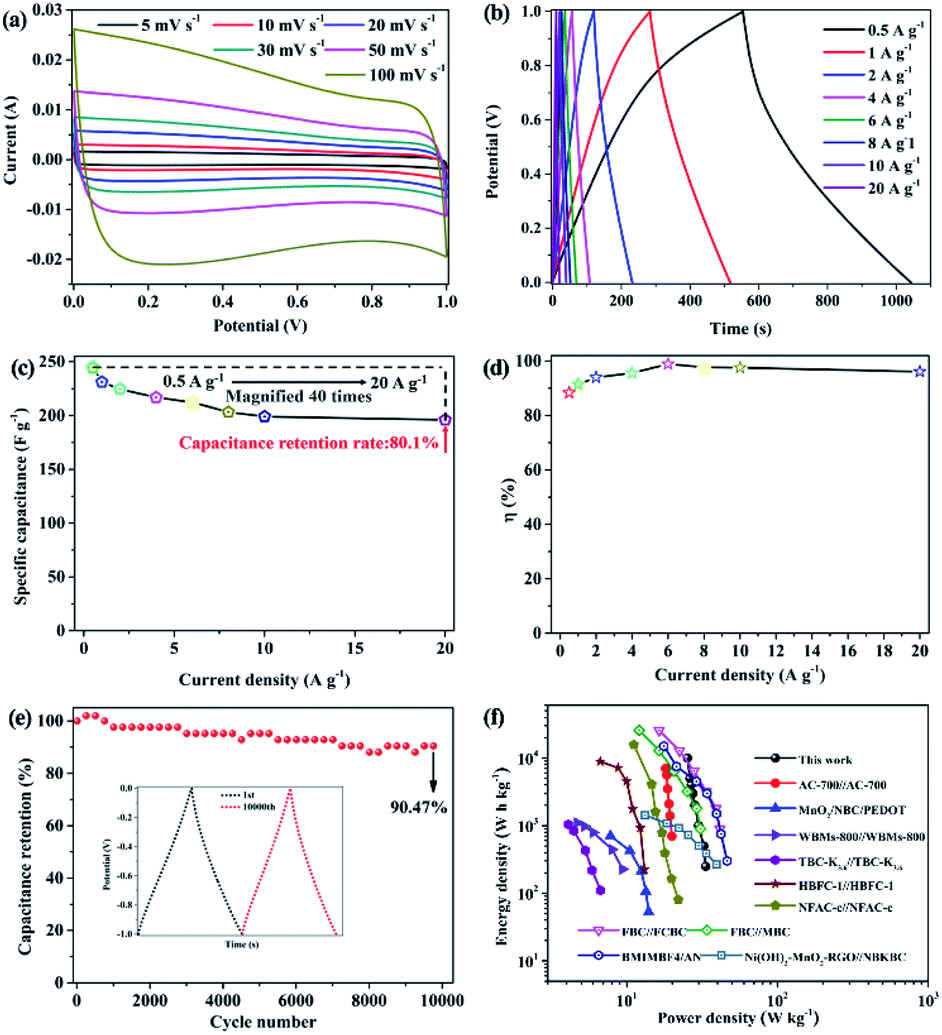 | ||
| Fig. 5 The TMFB-700A//TMFB-700A (a) CV curves, (b) GCD curves, (c) specific capacitance at various current densities, (d) energy delivery efficiency, (e) cycling performance, and (f) Ragone plot. | ||
The supercapacitor cycling stability was another important electrochemical performance indicator. In order to test the cycling performance of TMFB-700A further, the assembled TMFB-700A//TMFB-700A symmetrical capacitors were charged and discharged at a large current density of 4 A g−1. As shown in Fig. 5e, after 10000 cycles of testing, the TMFB-700A//TMFB-700A cycling retention rate was 90.47%, which indicated excellent cycling stability. The Ragone diagram in Fig. 5f showed that TMFB-700A//TMFB-700A can offer excellent energy and power densities. When the power density was 0.25 kW kg−1, the energy density of TMFB-700A//TMFB-700A was as high as 33.97 W h kg−1. Even when the energy density was 27.22 W h kg−1, the power density was as high as 10 kW kg−1. When compared with other reported biochar capacitors such as AC-700//AC-700 (19.9 W h kg−1, 700 W kg−1),58 MnO2/NBC/PEDOT (7.8 W h kg−1, 706.3 W kg−1),59 WBMs-800//WBMs-800 (9.4 W h kg−1, 227 W kg−1),60 TBC-K3.6//TBC-K3.6 (6.7 W h kg−1, 110 W kg−1),61 HBFC-1//HBFC-1 (13.1 W h kg−1, 225 W kg−1),62 and NFAC-c//NFAC-c (22 W h kg−1, 80 W kg−1)63 our results were superior. Meanwhile, our results were closed to other reported capacitors based on modified biochar, including FBC//FCBC (45.1 W h kg−1, 900 W kg−1),64 FBC//MBC (30.8 W h kg−1, 900 W kg−1),64 BMIMBF4/AN (46.38 W h kg−1, 300 W kg−1),65 and Ni(OH)2-MnO2-RGO//NBKBC (39.5 W h kg−1, 264 W kg−1)66 (Table S5†).
The excellent electrochemical performance of TMFB-700A can be attributed to the following factors: (1) the ultra-high specific surface area provides enough adsorption–desorption space for ions; (2) the unique porous structure can accelerate the electrolyte diffusion rate so that the electrolyte can quickly penetrate into the internal structure of the electrode material; (3) the developed pores provide space for buffering of ions and electrons, which facilitates their rapid transmission; (4) abundant surface functional groups not only enhance electrolyte diffusion in the electrode but also increase the overall capacitance of the material by introducing a proper amount of pseudocapacitance; and (5) the high degree of graphitization and defect structure density endow the material with excellent conductivity.
Conclusions
Herein, we have demonstrated the successful fabrication of the novel KOH activation waste-fed Tenebrio molitor feces biochar, and investigated in synergistic characteristic terms of CO2 capture and electrochemical performances. When activated at 700 °C for 1 h, the specific surface area of TMFB-700A increased significantly from 232.09 to 2081.78 m2 g−1, that was 10–20 times those of other activated animal manure biochars. In addition, well-developed pore distribution and unique honeycomb microstructure with abundant surface functional groups were formed. Due to these remarkable properties, TMFB-700A can quickly adsorb a large amount of CO2 (3.05 mol kg−1) with excellent recycling performance. TMFB-700A also exhibited promising electrochemical performance (335.8 F g−1 at 0.5 A g−1) and was used as electrode material in a symmetrical supercapacitor. It provided a high energy density of 33.97 W h kg−1 at a power density of 0.25 kW kg−1 with 90.47% capacitance retention after 10000 charge–discharge cycles. By comparison, the CO2 capture and supercapacitor performance of TMFB is superior to most recently reported biochar materials and close to some modified biochar materials. After the CO2 adsorption–desorption cycles, the internal pores of the TMFB might be further enlarged to improve the electrochemical performance. However, the combination of CO2 capture and supercapacitor applications still warrants more research. This study proposed a clean production pathway to convert TMF into promising functional biochar and offer valuable new insights for resource utilization of TMF.
Author contributions
Saier Wang: conceptualization, methodology, formal analysis, investigation, writing–original draft. Ying Shi: conceptualization, methodology, formal analysis, investigation. Huiming Xiang: writing–review & editing. Ru Liu: methodology, formal analysis. Lianghu Su: conceptualization,validation, investigation. Longjiang Zhang: writing–review & editing. Rongting Ji: conceptualization, validation, investigation.Conflicts of interest
There are no conflicts to declare.Acknowledgements
This work was supported by the National Natural Science Foundation of China (No. 51908380) and the Innovative team project of Nanjing Institute of Environmental Sciences, Ministry of Ecology and Environment of China (grant number GYZX210101). The funding sources had no role in the study design, data collection, data analysis and interpretation, preparation of the manuscript, or decision to submit for publication.Notes and references
- IPCC, Climate Change 2022: Mitigation of Climate Change, 2022 Search PubMed.
- H. Gu, G. Song, M. Niu, S. Zhao, Y. Gao and F. Li, Chem. Eng. J., 2022, 441, 135942 CrossRef CAS.
- World Greenhouse Gas Emissions: 2018, World Resources Institute Search PubMed.
- J. Rogelj, D. Huppmann, V. Krey, K. Riahi, L. Clarke, M. Gidden, Z. Nicholls and M. Meinshausen, Nature, 2019, 573, 357–363 CrossRef CAS PubMed.
- J. Zhao, S. Deng, L. Zhao, X. Yuan, B. Wang, L. Chen and K. Wu, J. CO2 Util., 2021, 52, 101662 CrossRef CAS.
- L. S. de Almeida, E. Q. Oreste, J. V. Maciel, M. G. Heinemann and D. Dias, Trends Environ. Anal. Chem., 2020, 26, e00089 CrossRef CAS.
- P. D. Dissanayake, S. You, A. D. Igalavithana, Y. Xia, A. Bhatnagar, S. Gupta, H. W. Kua, S. Kim, J.-H. Kwon, D. C. W. Tsang and Y. S. Ok, Renewable Sustainable Energy Rev., 2020, 119, 109582 CrossRef CAS.
- S. Wang, S. Wang, X. Guo, Z. Wang, F. Mao, L. Su, H. Wu, K. Wang and Q. Zhang, Inorg. Chem. Front., 2021, 8, 4878–4886 RSC.
- K. Wang, S. Wang, J. Liu, Y. Guo, F. Mao, H. Wu and Q. Zhang, ACS Appl. Mater. Interfaces, 2021, 13, 15315–15323 CrossRef CAS PubMed.
- H. Stephanie, T. E. Mlsna and D. O. Wipf, Desalination, 2021, 516, 115240 CrossRef CAS.
- S. P. Sohi, Science, 2012, 338, 1034 CrossRef CAS PubMed.
- X. Li, J. Zhang, B. Liu and Z. Su, J. Clean. Prod., 2021, 310, 127428 CrossRef CAS.
- W. Xiang, X. Zhang, C. Cao, G. Quan, M. Wang, A. R. Zimmerman and B. Gao, Bioresour. Technol., 2022, 355, 127274 CrossRef CAS PubMed.
- J. Zhang, D. Huang, J. Shao, X. Zhang, S. Zhang, H. Yang and H. Chen, Fuel Process. Technol., 2022, 231, 107250 CrossRef CAS.
- Y. Cai, M. Zhu, X. Meng, J. L. Zhou, H. Zhang and X. Shen, Bioresour. Technol., 2022, 351, 126924 CrossRef CAS PubMed.
- Y. Qiao and C. Wu, Carbon Capture Sci. Technol., 2022, 2, 100018 CrossRef CAS.
- O. Norouzi, F. D. Maria and A. Dutta, J. Energy Storage, 2020, 29, 101291 CrossRef.
- A. D. Igalavithana, S. Mandal, N. K. Niazi, M. Vithanage, S. J. Parikh, F. N. D. Mukome, M. Rizwan, P. Oleszczuk, M. Al-Wabel, N. Bolan, D. C. W. Tsang, K.-H. Kim and Y. S. Ok, Crit. Rev. Environ. Sci. Technol., 2017, 47, 2275–2330 CrossRef CAS.
- Z. Dong, Y. Lin, H. Wu and M. Zhang, Food Chem., 2021, 334, 127475 CrossRef CAS PubMed.
- Y. Lou, Y. Li, B. Lu, Q. Liu, S.-S. Yang, B. Liu, N. Ren, W.-M. Wu and D. Xing, J. Hazard. Mater., 2021, 416, 126222 CrossRef CAS PubMed.
- J. Navarro del Hierro, A. Gutiérrez-Docio, P. Otero, G. Reglero and D. Martin, Food Chem., 2020, 309, 125742 CrossRef CAS PubMed.
- L. Yang, J. Gao, Y. Liu, G. Zhuang, X. Peng, W.-M. Wu and X. Zhuang, Chemosphere, 2021, 262, 127818 CrossRef CAS PubMed.
- J. C. Sanchez-Hernandez, K. S. Ro, A. A. Szogi, S. Chang and B. Park, J. Hazard. Mater., 2021, 408, 124405 CrossRef CAS PubMed.
- T. Vanden Nest, F. Amery, L. Fryda, C. Boogaerts, J. Bilbao and B. Vandecasteele, Sci. Total Environ., 2021, 750, 141699 CrossRef CAS PubMed.
- M. Uchimiya, S. Hiradate and M. J. Antal, ACS Sustain. Chem. Eng., 2015, 3, 1642–1649 CrossRef CAS.
- S.-S. Yang, Y.-d. Chen, J.-H. Kang, T.-R. Xie, L. He, D.-F. Xing, N.-Q. Ren, S.-H. Ho and W.-M. Wu, J. Clean. Prod., 2019, 227, 33–47 CrossRef CAS.
- S.-S. Yang, Y.-d. Chen, Y. Zhang, H.-M. Zhou, X.-Y. Ji, L. He, D.-F. Xing, N.-Q. Ren, S.-H. Ho and W.-M. Wu, Environ. Pollut., 2019, 252, 1142–1153 CrossRef CAS PubMed.
- Y. Xu, Z. Yang, G. Zhang and P. Zhao, J. Clean. Prod., 2020, 264, 121645 CrossRef CAS.
- W. Liao, J. Drake and S. C. Thomas, Sci. Total Environ., 2022, 813, 152638 CrossRef CAS PubMed.
- S. Patel, A. Orlov, E. Ariyachandra and S. Peethamparan, Chem. Eng. J., 2021, 420, 130413 CrossRef CAS.
- L. Su, M. Chen, G. Zhuo, R. Ji, S. Wang, L. Zhang, M. Zhang and H. Li, Sustainability, 2021, 13 Search PubMed.
- J. Park, W.-w. Jeon and H. Choo, Powder Technol., 2021, 392, 286–295 CrossRef CAS.
- K. Li, Q. Liu, H. Cheng, M. Hu and S. Zhang, Spectrochim. Acta, Part A, 2021, 249, 119286 CrossRef CAS PubMed.
- J. Park, S. S. Park and Y. S. Won, Electrochim. Acta, 2013, 107, 467–472 CrossRef CAS.
- L. Dong, S. Li, Y. Jin, B. Hu and G. Sheng, Appl. Surf. Sci., 2021, 567, 150794 CrossRef CAS.
- P. A. d. S. Veiga, M. H. Cerqueira, M. G. Gonçalves, T. T. d. S. Matos, G. Pantano, J. Schultz, J. B. d. Andrade and A. S. Mangrich, J. Environ. Manage., 2021, 285, 112145 CrossRef CAS PubMed.
- H. Zhu, X. Liu, Y. Jiang, M. Zhang, D. Lin and K. Yang, Chem. Eng. J., 2021, 422, 130584 CrossRef CAS.
- W. Chen, Y. Fang, K. Li, Z. Chen, M. Xia, M. Gong, Y. Chen, H. Yang, X. Tu and H. Chen, Appl. Energy, 2020, 260, 114242 CrossRef CAS.
- A. Herath, C. Reid, F. Perez, C. U. Pittman and T. E. Mlsna, J. Environ. Manage., 2021, 296, 113186 CrossRef CAS PubMed.
- M. Wądrzyk, P. Grzywacz, R. Janus and M. Michalik, Renew. Energy, 2021, 179, 248–261 CrossRef.
- J. Chen, D. Fang and F. Duan, Appl. Energy, 2018, 218, 54–65 CrossRef.
- P. Maziarka, C. Wurzer, P. J. Arauzo, A. Dieguez-Alonso, O. Mašek and F. Ronsse, Chem. Eng. J., 2021, 418, 129234 CrossRef CAS.
- K. Wang, N. Peng, X. Niu, G. Lu, Y. Zhong, X. Yu, C. Du, J. Gu, H. Zhou and J. Sun, Waste Manag., 2021, 126, 400–410 CrossRef PubMed.
- K. Wang, N. Peng, G. Lu and Z. Dang, Waste Biomass Valorization, 2020, 11, 613–624 CrossRef CAS.
- J. Qin, S. Qian, Q. Chen, L. Chen, L. Yan and G. Shen, J. Hazard. Mater., 2019, 371, 381–388 CrossRef CAS PubMed.
- P. Zhang, H. Sun, L. Yu and T. Sun, J. Hazard. Mater., 2013, 244–245, 217–224 CrossRef CAS PubMed.
- Z. Wang, F. Shen, D. Shen, Y. Jiang and R. Xiao, J. Environ. Sci., 2017, 53, 293–300 CrossRef CAS PubMed.
- N. Lee, S.-H. Hong, C.-G. Lee, S.-J. Park and J. Lee, Chemosphere, 2021, 278, 130398 CrossRef CAS PubMed.
- M. Wang, S. Hu, Q. Wang, Y. Liang, C. Liu, H. Xu and Q. Ye, J. Clean. Prod., 2021, 291, 125221 CrossRef CAS.
- A. Proctor and J. F. Toro-Vazquez, in Bleaching and Purifying Fats and Oils (2nd edn), ed. G. R. List, AOCS Press, 2009, DOI: https://doi.org/10.1016/B978-1-893997-91-2.50016-X, pp. 209–219 Search PubMed.
- P. Ammendola, F. Raganati and R. Chirone, Chem. Eng. J., 2017, 322, 302–313 CrossRef CAS.
- X. Hu, Y. Luo, X. Wu, J. Niu, M. Tan, Z. Sun and W. Liu, Mater. Today Energy, 2022, 27, 101010 CrossRef CAS.
- H. Chen, Y. Guo, Y. Du, X. Xu, C. Su, Z. Zeng and L. Li, Chem. Eng. J., 2021, 415, 128824 CrossRef CAS.
- L. Ma, R. Bai, G. Hu, R. Chen, X. Hu, W. Dai, H. F. M. Dacosta and M. Fan, Energy Fuels, 2013, 27, 5433–5439 CrossRef CAS.
- Y.-C. Chiang and R.-S. Juang, J. Taiwan Inst. Chem. Eng., 2017, 71, 214–234 CrossRef CAS.
- K. Wang, Q. Li, Z. Ren, C. Li, Y. Chu, Z. Wang, M. Zhang, H. Wu and Q. Zhang, Small, 2020, 16, 2001987 CrossRef CAS PubMed.
- K. Wang, R. Bi, M. Huang, B. Lv, H. Wang, C. Li, H. Wu and Q. Zhang, Inorg. Chem., 2020, 59, 6808–6814 CrossRef CAS PubMed.
- M. Gao, W.-K. Wang, Y.-M. Zheng, Q.-B. Zhao and H.-Q. Yu, Chem. Eng. J., 2020, 402, 126171 CrossRef CAS.
- H. R. Kim, J. H. Lee, S. K. Lee, Y. Chun, C. Park, J.-H. Jin, H. U. Lee and S. W. Kim, J. Clean. Prod., 2021, 284, 125449 CrossRef CAS.
- Y. Ma, D. Yao, H. Liang, J. Yin, Y. Xia, K. Zuo and Y.-P. Zeng, Electrochim. Acta, 2020, 352, 136452 CrossRef CAS.
- S. Pérez-Rodríguez, O. Pinto, M. T. Izquierdo, C. Segura, P. S. Poon, A. Celzard, J. Matos and V. Fierro, J. Colloid Interface Sci., 2021, 601, 863–876 CrossRef PubMed.
- H. A. Hamouda, S. Cui, X. Dai, L. Xiao, X. Xie, H. Peng and G. Ma, RSC Adv., 2021, 11, 354–363 RSC.
- J. Wang, Z. Li, S. Yan, X. Yu, Y. Ma and L. Ma, RSC Adv., 2019, 9, 14797–14808 RSC.
- S. E. M. Pourhosseini, O. Norouzi, P. Salimi and H. R. Naderi, ACS Sustain. Chem. Eng., 2018, 6, 4746–4758 CrossRef CAS.
- C. Chang, H. Wang, Y. Zhang, S. Wang, X. Liu and L. Li, ACS Sustain. Chem. Eng., 2019, 7, 10763–10772 CrossRef CAS.
- G. S. d. Reis, H. P. d. Oliveira, S. H. Larsson, M. Thyrel and E. Claudio Lima, Nanomaterials, 2021, 11, 424 CrossRef PubMed.
Footnote |
| † Electronic supplementary information (ESI) available. See https://doi.org/10.1039/d2ra03575h |
| This journal is © The Royal Society of Chemistry 2022 |