
 Open Access Article
 This Open Access Article is licensed under a Creative Commons Attribution-Non Commercial 3.0 Unported Licence
Slippage- and load-induced changes in the crystalline orientation of oligo(3-methoxythiophene) powder to develop a gold-tone luster†
Satoya Sugiuraa,
Terumasa Mitogawaa,
Kota Saitoa,
Rihito Tamuraa,
Satoru Tsukada a,
Takahiko Horiuchib and
Katsuyoshi Hoshino*a
a,
Takahiko Horiuchib and
Katsuyoshi Hoshino*a
aDepartment of Materials Science, Graduate School of Engineering, Chiba University, 1-33 Yayoi-cho, Inage-ku, Chiba 263-8522, Japan. E-mail: k_hoshino@faculty.chiba-u.jp
bDepartment of Imaging Sciences, Graduate School of Engineering, Chiba University, 1-33 Yayoi-cho, Inage-ku, Chiba 263-8522, Japan
First published on 8th July 2022
Abstract
The achievement of molecular orientation control by rubbing and pressing poly(3-alkylthiophene)s is a powerful technique to improve the performance of organic electronic devices. We report here that the rubbing and pressing of blackish-brown 3-methoxythiophene oligomer powders yield layer and tablet samples with gold tones, respectively. Specular reflectivity, colorimetric, and X-ray diffraction measurements reveal that this gold tone is caused by an increase in the ratio of edge-on lamellar crystallites to face-on ones, which is promoted by rubbing/pressing. In contrast to the 3-alkylthiophene polymer, which develops a dominant face-on lamellar structure, rubbing of the 3-methoxythiophene oligomer increases the relative amount of edge-on lamellar crystallites to face-on lamellar ones. Furthermore, gold tone development in the tablet samples is limited to the near-surface area, despite the fact that pressure is also applied to the tablet bulk. These specific chemical events are explained by considering the repulsive interactions between the 3-methoxythiophene backbone and the functional groups on the surface of the substrate employed during the rubbing/pressing processes. Despite the lower applied pressure, gold tone development by rubbing is accompanied by a higher reflective property than by pressing because of the formation of larger relative amounts and sizes of edge-on lamellar crystallites, which are responsible for the gold tone.
1. Introduction
Over the last few decades, metal-free organic solids that exhibit gold, silver, or copper-like lusters have been discovered. These organic materials have attracted considerable attention because they have the potential to solve various issues associated with paints that contain metal flake pigments.1,2 Among these organic materials, the method by which the metallic luster is developed differs depending on the chemical properties of the material. Such methods include crystallization,3–8 solidification by filtration,9–12 electrochemical polymerization,13–16 and solution application.17–23 However, the design of a novel and more facile method for the development of metallic lusters could promote the application of the corresponding organic materials in the field of decoration, while also expanding their range of uses.The molecular orientation of semiconducting polymers (SCPs) such as polyalkylthiophenes24,25 has been achieved using shear forces, such as those resulting from the mechanical rubbing of SCP films26–30 and the friction transfer of polymers onto a substrate.31–33 Mechanical rubbing typically involves the use of a cloth-covered rubbing cylinder that rotates at a steady speed and pressure to achieve orientation within the polymer films, while during friction transfer, the polymer powder is pressed at a high pressure to form a pellet, which is then slid onto a hot substrate at a constant speed to achieve polymer transfer onto the substrate. These methods achieve orientation of polymer chains in the direction of rubbing or friction, and it is well known that a correlation exists between the electronic properties and orientations of SCPs films. For example, in the case of poly(3-hexylthiophene) (P3HT) films, both edge-on lamellar crystallites (i.e., where the thiophene rings are normal to the substrate and the π–π stacking direction lies in-plane) and face-on lamellar crystallites (i.e., where the thiophene rings are parallel to the substrate and the π–π stacking direction is normal to the substrate) exist in the film. The former and latter orientations have been shown to favor the transport of charge carriers in the in-plane and film-thickness directions, respectively.34 More specifically, rubbing the film surface parallel to the in-plane direction promotes face-on orientation formation and enhances the charge carrier mobility in the film thickness direction. The above rubbing and friction-induced orientation approaches have therefore been employed to improve the device performances of organic field-effect transistors,35 polymerized light-emitting diodes,32 organic thin-film solar cells,28 and thermoelectric materials,36 among others.
Thus, we herein report the use of a 3-methoxythiophene oligomer (a blackish-brown powder) to obtain a gold luster on a polyimide film or glass substrate. This is achieved by the rubbing (in the parallel direction) and pressing (under a perpendicular force) of the oligomers to yield layer and tablet samples with gold tones, respectively. Importantly, the rubbing-based method employed herein does not involve crystallization, filtration, or dissolution, and therefore requires no use of special equipment, devices, or solvents. We also describe the relationship between gold tone development and molecular orientation (edge-on orientation versus face-on orientation), and special emphasis is placed on the fact that rubbing of the 3-methoxythiophene oligomer promotes the formation of edge-on lamellar crystallites in marked contrast to poly(3-alkylthiophene)s. Finally, the mechanism responsible for these processes is discussed.
2. Experimental
2.1. Materials
3-Methoxythiophene (>98%; Fujifilm Wako Pure Chemical Co.) was polymerized by oxidation with Fe(ClO4)3·nH2O (anhydrous salt content = 70.7%; Fujifilm Wako Pure Chemical Co.). Acetonitrile (>99.7%; Kanto Chemical Co., Ltd.), nitromethane (>98.0%; Tokyo Chemical Industry), and methanol (99.8%; Kanto Chemical Co., Ltd.) were used as received. Oligo(3-methoxythiophene) (O3MeOT) doped with ClO4− was prepared as previously reported.17 More specifically, a solution of 3-methoxythiophene (0.123 g) in acetonitrile (10 mL) was placed in a glass cell and de-aerated for 30 min by means of nitrogen gas bubbling through the solution while stirring at 350 rpm. This solution was instantaneously supplemented with a solution of Fe(ClO4)3·nH2O (1.10 g) in acetonitrile (10 mL), prepared by ultrasonication for 20 min. The resulting solution was stirred at 20 °C for 60 min and then suction-filtered through a membrane filter (pore size = 0.1 μm). The filter cake was washed vigorously with methanol at least three times, and the resulting powder was vacuum-dried at 50 °C for 1.5 h to yield ClO4−-doped O3MeOT with a blackish-brown color. The molecular weight and perchlorate doping level of O3MeOT were 1.14 × 10³ and 30%, respectively (see the literature 20 and its ESI). The glass plate (S1225, Matsunami Glass) was cleaned by sonication for 10 min in acetone (>99.5%; Kanto Chemical Co., Ltd.) prior to use.2.2. Rubbing processing
Rubbing of the O3MeOT powder was performed in two ways, namely by applying a constant linear pressure (Method 1), and by applying a constant surface pressure (Method 2).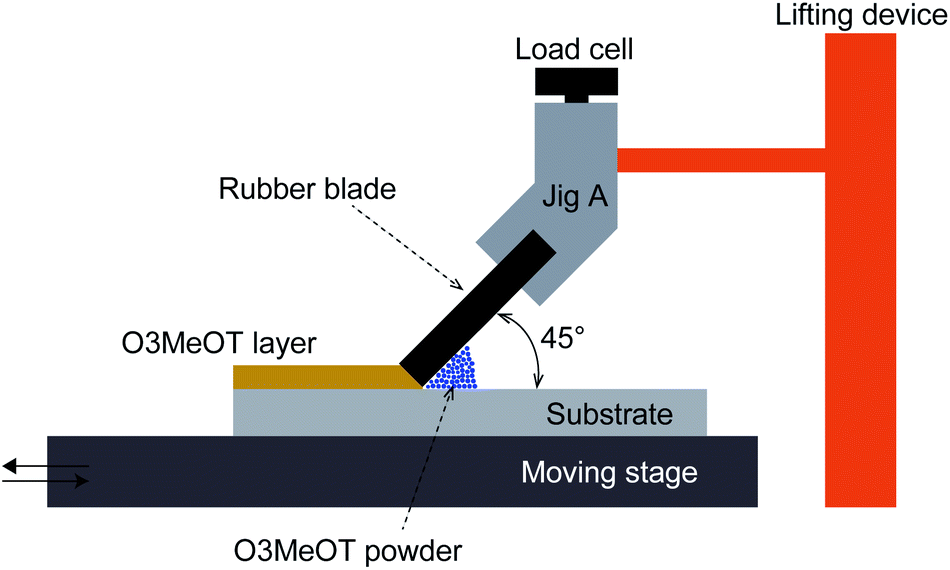 | ||
| Fig. 1 Schematic illustration of the in-house-prepared equipment employed for the rubbing process according to Method 1. | ||
Rubbing was also performed at linear pressures other than 20 and 40 gf mm−1. However, at linear pressures above 60 gf mm−1, rubbing could not be performed due to high frictional forces. This may come from the increased linear contact area due to the elasticity of the urethane rubber blade. On the other hand, at linear pressures below 16 gf mm−1, pressure could not be applied uniformly to the O3MeOT powder probably because uniform contact area cannot be achieved.
2.3. Pressing procedure
The O3MeOT oligomer (100 mg) was placed in a stainless steel tablet molder (Shimadzu Corp.) and then pressed at 20 °C for 10 min using a hydraulic press (SSP-10A, Shimadzu Corp.) to produce tablets with a diameter of 13 mm. The applied pressure was varied from 0.05 t (3.8 × 10⁻² tf cm−2) to 10 t (7.5 tf cm−2). For example, a sample pressed with a force of 2 t (1.5 tf cm−2 pressure) was denoted as tablet-2 t.2.4. Characterization
The UV-vis reflection spectra of the obtained samples were recorded using a JASCO MSV-370 spectrometer, in which the incident and reflection angles were 23° from the vertical position. The spectra were recorded at 20 °C using an evaporated aluminum film, which was an accessory of the spectrometer, as the reference material. The O3MeOT layers were photographed using a digital microscope (VHX-5000, Keyence). The lustrous features of the films were demonstrated using optical micrographs. Illumination was performed using a ring-type lighting system attached to the microscope. While capturing the photographic images of the films, the distance between the light source and the sample, the illumination angle, and the photography angle were adjusted to almost constant values throughout. Out-of-plane X-ray diffraction (XRD) measurements were performed using a diffractometer (SmartLab, Rigaku) equipped with a Cu Kα (λ = 1.5406 Å) source in 2θ/ω scan mode. The colors of the layers and tablets were evaluated based on CIELab values acquired using a spectrophotometer (CM-600d, Konica Minolta) with a D65 illuminant at an observation angle of 10° (CIE 1964 Standard Observer); the parameters included a* for redness–greenness and b* for yellowness–blueness. The root mean square roughness values, Rq, of the O3MeOT layers were measured using laser-scanning microscopy (VK-9700, Keyence). The coating films were compared with a metallic gold film (thickness = 100 nm) on a glass plate, which was prepared by vacuum evaporation (VPC-260F, ULVAC).3. Results and discussion
3.1. Rubbing of the O3MeOT powder
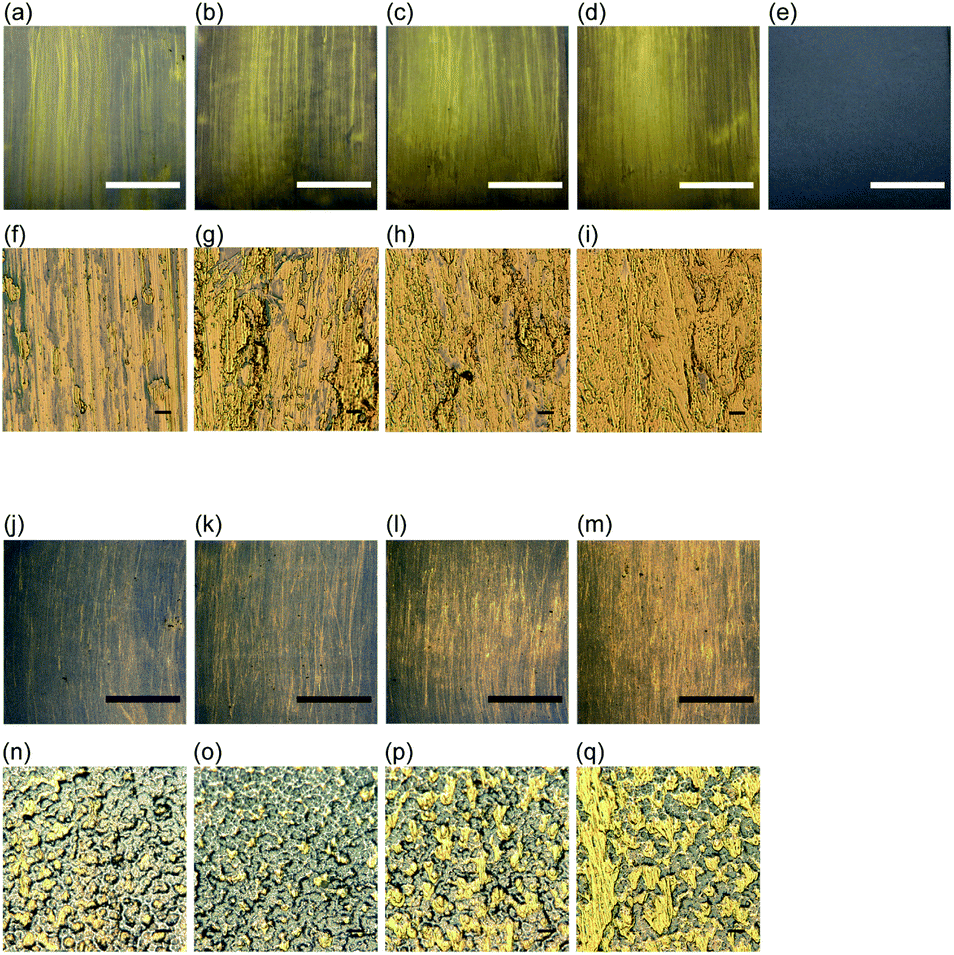 | ||
| Fig. 2 Low-magnification (a–d, j–m) and high-magnification (f–i, n–q) digital microscope images of the O3MeOT layers prepared by rubbing at linear pressures of 40 (a–d, f–i) and 20 gf mm−1 (j–q). Panel (e) shows a low-magnification image of the substrate. The scale bars in the low-magnification images (a–e, j–m) and high-magnification images (f–i, n–q) correspond to 10 mm and 10 μm, respectively. | ||
The area of the gold-like lustrous layer also increased with n for the layers formed at 20 gf mm−1, but the areas were smaller than those prepared at 40 gf mm−1 using the same values of n (Fig. 2j–m). In the magnified images of these layers (Fig. 2n–q), the particle morphologies were remained regardless of n. However, as n was increased, the tops of the particles were squashed, and at n = 50 and 100, the squashed areas were connected to one another, leading to an increase in the lustrous area. Specular reflection spectroscopy and colorimetric measurements were therefore performed to quantify the gloss and chromaticity of each layer.
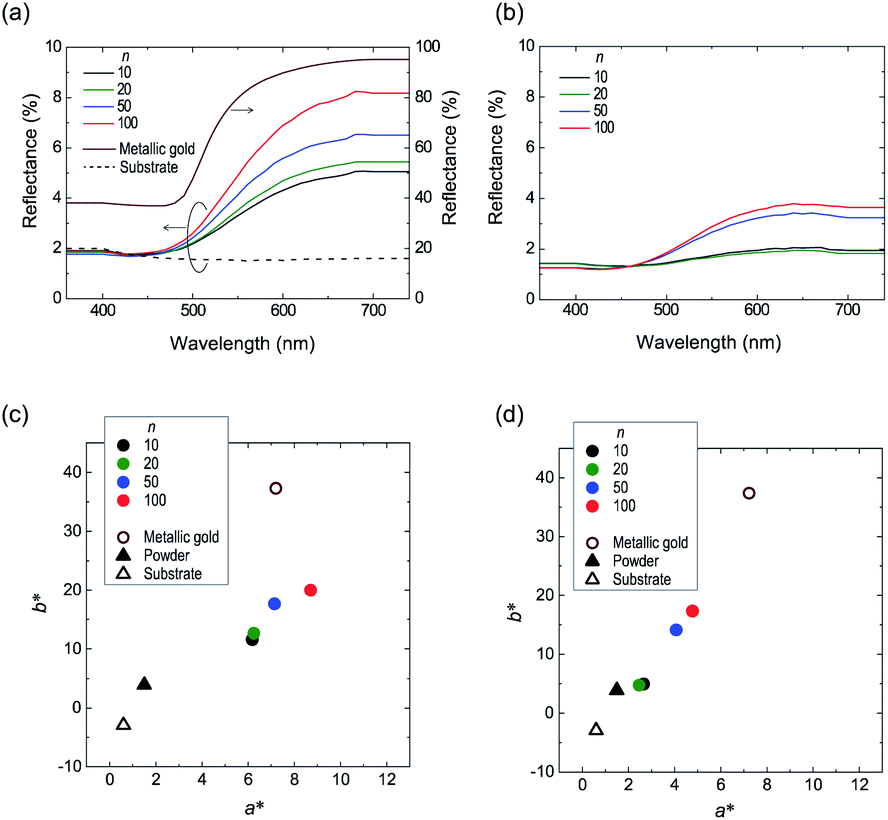 | ||
| Fig. 3 Dependence of the specular reflection spectra of the O3MeOT layers prepared at linear pressures of (a) 40 and (b) 20 gf mm−1 on n. The corresponding spectra for the vacuum-evaporated gold film and the substrate are also shown for comparison. Panels (c) and (d) show the a*, b* chromaticity diagrams of the O3MeOT layers prepared at 40 and 20 gf mm−1 linear pressures, respectively. In addition to the data for the O3MeOT layers formed at n = 10, 20, 50 and 100, values for the O3MeOT powder, substrate, and vacuum-evaporated gold film are also included. | ||
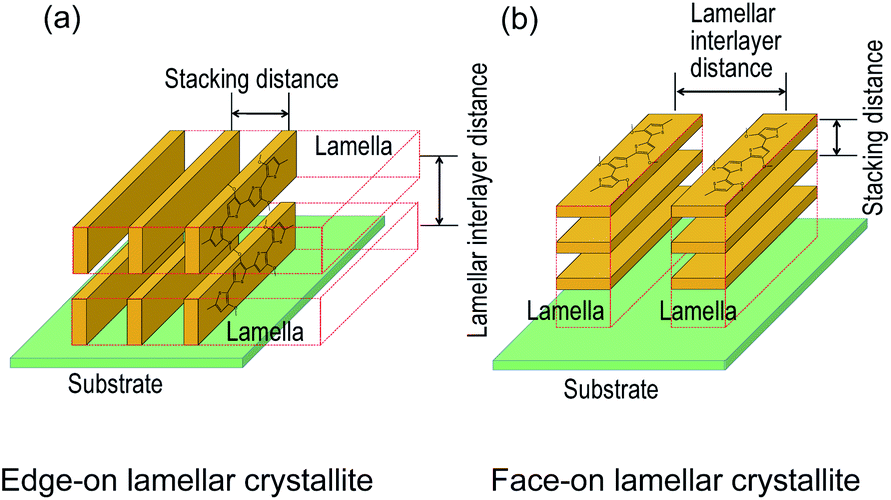 | ||
| Fig. 4 Schematic diagrams of the (a) edge-on and (b) face-on lamellar crystallites. | ||
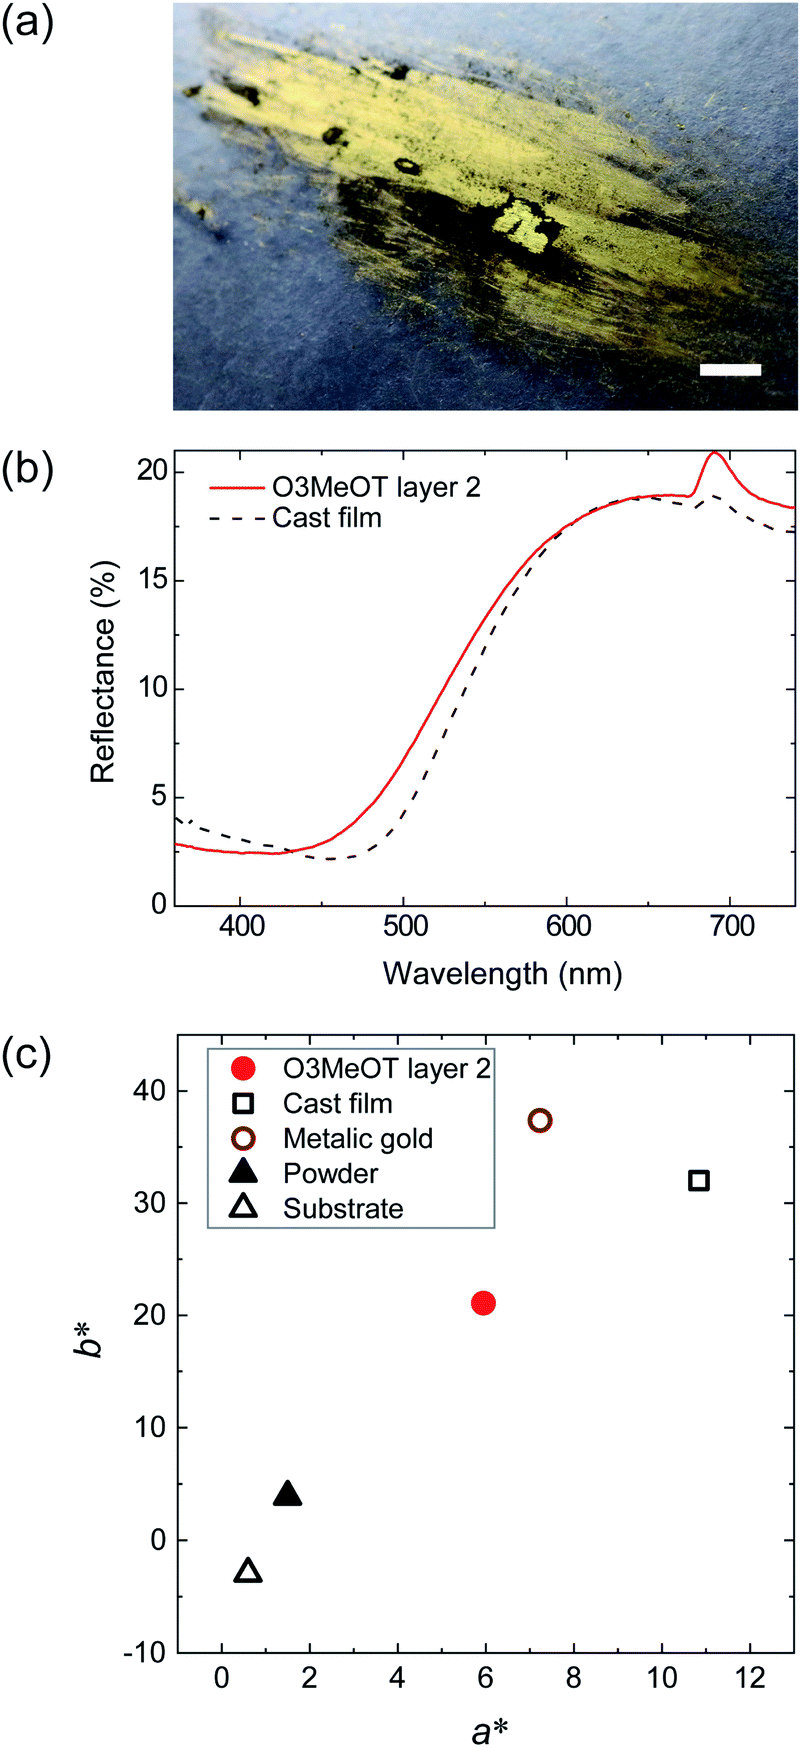 | ||
| Fig. 5 (a) Digital microscopy image, (b) specular reflection spectrum (solid red line), and (c) a*, b* chromaticity diagram (solid red circles) of O3MeOT layer 2. The scale bar in panel (a) corresponds to 10 mm. For comparison, panel (b) includes the spectrum of a O3MeOT cast film, and panel (c) includes the colorimetric data for the cast film, metallic gold film, O3MeOT powder, and substrate. | ||
Polyalkylthiophenes37–41 and O3MeOT17–19 are generally considered to be quasi-crystals comprising a crystalline area surrounded by an amorphous area, where the crystalline area consists of orthorhombic unit cells with lattice parameters of a, b, and c (Fig. 6b). Fig. 6a shows the XRD pattern (solid red line) of O3MeOT layer 2, and the corresponding patterns of the O3MeOT powder (solid black line) and the cast film (dashed line)17 are also shown for comparison. The XRD pattern of the cast film was characterized by peaks at 2θ = 7.84, 15.92, and 25.46°, as previously reported.17 The peaks at 2θ = 7.84 and 15.92° can be attributed to reflections from the crystallographic (100) and (200) planes, respectively, thereby confirming the lamellar structure of the film. The primary reflection at 2θ = 7.84° was used to calculate the lamellar interlayer distance of 1.13 nm. Furthermore, the peak at 2θ = 25.46° corresponds to the (020) plane, which is associated with the π–π stacking of the O3MeOT chains at a stacking distance of 0.35 nm. It should be noted here that the XRD measurements carried out herein were acquired in the out-of-plane mode and were therefore sensitive to the lattice parameters in the film thickness direction. Thus, the observation of signals at 2θ = 7.84 and 15.92° indicate the presence of edge-on lamellar crystallites (Fig. 4a), whereas the signal at 2θ = 25.46° confirms the presence of face-on lamellar crystallites (Fig. 4b). Moreover, the reflection intensity from the (100) plane of the cast film was found to be significantly larger than that from the (020) plane, indicating that the edge-on lamellar crystals were dominant. The patterns of O3MeOT layer 2 and the O3MeOT powder both exhibited peaks at 2θ = 7.87, 16.03, and 26.03°, similar to the case of the cast films. However, the intensity ratios of the reflections from the (100) and (020) planes differed. More specifically, in the powder sample, the reflection from the (020) plane was slightly larger than that from the (100) plane, whereas for the O3MeOT layer 2 sample, the reflection intensity from the (100) plane was significantly larger. These observations clearly indicate that the rubbing action increased the edge-on lamellar structure, resulting in the development of a gold-like color and luster.
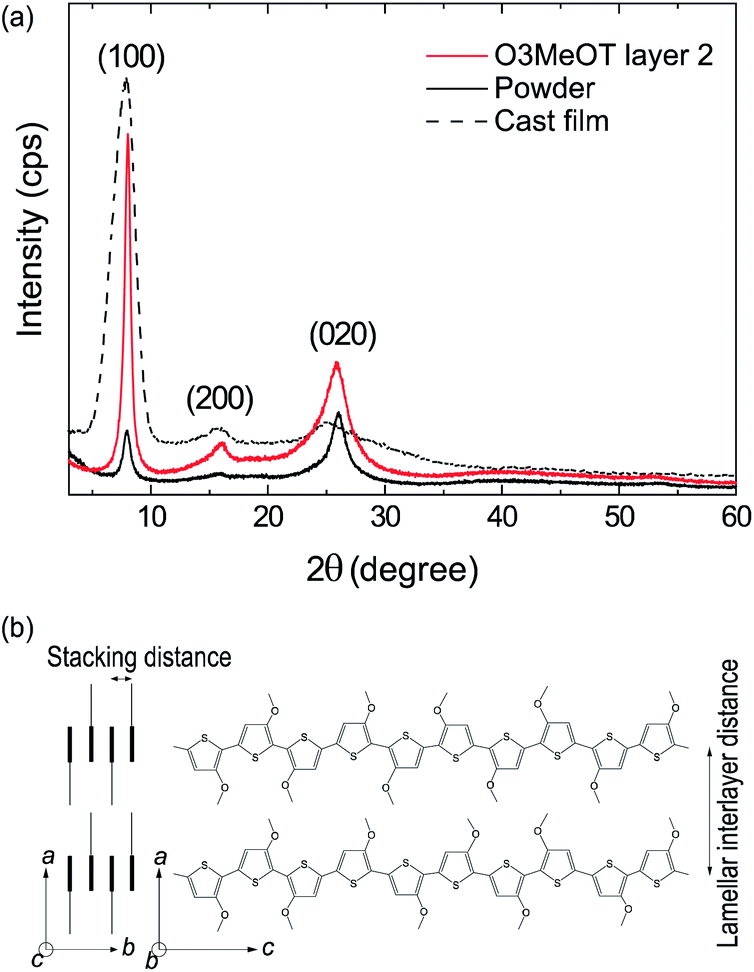 | ||
| Fig. 6 (a) X-ray diffraction patterns of O3MeOT layer 2 (solid red line), the O3MeOT powder (solid black line), and the O3MeOT cast film (dashed line). (b) Schematic representation of the molecular arrangement of the O3MeOT oligomer. | ||
In films of poly(3-alkylthiophene)s (mainly poly(3-hexylthiophene), P3HT) and their derivatives, out-of-plane π–π stacking or face-on orientation is known to increase with mechanical rubbing;24–30 this increase in the face-on component significantly improves hole transport in the out-of-plane direction. The above results for the O3MeOT layers and O3MeOT layer 2 also show orientation changes with rubbing, but the critical difference from the poly(3-alkylthiophene)s case is that the increase is not in the face-on orientation, but in the edge-on orientation, as shown in Fig. 3 and 6. This difference was likely caused by the difference between the alkyl and methoxy groups bonded to the 3-position of the thiophene ring. In the case of the alkyl groups, rubbing causes the alkyl chains with a low elastic modulus to elongate and align parallel to the rubbing direction, thereby enhancing the molecular planarity. These results therefore account for the ordering of such side-chain conformations to produce a greater proportion of face-on orientation crystallites.
On the other hand, in the case of a methoxy group, no elastic property is expected, and so orientation induction by the above mechanism is not expected to occur. Kim et al.42 examined the interface between a P3HT film and an insulator substrate modified with self-assembled monolayers (SAMs) functionalized with various functional groups (–NH2, –OH, and –CH3). They found that a repulsive force exists between the non-covalent electron pairs of the terminal groups (–NH2 and –OH) of the SAMs and the π-electron cloud of the thienyl backbone, leading to dominance of the edge-on orientation of P3HT. They further explained that when the terminal group of the SAM is –CH3, the face-on orientation is dominant because of the π–H interaction between the H atom and the thienyl backbone. Based on their observations, it can be inferred that in the case of O3MeOT layer 2, the edge-on orientation is the most thermodynamically stable because of the repulsive force between the thienyl skeleton and the unshared electron pairs of the –OH groups present on the glass substrate (or –C![[double bond, length as m-dash]](https://www.rsc.org/images/entities/char_e001.gif) O on the polyimide film for the O3MeOT layers).43
O on the polyimide film for the O3MeOT layers).43
3.2. Pressing of the O3MeOT powder
During a previous study, we wished to perform Fourier transform infrared spectroscopy measurements on O3MeOT, and so we sandwiched the O3MeOT powder between two dies and pressed it. Surprisingly, we found that a gold-like luster had developed. This motivated us to further examine luster development under pressing conditions. For this purpose, tablets were prepared by pressing O3MeOT powder using the method described in Section 2.3, and their material properties were measured. Fig. 7 shows photographs of the obtained tablets, while Table 1 lists their thicknesses and Rq values. Visually, as the applied pressure increased, the color of the tablet surface was observed to gradually change from blackish-brown (i.e., the color of the powder) to a gold tone. As described in Section 2.4, the photographic conditions for each tablet were as much as possible the same: however, the reproduction of the gold tone luster by photographing is very difficult and may differ from the visual images. For the quantitative evaluation of luster, see the results of the reflection spectrum measurements shown below. In addition, the tablet thickness and the Rq value decreased with increasing pressure.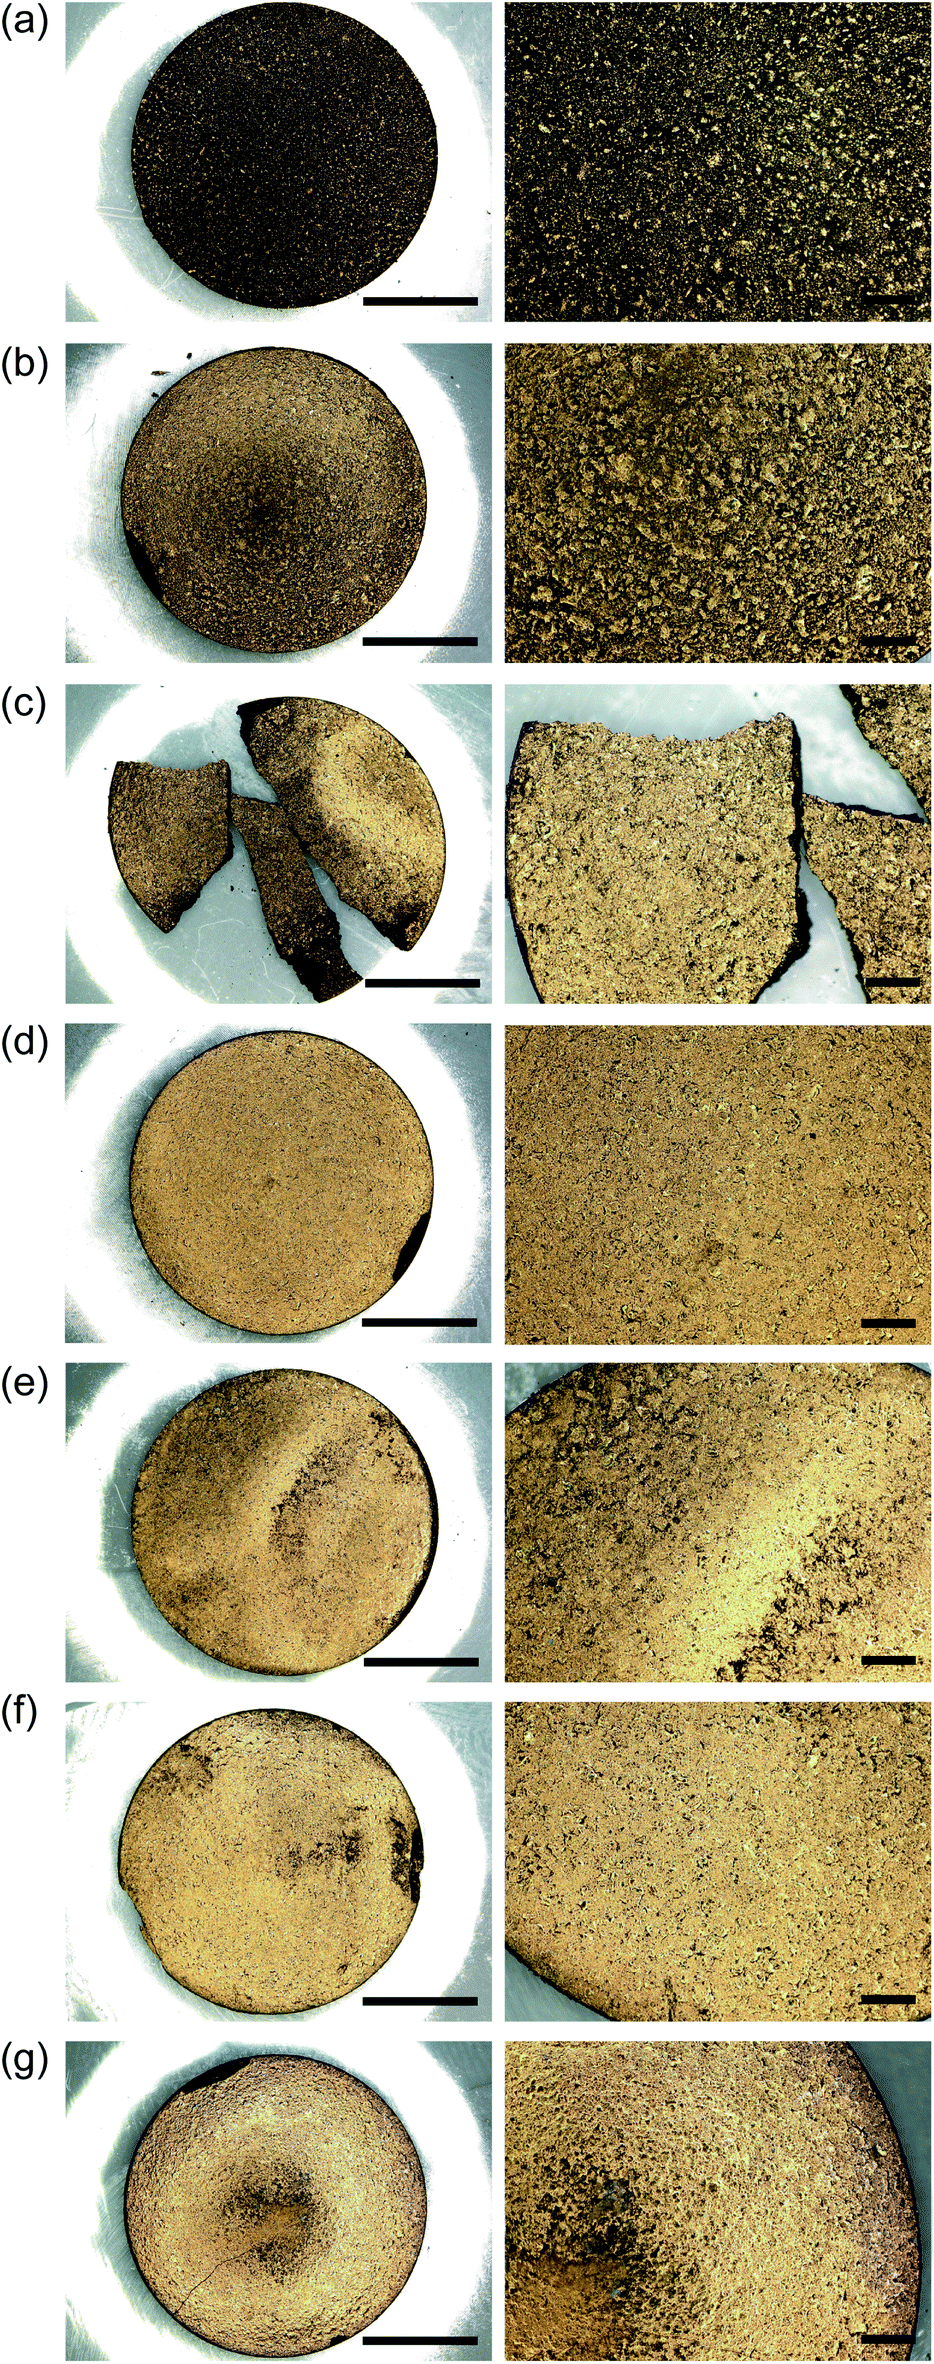 | ||
| Fig. 7 Digital microscopy images of (a) tablet-0.05 t, (b) tablet-0.5 t, (c) tablet-1 t, (d) tablet-2 t, (e) tablet-4 t, (f) tablet-8 t, and (g) tablet-10 t. The left- and right-hand images in each panel are the images taken at low and high magnifications, respectively. The scale bars in the left- and right-hand images correspond to 5 and 1 mm, respectively. | ||
| Tablet sample | Thickness (mm) | Rq |
|---|---|---|
| Tablet-0.05 t | 0.95 | 26.3 |
| Tablet-0.5 t | 0.75 | 8.3 |
| Tablet-1 t | 0.70 | 8.0 |
| Tablet-2 t | 0.65 | 3.4 |
| Tablet-4 t | 0.60 | 3.7 |
| Tablet-8 t | 0.65 | 2.7 |
| Tablet-10 t | 0.55 | 1.3 |
Notably, the chipped parts of the tablet surface (Fig. 7b, d, and g), the fracture surface at the broken part of the tablet bulk (Fig. 7c), and the cross sections of the bulk of all tablets remained blackish-brown, and only the surface developed a gold luster. See Fig. S2 in the ESI† for the laser microscopy images of the surface topography of the tablets.
Fig. 8a shows the reflection spectra of the tablets, wherein it can be seen that the spectral shape obtained for the tablet sample was comparable to those of the cast film and the metallic gold film (Fig. 3a), thereby indicating that their reflective color is a gold tone. In addition, we found that the specular reflectance was positively correlated with the applied pressure. Furthermore, in the a* and b* chromaticity diagrams of the tablets (Fig. 8b), as the applied pressure was increased, the chromaticity of the powder tended to gradually approach that of the cast film. By analogy with the luster development observed by rubbing (Section 3.1), the development of a gold luster under pressing led us to assume that the number of edge-on lamellae increased in the tablets under these conditions. To confirm this assumption, we performed XRD measurement using the tablet-10 t sample (Fig. 9).
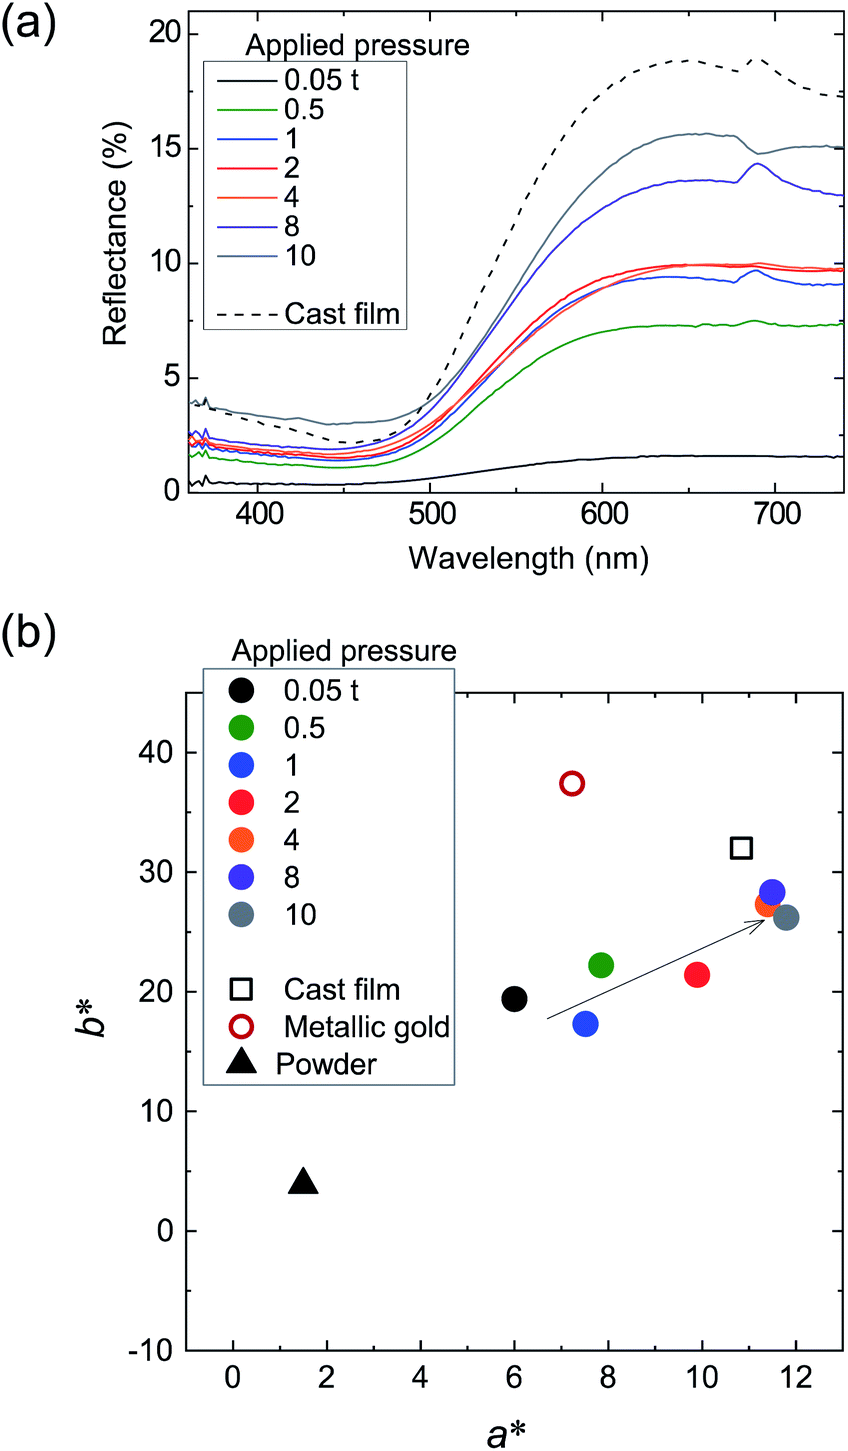 | ||
| Fig. 8 (a) Specular reflection spectra of tablet-0.05 t, tablet-0.5 t, tablet-1 t, tablet-2 t, tablet-4 t, tablet-8 t, and tablet-10 t. The reflection spectrum of a cast film is also included for comparison. (b) a*, b* chromaticity diagrams for the above tablet samples shown with the chromaticities of the cast film, vacuum-evaporated gold film, and O3MeOT powder for comparison. | ||
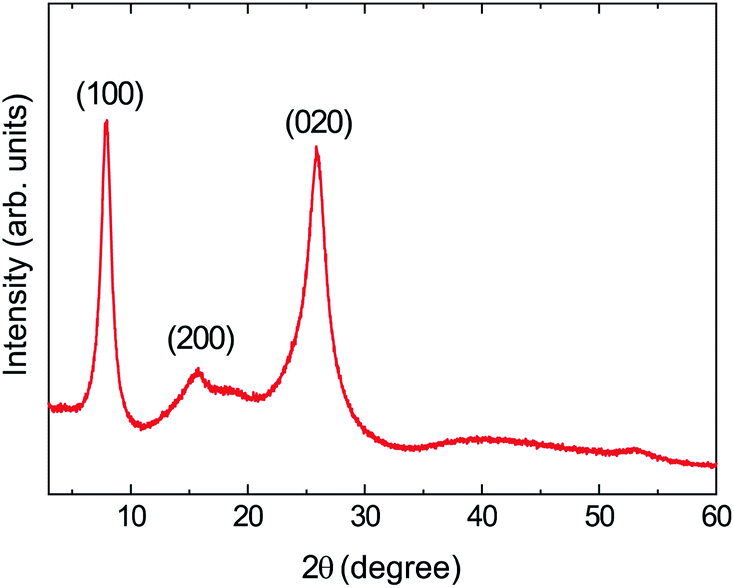 | ||
| Fig. 9 X-ray diffraction pattern of tablet-10 t. | ||
The obtained patterns show peaks at 2θ = 7.81, 15.75, and 25.81°, corresponding to reflections from the (100), (200), and (020) planes, respectively. The positions of these peaks were nearly identical to those of the O3MeOT layer 2 and O3MeOT powder patterns shown in Fig. 6. However, the area ratio γ of the (100) peak to the (020) peak differed from sample to sample. More specifically, γ increased in the order: powder (γ = 0.34) < tablet-10 t (γ = 0.56) < O3MeOT layer 2 (γ = 1.01) < cast film (γ = 9.15). This order is almost identical to that of the maximum reflectance values observed for their corresponding reflection spectra (see Fig. 5b and 8a), indicating that the ratio of edge-on lamellae to face-on lamellae is one of the factors that determines the extent of the luster. However, in tablet-10 t, the increased proportion of edge-on lamellae is likely to be limited to the vicinity of the tablet surface, since the tablet bulk had the same color as the powder, as previously described. Therefore, its value of γ (i.e., 0.56) was only slightly larger than the corresponding value for the powder (i.e., 0.34) owing to the fact that the crystal structures detected in the XRD analysis are likely to contain a substantial contribution from the tablet bulk. Furthermore, it was found that the (100) peaks of O3MeOT layer 2 and tablet-10 t have full widths at half-depths of 0.57° and 1.04°, respectively, indicating that the former has a larger crystallite size in the out-of-plane direction. The above results therefore indicate that rubbing is superior to pressing as a method of producing lusters in terms of a smaller applied pressure, a larger value of γ, and the formation of larger edge-on lamellar crystallites.
Notably, in the tablet samples, the development of the gold tone luster was limited to the near-surface area, even though the same pressure was applied to the tablet bulk and its surface.
It has been previously reported that the surface of the stainless steel die, which is a component of the tablet mold, is covered with a passive film bearing hydroxide residues and bonded water.44–46 Thus, based on the polyalkylthiophene orientation model42 presented by Kim et al., it would be expected that the amount of edge-on lamellae increases close to the die/tablet interface owing to the repulsion between the species having unshared electron pairs (hydroxide residues and bonded water) and the thienyl backbone. However, this repulsion is limited to the interface and does not extend to the tablet bulk, and so the bulk exhibits the same orientation properties as the powder. To confirm this mechanism, it will be necessary to modify the die surface with alkyl groups and investigate whether the face-on orientation becomes dominant close to the tablet surface.
4. Conclusions
In this study, it was found that rubbing or pressing the blackish-brown 3-methoxythiophene oligomer powder produced layers or tablets with a gold-tone color. During rubbing, the application of a higher pressure perpendicular to the powder and the use of an increased number of rubbing cycles resulted in a higher specular reflectance for the obtained layers, and the chromaticity of the resulting layer approached that of metallic gold. X-ray diffraction (XRD) analysis of the layer indicated that rubbing increased the ratio (γ) of edge-on to face-on lamellar crystallites, wherein the former is responsible for the development of the gold-like luster. Although the widely studied rubbing effect for poly(3-alkylthiophene)s results in a face-on lamellar dominance due to the alkyl group orientation effect, this differed from the oligo(3-methoxythiophene) system investigated herein, which contains no alkyl group. More specifically, in this case, the main interaction is the electronic repulsive force between the substrate functional group with unshared electron pairs and the π-electron cloud of the thienyl backbone. Based on this mechanistic model, we assumed that the increase in γ with rubbing was induced by the repulsive force.Furthermore, during the pressing process, an increase in the applied pressure was found to result in a higher specular reflectance for the resulting tablet, and its chromaticity approached that of metallic gold. XRD analysis showed that pressing also increased the value of γ; however, the development of the gold tone was limited to the tablet surface, and the bulk remained blackish brown, i.e., the color of the original powder. We therefore assumed that the existence of repulsive forces between the thienyl skeleton and the unshared electron pairs on the stainless die surface used in the pressing process may be limited to the die/tablet interface and may not extend into the tablet bulk. As a result, the formation of edge-on lamellar crystallites was not induced beyond the surface, and the corresponding gold-like luster failed to develop beyond the surface. Based on our results, the rubbing process shows potential for application in the field of gold-tone decoration because it produces a substantial number of edge-on lamellar crystallites despite the low applied pressure and does not require any special equipment. The rubbing effect observed for oligo(3-methoxythiophene), i.e., the edge-on orientation effect, is therefore expected to contribute to the development of new organic electronics. Future studies will focus on the effect of the chemical composition of the rubbing substrate on the molecular orientations of the resulting layers.
Author contributions
Satoya Sugiura: conceptualization, data curation, formal analysis, investigation, writing – original draft; Terumasa Mitogawa: data curation, investigation, visualization; Kota Saito: data curation, investigation; Rihito Tamura: data curation, investigation; Satoru Tsukada: data curation, writing – review & editing; Takahiko Horiuchi: data curation, formal analysis; Katsuyoshi Hoshino: conceptualization, funding acquisition, project administration, supervision, writing – original draft.Conflicts of interest
There are no conflicts to declare.Acknowledgements
This work was financially supported by the JSPS KAKENHI (Grant 20K05614 to K. H.). The authors thank the Center for Analytical Instrumentation of Chiba University for the XRD and reflectance measurements.References
- F. J. Maile, G. Pfaff and P. Reynders, Prog. Org. Coat., 2005, 54, 150–163 CrossRef CAS.
- H. Liu, H. Ye and Y. Zhang, Colloids Surf., A, 2008, 315, 1–6 CrossRef CAS.
- K. Ogura, R. Zhao, H. Yanai, K. Maeda, R. Tozawa, S. Matsumoto and M. Akazome, Bull. Chem. Soc. Jpn., 2002, 75, 2359–2370 CrossRef CAS.
- R. Zhao, M. Akazome, S. Matsumoto and K. Ogura, Tetrahedron, 2002, 2, 10225–10231 CrossRef.
- R. Zhao, S. Matsumoto, M. Akazome and K. Ogura, Tetrahedron, 2002, 58, 10233–10241 CrossRef CAS.
- K. Ogura, R. Zhao, M. Jiang, M. Akazome, S. Matsumoto and K. Yamaguchi, Tetrahedron Lett., 2003, 44, 3595–3598 CrossRef CAS.
- K. Ogura, R. Zhao, T. Mizuoka, M. Akazome and S. Matsumoto, Org. Biomol. Chem., 2003, 1, 3845–3850 RSC.
- K. Ogura, K. Ooshima, M. Akazome and S. Matsumoto, Tetrahedron, 2006, 62, 2484–2491 CrossRef CAS.
- A. Matsumoto, M. Kawaharazuka, Y. Takahashi, N. Yoshino, T. Kawai and Y. Kondo, J. Oleo Sci., 2010, 59, 151–156 CrossRef CAS PubMed.
- K. Kondo, A. Matsumoto, K. Fukuyasu, K. Nakajima and Y. Takahashi, Langmuir, 2014, 30, 4422–4426 CrossRef PubMed.
- N. Saito, M. Ono, H. Komatsubara, K. Fukushima, Y. Takahashi and Y. Kondo, Dyes Pigm., 2020, 179, 108394 CrossRef CAS.
- Y. Kojima, K. Kishikawa, S. Ichikawa, J. Matsui, K. Hirai, Y. Kondo and M. Kohri, ACS Appl. Polym. Mater., 2021, 3, 1819–1827 CrossRef CAS.
- H. Goto, J. Polym. Sci., Part A: Polym. Chem., 2013, 51, 3097–3102 CrossRef CAS.
- T. Tokuda and K. Hoshino, Polym. J., 2016, 48, 1141–1149 CrossRef CAS.
- H. Takada, T. Ochiai and M. Nagata, Thin Solid Films, 2019, 677, 33–38 CrossRef CAS.
- D. Takamura and K. Hoshino, Chem. Lett., 2018, 47, 540–543 CrossRef CAS.
- R. Tagawa, H. Masu, T. Itoh and K. Hoshino, RSC Adv., 2014, 4, 24053–24058 RSC.
- Y. Takashina, T. Mitogawa, K. Saito and K. Hoshino, Langmuir, 2018, 34, 3049–3057 CrossRef CAS PubMed.
- Y. Takashina and K. Hoshino, Polym. J., 2019, 51, 591–599 CrossRef CAS.
- M. Tachiki, R. Tagawa and K. Hoshino, ACS Omega, 2020, 5, 24379–24388 CrossRef CAS PubMed.
- M. Tachiki, S. Tsukada and K. Hoshino, Dyes Pigm., 2021, 190, 109302 CrossRef CAS.
- M. Kubo, H. Doi, R. Saito, K. Horikoshi, S. Tsukada and K. Hoshino, Polym. J., 2021, 53, 1019–1029 CrossRef CAS.
- M. Kubo, M. Tachiki, T. Mitogawa, K. Saito, R. Saito, S. Tsukada, T. Horiuchi and K. Hoshino, Coatings, 2021, 11, 861 CrossRef CAS.
- M. Brinkmann, L. Hartmann, L. Biniek, K. Tremel and N. Kayunkid, Macromol. Rapid Commun., 2014, 35, 9–26 CrossRef CAS PubMed.
- W. A. Memon, Y. Zhang, J. Zhang, Y. Yan, Y. Wang and Z. Wei, Macromol. Rapid Commun. DOI:10.1002/marc.202100931.
- R. Zhu, A. Kumar and Y. Yang, Adv. Mater., 2011, 23, 4193–4198 CrossRef CAS PubMed.
- L. Hartmann, K. Tremel, S. Uttiya, E. Crossland, S. Ludwigs, N. Kayunkid, C. Vergnat and M. Brinkmann, Adv. Funct. Mater., 2011, 21, 4047–4057 CrossRef CAS.
- V. Vohra, G. Arrighetti, L. Barba, K. Higashimine, W. Porzio and H. Murata, J. Phys. Chem. Lett., 2012, 3, 1820–1823 CrossRef CAS PubMed.
- D. Kajiya, S. Ozawa, T. Koganezawa and K. Saitow, J. Phys. Chem. C, 2015, 119, 7987–7995 CrossRef CAS.
- D. Kajiya, T. Koganezawa and K. Saitow, J. Phys. Chem. C, 2016, 120, 23351–23357 CrossRef CAS.
- J.-C. Wittmann and P. Smith, Nature, 1991, 352, 414–417 CrossRef CAS.
- M. Misaki, Y. Ueda, S. Nagamatsu, M. Chikamatsu, Y. Yoshida, R. Azumi, N. Tanigaki and K. Yase, Appl. Phys. Lett., 2005, 87, 243503 CrossRef.
- N. Tanigaki, S. Nagamatsu, W. Takashima and Y. Yoshida, Thin Solid Films, 2009, 518, 853–856 CrossRef CAS.
- H. Sirringhaus, P. J. Brown, R. H. Friend, M. M. Nielsen, K. Bechgaard, B. M. W. Langeveld-Voss, A. J. H. Spiering, R. A. J. Janssen, E. W. Meijer, P. Herwig and D. M. de Leeuw, Nature, 1999, 401, 685–688 CrossRef CAS.
- L. Biniek, N. Leclerc, T. Heiser, R. Bechara and M. Brinkmann, Macromolecules, 2013, 46, 4014–4023 CrossRef CAS.
- V. Untilova, J. Hynynen, A. I. Hofmann, D. Scheunemann, Y. Zhang, S. Barlow, M. Kemerink, S. R. Marder, L. Biniek, C. Müller and M. Brinkmann, Macromolecules, 2020, 53, 6314–6321 CrossRef CAS PubMed.
- M. J. Winokur, P. Wamsley, J. Moulton, P. Smith and A. J. Heeger, Macromolecules, 1991, 24, 3812–3815 CrossRef CAS.
- T. J. Prosa, M. J. Winokur, J. Moulton, P. Smith and A. J. Heeger, Macromolecules, 1992, 25, 4364–4372 CrossRef CAS.
- R. D. McCullough, S. Tristram-Nagle, S. P. Williams, R. D. Lowe and M. Jayaraman, J. Am. Chem. Soc., 1993, 115, 4910–4911 CrossRef CAS.
- K. E. Aasmundtveit, E. J. Samuelsen, M. Guldstein, C. Steinsland, O. Flornes, C. Fagermo, T. M. Seeberg, L. A. A. Pettersson, O. Inganäs, R. Feidenhans'l and S. Ferrer, Macromolecules, 2000, 33, 3120–3127 CrossRef CAS.
- Y. Qu, L. Li, G. Lu, X. Zhou, Q. Su, W. Xu, S. Li, J. Zhang and X. Yang, Polym. Chem., 2012, 3, 3301–3307 RSC.
- D. H. Kim, Y. D. Park, Y. Jang, H. Yang, Y. H. Kim, J. I. Han, D. G. Moon, S. Park, T. Chang, C. Chang, M. Joo, C. Y. Ryu and K. Cho, Adv. Funct. Mater., 2005, 15, 77–82 CrossRef CAS.
- Y. Nakamura, Y. Suzuki and Y. Watanabe, Thin Solid Films, 1996, 290–291, 367–369 CrossRef CAS.
- G. Okamoto, Corros. Sci., 1973, 13, 471–489 CrossRef CAS.
- J. Ruijing, W. Yuwu, W. Xu, C. Changfeng and Z. Jingmao, Appl. Surf. Sci., 2017, 412, 214–222 CrossRef.
- G. Okamoto and T. Shibata, Nature, 1965, 208, 1350 CrossRef.
Footnote |
| † Electronic supplementary information (ESI) available: Photograph of O3MeOT milled in a mortar; surface morphology observation for O3MeOT tablets; variable-angle spectral reflectance measurements. See https://doi.org/10.1039/d2ra03538c |
| This journal is © The Royal Society of Chemistry 2022 |