
 Open Access Article
 This Open Access Article is licensed under a Creative Commons Attribution-Non Commercial 3.0 Unported Licence
Probing the role of surface activated oxygen species of CeO2 nanocatalyst during the redox cycle in CO oxidation†
Ruishi Zhang‡
a,
Xiaoyuan Liu‡b,
Hai Lianga,
Xijun Yanga,
Jing Licd,
Wenfeng Ye e,
Xiaomin Wang*a and
Baodan Liu*cd
e,
Xiaomin Wang*a and
Baodan Liu*cd
aLiaoning Key Laboratory of Chemical Additive Synthesis and Separation, Yingkou Institute of Technology, Bowen Road, Yingkou, 115014, China. E-mail: wangxm@yku.edu.cn
bSchool of Materials Science and Engineering, University of Science and Technology of China, No. 72 Wenhua Road, Shenyang 110016, China
cSchool of Material Science and Engineering, Northeastern University, No. 11 Wenhua Road, Shenyang 110819, China. E-mail: baodanliu@hotmail.com
dFoshan Graduate School of Innovation, Northeastern University, No. 2 Zhihui Road, Foshan 528311, China
eFoshan Dongfo Surface Technology Co. Ltd., No. 99, Taoyuan East Road, Foshan, 528200, China
First published on 15th September 2022
Abstract
The oxygen species of CeO2 nanocatalysts plays a key role in the CO oxidation. In this work, nanocrystalline CeO2 with infrared spectroscopy detectable surface superoxide (O2−) species at room temperature is fabricated and CO oxidation is used as a probe reaction for the exploration of the characteristics of surface O2− species on the CeO2 surface. We discover that the surface O2− species have ignorable influences on the overall reaction rate of CO oxidation on pure ceria by comparing P-CeO2 (CeO2 prepared by precipitation method) with HT-CeO2 (CeO2 prepared by hydrothermal method). It is concluded that the reaction between CO molecules and surface O2− species is the first and the fast step in the whole redox cycle, while the release of surface lattice oxygen is the second and the rate determining step of the catalysts. This work gives an intuitionistic exploration on the redox properties of pure nanocrystalline CeO2 with surface O2− species and reveals the influences of these species in the whole redox circle of CO oxidation.
Introduction
Ceria is one of the most attractive materials in the catalysis industry (three-way catalysts, CO oxidation, etc.) due to its excellent oxygen storage/release capacity (OSC/ORC).1,2 As a typical reducible oxide, pure ceria is n-type catalyst which usually shows weaker CO oxidation capability than those p-type oxides (Co3O4, CuO, NiO, etc.).3–5 However, the considerable amount of oxygen vacancies on the surface lead to diverse absorption features of non-stoichiometrical ceria.6 Thus, the non-stoichiometrical ceria loaded with noble metal nanoparticles is usually applied in varieties of selective catalytic reactions.7,8Over the past few decades, the preparation of nanocrystalline ceria with tunable catalytic properties greatly boosts the usage of it in catalytic chemistry.9–12 Nanocrystalline ceria owns huge surface area and much higher degree of non-stoichiometry features than bulk one.13 These merits favor the formation of surface defects and lead to a significant enhancement of OSC/ORC of nanocrystalline ceria. For example, Avelino et al. reported Au loaded nanocrystalline CeO2 shows two orders of magnitude reaction rate than Au loaded bulk ceria.14 Very recently, researchers discovered the existence of activated oxygen (Oxy (2 ≤ x ≤ 3, −2 ≤ y ≤ 0)) on the surface of nanocrystalline ceria at room temperature (RT), which is usually regarded as catalytically active component.15 Previous works have demonstrated the oxygen release under low temperatures (∼400 °C) using H2-TPR measurement and attributed it to the existence of superoxide ions (O2−) verified by electron paramagnetic resonance (EPR) spectral methods.16–19 Since then, extensive experimental efforts in combination with computer studies are applied to examine the existence of activated oxygen and this phenomenon is mostly regarded as an exclusive character of CeO2 nanocrystals.20,21 However, H2-TPR test could only reflect the reducibility of nanocrystalline CeO2, while the role of ceria in catalytic converters is actually more complex than that of a simple oxygen capacitor. Therefore, a complete catalytic reaction including both reduction and oxidation at the same time on the surface of the catalysts should be designed, and the influence of “activated oxygen” on the CO oxidation of nanocrystalline CeO2 should be systemically investigated.
In this regard, we fabricated two types of ultra-small ceria nanoparticles: CeO2 polyhedron with O2− species at room temperature prepared by precipitation method (P-CeO2) and CeO2 polyhedron without surface O2− prepared by hydrothermal method followed by annealing treatment (HT-CeO2).9 In addition, commercial CeO2 (3.5 N purity, C-CeO2) large particles purchased from SCRC were also used as contrast group in the perspective of size effect. Finally, CO oxidation as the probe reaction to explore the surface features of nanocrystalline CeO2 was carried out on the basis of series of characterizations of X-ray diffraction (XRD), scanning electron microscopy (SEM), transmission electron microscopy (TEM) and Raman, etc.
Experimental
The polyhedral HT-CeO2 was prepared through an organic–inorganic two liquid phase process followed by ambient annealing at 400 °C.9 During the first procedure, 0.634 g cerium(III) nitrate hexahydrate and 35 mL deionized water were mixed in a 100 mL Teflon autoclave, then 35 mL toluene, 4.875 mL oleic acid and 0.875 mL tert-butylamine were sequentially injected into the autoclave without stirring. The sealed autoclave was then heated at 180 °C for 24 h. After the autoclave cools down to room temperature, the upper organic solution was isolated and mixed with two fold volume of ethanol. The CeO2 nanoparticles were separated through centrifugation and then washed with cyclohexane and ethanol for several times. For the second procedure, the obtained CeO2 sediment was re-dispersed into cyclohexane. The solution was dried at 100 °C for 2 h, and then heated at 400 °C for 4 h to remove the organic residue.The polyhedral P-CeO2 was prepared through a precipitation method followed by ambient annealing at 500 °C.19 At first, 1.5 g cerium(III) nitrate hexahydrate was dissolved in 50 mL deionized water followed by addition of ammonium hydroxide dropwise. The obtained yellow turbid liquid was magnetically stirred for 30 minutes under room temperature. The sediment was centrifuged, washed with deionized water and then dried in air at 100 °C overnight. Finally, the obtained yellow powder was grinded using agate mortar and annealed in air at 400 °C for 4 h.
Commercial CeO2 large particles of 3.5 N purity nanocube, the ca. from SCRC were used as control group.
The phase and crystallographic nature of samples were characterized by powder X-ray diffraction (XRD, Rigaku D/max 2400) with Cu kα as the X-ray source (λkα = 0.154056 nm). The morphologies of samples were characterized by a field-emission scanning electron microscopy (FE-SEM, Hitachi SU-70). The microstructures of HT-CeO2 and P-CeO2 were analyzed using a 200 kV transmission electron microscopy (TEM, Tecnai G2 F20). UV-Vis diffuse reflectance spectra (DRS) of ceria were obtained on a HITACHI U-3900 spectrophotometer with an integrating sphere using BaSO4 as the reference. X-ray photoelectron spectroscopy (XPS, Thermal VG/ESCALAB250) was used to characterize surface feature of samples. IR absorption spectra were collected using a Fourier transform infrared (FT-IR, BRUKER VERTEX 70v) spectroscopy with KBr as the beam splitter. Raman spectrum was obtained through the Raman spectrometer (HORIBA LabRAM HR Evolution) under the irradiation of 532 nm laser.
CO oxidation reaction was performed at atmospheric pressure in a tubular quartz reactor. For each test, 80 mg of catalysts was diluted through the addition of 500 mg quartz sand, after then, silica wool was put in both end of the catalysts. The feed gas was kept at a lean CO condition (ratio of partial pressure: p(CO) = 0.998%, p(O2) = 20.04%) using He as the balance gas. The total gas flow rate was maintained at 10 sccm using mass flowmeters (HORIBA METRON S49 32/MT). An online gas chromatograph (FULI INSTRUMENTS GC9790Plus) equipped with automatic six-way valve in combination with thermal conductivity detector (TCD) was used to analyze the feeding gas.
Results and discussion
Fig. 1 shows the structure information of all three types of CeO2 nanostructures used in this work. It can be seen that all the CeO2 nanocatalysts are well crystallized and show cubic structure. There is no any impurity peak in XRD pattern, indicating the good phase purity of as-synthesized HT-CeO2 and P-CeO2, as well as commercial C-CeO2. From Fig. 1b we can find the peak position and the full width at half maximum (FWHM) of cubic P-CeO2 and HT-CeO2 nanoparticles show high consistency in crystallographic symmetry and phase purity. Fig. 1c shows the particle size distribution of HT-CeO2 nanocubes and we can also calculate the average particle radius of 5.13 nm of HT-CeO2 through a simple statistical analysis. From Fig. 1b, we can also notice that the purchased C-CeO2 shows much sharper peaks and the peak position shifts slightly towards the high angle direction. All these differences indicate that P-CeO2 and HT-CeO2 show obvious lattice expansion due to the size effect, as observed in Fig. 1d.22 | ||
| Fig. 1 (a and b) XRD patterns of HT-CeO2, P-CeO2, C-CeO2; (c) the particle size distribution of HT-CeO2 nanocubes; the calculated average particle size if 5.13 nm; (d) the plot of (111) interplanar spacing of HT-CeO2, P-CeO2 and C-CeO2 as a dependence of particle size. | ||
The morphologies and exposed facets of P-CeO2, HT-CeO2 and C-CeO2 are also elaborately investigated using SEM and TEM techniques since the catalytic properties of CeO2 nanocrystals are strongly dependent on the surface active sites.23,24 For HT-CeO2 before annealing treatment, a uniform distribution of ultra-small cubic nanoparticles can be observed from the TEM bright-field image (Fig. 2a). The HT-CeO2 exhibits an obvious single crystal nature and the interplanar distance of HT-CeO2 from the direct measurement in HRTEM image (Fig. 2b) matches well with d-spacing of (002) plane in cubic CeO2 (JCPDS no. 34-0394; a = b = c = 5.41 Å) and in good combination with the result obtained from the fast Fourier transform (FFT) pattern taken along [−100] zone axis (Fig. 2c). In addition, the main exposed facets of CeO2 nanocube can be confirmed to be (001) crystalline planes. After 400 °C annealing in air, the crystal grain size becomes larger (10.9 nm, Fig. 2d) and the proportion of (111) exposed facets increases (Fig. S1†). Further annealing the CeO2 nanocubes at 650 °C in Ar can cause fierce crystal growth and particle agglomeration. Moreover, the (111) facets evolve into the main exposed facets of HT-CeO2 (Fig. S2†). Similarly, the P-CeO2 also shows a polyhedral morphology with (002) and (111) exposed facets (Fig. 2g, h and S3†). Both annealed HT-CeO2 and P-CeO2 are well crystallized, as confirmed by the clear lattice images and their corresponding FFT patterns (Fig. 2f and i).
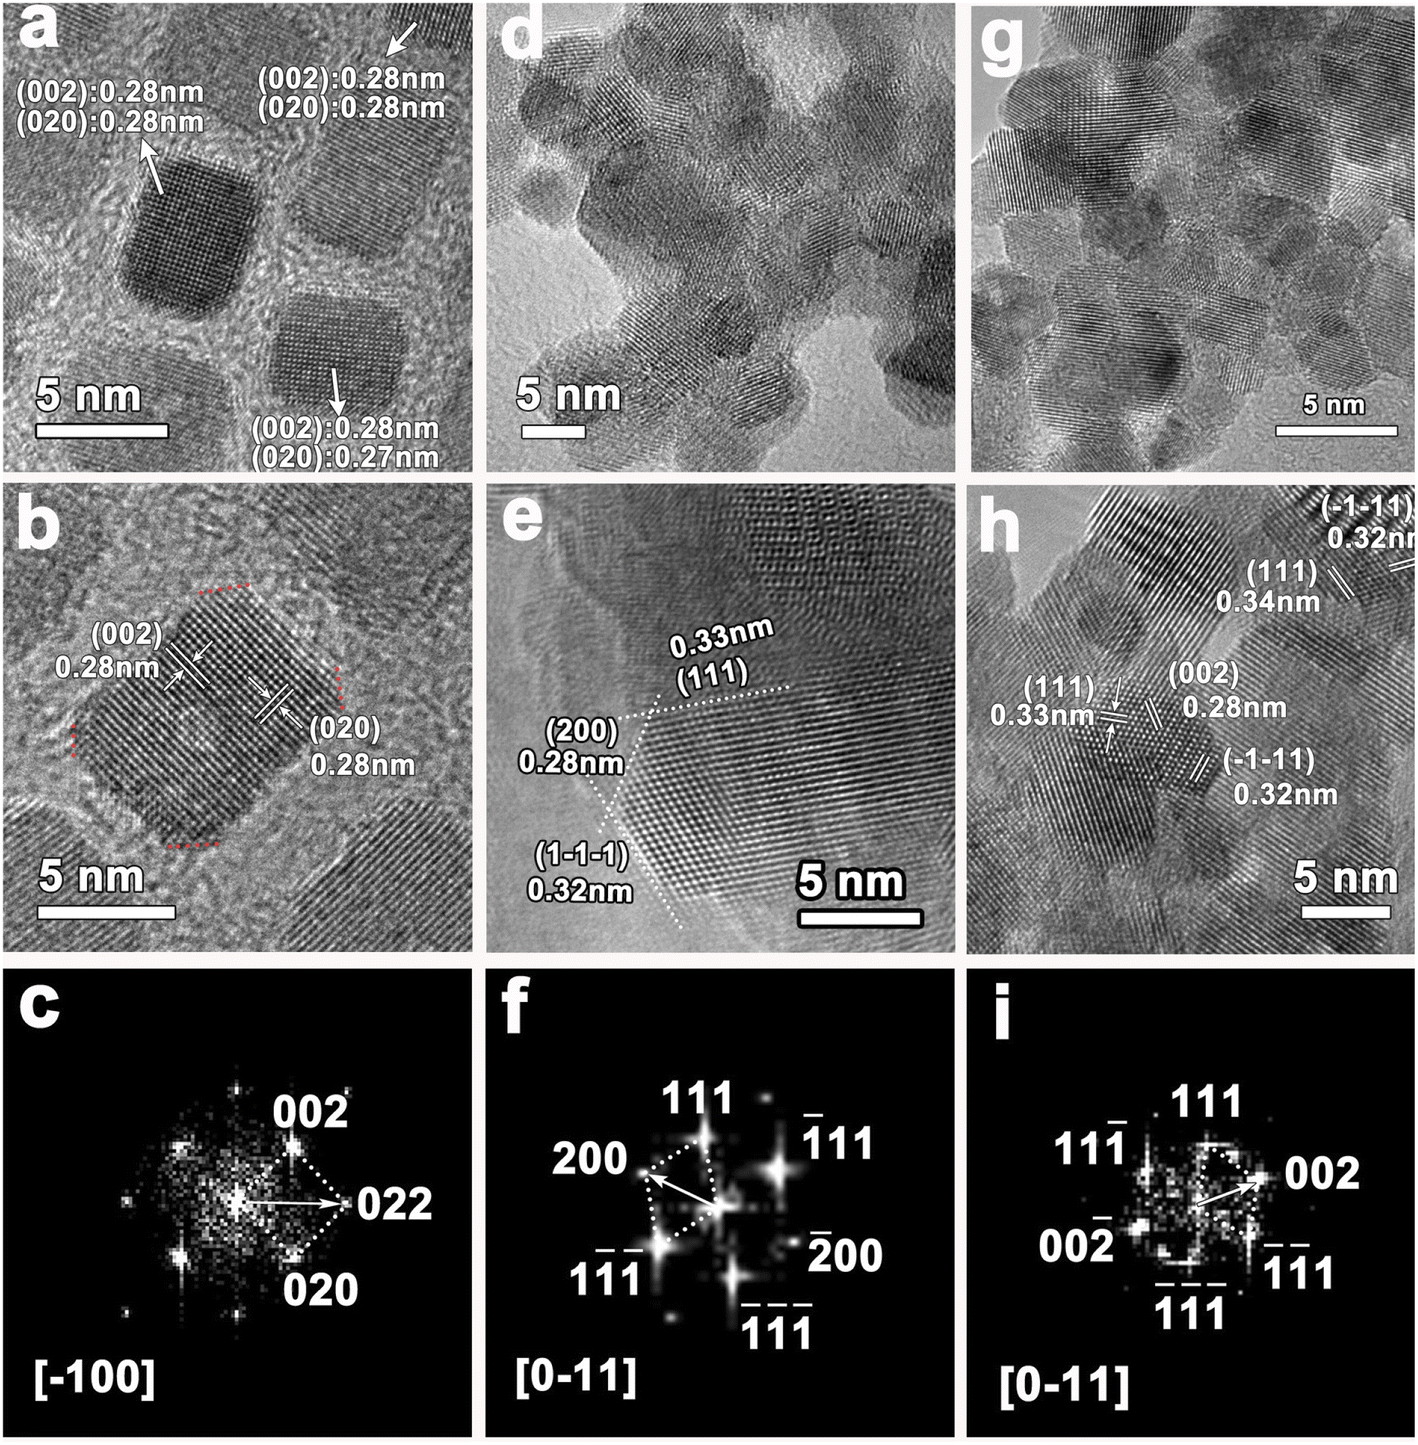 | ||
| Fig. 2 TEM bright field images, HRTEM images and their corresponding FFT patterns of (a–c) HT-CeO2 nanocube before annealing; (d–f) HT-CeO2 after 400 °C annealing; and (g–i) P-CeO2. | ||
For comparative study, the morphology of commercially purchased CeO2 (C-CeO2) is also presented (Fig. S4†). The similarity of size and shape between P-CeO2 and HT-CeO2 allows us to make a comparative investigation on the O2− species. The ultra-small HT-CeO2 shows no 400 °C peak in IR spectrum at RT (Fig. 3a). It is understood that the surface of HT-CeO2 is fully covered with oleic acid during the hydrothermal reaction, and the oleic acid layer is finally converted into surface carbonates after subsequent annealing, which can be confirmed by IR measurement (Fig. S5†).25 Contrast to HT-CeO2, P-CeO2 shows a characteristic IR peak at around 1150 cm−1, which originates from O2− species.26 It is known that the surface carbonates are spectators in a certain CO oxidation process and the possibilities of side reaction involving surface carbonates can be eliminated.25 The Brunauer–Emmett–Teller (BET) surface area value of P-CeO2 and HT-CeO2 is also similar (Table 1), which is much larger than that of C-CeO2. From the isothermal adsorption–desorption curves shown in Fig. S6,† we can see that all the three CeO2 nanocatalysts show a typical type IV curve, but the N2 adsorption behaviour in the three catalysts is different. At low pressure, the C-CeO2 shows the weakest N2 adsorption, while the HT-CeO2 exhibits the best; at medium and high pressure, the C-CeO2 and P-CeO2 show more obvious hysteresis compared with HT-CeO2. Then we can conclude the proportion of micropores of HT-CeO2 is higher than that of P-CeO2 while the P-CeO2 sample owns a higher amount of mesopores. In addition, from Table 1 we can see that the particle size of P-CeO2 and HT-CeO2 is maintained at approximately the same value (11.8 nm for P-CeO2 and 10.9 nm for HT-CeO2), which is calculated through the FWHM of (111) peak in XRD patterns using Scherrer equation (Fig. 1a).
 | ||
| Fig. 3 (a) FT-IR spectra of HT-CeO2, P-CeO2 and C-CeO2, the peak at 1150 cm−1 of P-CeO2 indicates the existence of superoxide; (b) diffuse reflectance UV-Vis spectroscopy of HT-CeO2, P-CeO2 and C-CeO2; (c and d) normalized Raman spectra of HT-CeO2, P-CeO2 and C-CeO2, the Raman shift at 600 cm−1 corresponds to the oxygen vacancy and the red shift of F2g peaks of P-CeO2 and C-CeO2 indicates the lattice relaxation caused by size effect. | ||
| Sample | Size (nm) | d(111) (Å) | SBET (m2 g−1) |
|---|---|---|---|
| HT-CeO2 | 10.8 | 3.142 | 100.19 |
| P-CeO2 | 11.9 | 3.140 | 81.67 |
| C-CeO2 | >1000 | 3.123 | 5.93 |
Ceria is best-known for its excellent OSC/ORC and the oxygen species including oxygen vacancy, lattice oxygen and absorbed oxygen show significant influence on the catalytic performance.27,28 For nanosized ceria, there are also a considerable amount of oxygen vacancies spontaneously generated on the surface and in body at room temperature except for superoxide adsorption. Oxygen vacancy is an intrinsic defect which has a strong influence on the optical property of nanocrystalline ceria. UV-Vis spectroscopy is used to qualitatively detect these defects in CeO2 samples (Fig. 3b). It can be seen that the C-CeO2 shows an optical absorption edge near 380 nm (3.26 eV), which can be understood as the electron hopping from O 2p orbit to Ce 4f orbit.29,30 Both HT-CeO2 and P-CeO2 samples exhibit an obvious red-shift and broadened absorption edge against C-CeO2, which is somehow contradicted to the blue-shift result obtained by other groups.19 Considering the ultra-small size (∼10 nm) of HT-CeO2 and P-CeO2, the effect of exciton–LO-phonon coupling can be employed to explain the red-shift of UV-Vis absorption edge. Exciton–LO-phonon coupling is induced by the large number of defects in ceria and can influence the carrier effective mass and carrier scattering by the lattice.31 According to the theory of Kazunori et al.32 and the experimental results of other groups, this exciton–LO-phonon effect enhances with the increase of quantum-dot radius and can lead to the broadening and the red-shift of adsorption edge.9,31 When the CeO2 size is smaller (i.e. 4.6 nm), the quantum confinement effect will play the key role to induce the blue-shift.19 To further convince our results, Raman spectroscopy is also used to ascertain the existence of oxygen vacancies (Fig. 3c and d). We can see the existence of oxygen vacancy peaks (600 cm−1) and the slight red-shift of F2g peaks of HT-CeO2 and P-CeO2 compared with C-CeO2, which originates from the lattice expansion induced by oxygen vacancies.33,34 The degree of lattice expansion in the three types of CeO2 can be quantitatively evaluated through the XRD data in the sequence of:
| d(HT-CeO2) > d(P-CeO2) > d(C-CeO2) |
To further determine and quantitatively measure the surface species of ceria, XPS experiment is carried out (Fig. 4a–c). There are two C 1s peaks detected in HT-CeO2 and P-CeO2, which can be classified as C pollution (284.6 eV, C–C, C–H bonds) and O–C![[double bond, length as m-dash]](https://www.rsc.org/images/entities/char_e001.gif) O species (288.6 eV). The peak of O–CO species in P-CeO2 further verifies the existence of surface carbonates. Considering the absence of carbon reagent during P-CeO2 preparation, the surface carbonates are probably formed through the participation of CO2 from atmosphere during annealing. Further annealing treatment in Ar at 650 °C can fully remove these surface carbonates (Fig. S7†). However, the particle size becomes larger due to the aggregation and the quantum size effect vanishes subject to the high temperature annealing. Even so, the carbonate peaks of P-CeO2 are weaker than that of HT-CeO2 (Fig. 4a). The smaller carbonate coverage gives way to the exposure of super oxide species of P-CeO2 sample. To further analyse the chemical valence of Ce ion, the Ce XPS peak is split into Ce3+ and Ce4+ based on their featured binding energy position and the details of XPS curve fitting can be found in ESI.† It can be seen that both Ce3+ and Ce4+ species are detected in all samples, and the peaks located at 899.1, 881.1, 903.2 and 885.0 eV (Table S1†) correspond to the v0, u0, v′ and u′ shake-down final states of Ce3+, while the other six peaks centered at 882.4, 901.0, 888.5, 907.3, 898.1 and 916.5 eV can be classified as the v, u, v′′, u′′ and v′′′, u′′′ shake-down final states of Ce4+ (Fig. 4c).35,36 The Ce3+ species are originated from the simultaneously formed oxygen vacancies, which means that one oxygen vacancy will create two Ce3+ sites and result in the non-stoichiometry of ceria. The quantitative proportion of surface Ce3+ (Ce3+/Ce percentage) can be calculated to 7.97% for C-CeO2, 28.43% for P-CeO2 and 28.15% for HT-CeO2, respectively.36 Three O 2s peaks located at around 529.4, 531.6 and 532.8 eV are also detected in all samples (Fig. 4b). The O 1s peak located at around 529.4 eV corresponds to lattice oxygen for all samples. The 531.6 eV peak can be indexed to the oxygen vacancy for HT-CeO2 and C-CeO2. It has been reported that the position of oxygen vacancy peak and super oxygen peak are identical.37 Considering the existence of O2− on P-CeO2 surface, the peak at 531.6 eV of P-CeO2 should be classified as the combination of surface O2− and oxygen vacancy. The peak at around 532.8 eV is usually regarded as surface hydroxy.19,38 While for P-CeO2 and HT-CeO2 in this work, this peak should originate from the combination of surface hydroxy and surface carbonate. Correspondingly, the proportions of surface oxygen vacancies are 10.18% for C-CeO2 and 26.75% for HT-CeO2, respectively. It should be noted that the value 23.72% is the combination of oxygen vacancies and O2− species for P-CeO2. Based on XPS results, we can find the remarkable enhancement of Ce3+ and oxygen vacancies on the surface of nanoceria due to the lower oxygen vacancy formation energy at the low coordinated sites and the smaller bond strength of nanoceria. The result is also in good agreement with the studies of other groups.19,37,39
O species (288.6 eV). The peak of O–CO species in P-CeO2 further verifies the existence of surface carbonates. Considering the absence of carbon reagent during P-CeO2 preparation, the surface carbonates are probably formed through the participation of CO2 from atmosphere during annealing. Further annealing treatment in Ar at 650 °C can fully remove these surface carbonates (Fig. S7†). However, the particle size becomes larger due to the aggregation and the quantum size effect vanishes subject to the high temperature annealing. Even so, the carbonate peaks of P-CeO2 are weaker than that of HT-CeO2 (Fig. 4a). The smaller carbonate coverage gives way to the exposure of super oxide species of P-CeO2 sample. To further analyse the chemical valence of Ce ion, the Ce XPS peak is split into Ce3+ and Ce4+ based on their featured binding energy position and the details of XPS curve fitting can be found in ESI.† It can be seen that both Ce3+ and Ce4+ species are detected in all samples, and the peaks located at 899.1, 881.1, 903.2 and 885.0 eV (Table S1†) correspond to the v0, u0, v′ and u′ shake-down final states of Ce3+, while the other six peaks centered at 882.4, 901.0, 888.5, 907.3, 898.1 and 916.5 eV can be classified as the v, u, v′′, u′′ and v′′′, u′′′ shake-down final states of Ce4+ (Fig. 4c).35,36 The Ce3+ species are originated from the simultaneously formed oxygen vacancies, which means that one oxygen vacancy will create two Ce3+ sites and result in the non-stoichiometry of ceria. The quantitative proportion of surface Ce3+ (Ce3+/Ce percentage) can be calculated to 7.97% for C-CeO2, 28.43% for P-CeO2 and 28.15% for HT-CeO2, respectively.36 Three O 2s peaks located at around 529.4, 531.6 and 532.8 eV are also detected in all samples (Fig. 4b). The O 1s peak located at around 529.4 eV corresponds to lattice oxygen for all samples. The 531.6 eV peak can be indexed to the oxygen vacancy for HT-CeO2 and C-CeO2. It has been reported that the position of oxygen vacancy peak and super oxygen peak are identical.37 Considering the existence of O2− on P-CeO2 surface, the peak at 531.6 eV of P-CeO2 should be classified as the combination of surface O2− and oxygen vacancy. The peak at around 532.8 eV is usually regarded as surface hydroxy.19,38 While for P-CeO2 and HT-CeO2 in this work, this peak should originate from the combination of surface hydroxy and surface carbonate. Correspondingly, the proportions of surface oxygen vacancies are 10.18% for C-CeO2 and 26.75% for HT-CeO2, respectively. It should be noted that the value 23.72% is the combination of oxygen vacancies and O2− species for P-CeO2. Based on XPS results, we can find the remarkable enhancement of Ce3+ and oxygen vacancies on the surface of nanoceria due to the lower oxygen vacancy formation energy at the low coordinated sites and the smaller bond strength of nanoceria. The result is also in good agreement with the studies of other groups.19,37,39
 | ||
| Fig. 4 (a–c) C 1s, O 1s and Ce 3d XPS peaks of HT-CeO2, P-CeO2 and C-CeO2. | ||
Finally, we evaluated the CO oxidation properties of three CeO2 samples under lean CO conditions (excessive oxygen). The light-off curves of HT-CeO2 show the best CO oxidation ability (T50: 273 °C, Table S2†) without performance decay during 12 h period at 287 °C (Fig. 5). The P-CeO2 sample shows a little bit higher conversion temperature at T50 and the slower reaction rate than that of HT-CeO2. The catalytic performance of HT-CeO2 and P-CeO2 samples are both much higher than C-CeO2 because of the larger surface area of HT-CeO2 and P-CeO2 and more exposed active sites. Additionally, the HT-CeO2 and P-CeO2 contain larger proportions of low coordinated Ce ions and larger amount of surface oxygen vacancies than C-CeO2, which can remarkably reduce the vacancy formation energy.22,40,41 As a result, the CO oxidation temperature of nanoceria could be distinctly reduced compared with that of commercial C-CeO2. We also calculate the activation energy (Ea) of all three samples according to the Arrhenius plots and find that the HT-CeO2 shows the lowest Ea of 48.6 kJ, followed by P-CeO2 (55.4 kJ). It should be noted that the calculation is based on the premise that the concentrations of adsorbed reacting species on CeO2 nanocatalysts is constant in the investigated temperature range. Taking into account the strong surface effect during CO oxidation on HT-CeO2 and P-CeO2, we can also calculate the reaction rates based on surface area (Fig. 5e) and the obtained values of HT-CeO2 and P-CeO2 exhibit high degree of consistence. It seems that the surface O2− species have no influence on the overall CO oxidation rate of P-CeO2. IR test (Fig. S8†) is further implemented on P-CeO2 after CO oxidation and a noticeable difference is found that the O2− peak has been vanished. It should be noted that the O2− species can also form at the surface of ceria at relatively high temperature. Soria et al.17 reported that the O2− forms under the temperature higher than 300 °C, but disappears at room temperature. Therefore, it can be asserted that the O2− species on P-CeO2 (11.8 nm) is not so stable at room temperature.
 | ||
| Fig. 5 (a) Light-off curves of HT-CeO2, P-CeO2 and C-CeO2; (b) reaction rates of HT-CeO2 and P-CeO2; (c) Arrhenius plots of HT-CeO2 and P-CeO2; (d) catalytic stability experiment of HT-CeO2 in a period of 12 hours; (e) reaction rates of HT-CeO2 and P-CeO2 based on surface areas. Reaction conditions: catalyst, 80 mg; p(CO): 0.998%; p(O2): 20%; gas flow rate: 10 mL min−1. | ||
Herein a probable reaction route is proposed for the explanation of CO oxidation on nanoceria with O2− species (Fig. 6). According to the molecular orbital theory, the bond energy of O2− is weaker than O2 because the bond order of O2− (1.5) is smaller than O2 (2.0). For this reason, the O2− species on P-CeO2 will firstly react with CO under relatively lower temperature and leave a lattice oxygen, which can be considered as the fast reaction step in the whole redox cycle. The remaining lattice oxygen then reacts with CO and creates an oxygen vacancy on the surface. In this step, the desorption of CO2 requires the bond-breaking of Ce–O. According to previous work, the energy barrier for CO2 desorption in this step is around 2.17 eV, while the energy barrier involves O–O bond-breaking is about 0.84 eV.7 The formation rate of oxygen vacancy tends to be very low especially at low temperature due to the high oxygen vacancy formation energy. Hence, the second reaction should be the rate determining step. Finally, the oxygen molecules are chemisorbed on oxygen vacancies to form new O2− species at elevated temperatures.
 | ||
| Fig. 6 Schematic diagram describing the reaction route of O2− contained P-CeO2 in the whole redox cycle during CO oxidation. | ||
Conclusions
In summary, the CO oxidation as a probe reaction for evaluating catalytic performance of HT-CeO2, P-CeO2 and C-CeO2 has been designed and carried out. It has been found that there is no apparent catalytic performance improvement in O2− contained P-CeO2. The CO oxidation rate should be directly governed by the second step including the Ce–O bond-breaking along with oxygen vacancy formation. Finally, it should be noted that in our experiment, although the synthesized P-CeO2 powders owns O2− species under room temperature, these superoxide ion species are unstable and show low fraction of coverage on the surface of the 11.8 nm P-CeO2. It is expected that CeO2 nanoparticles (no larger than 10 nm) with ultra clean surface and superior thermal stability at 400 °C will be ideal candidate for further investigation of the surface Oxy (2 ≤ x ≤ 3, −2 ≤ y ≤ 0) species in CO oxidation. It is believed that this study can expand the understanding of the influences of surface O2− species on the catalytic properties of nanocrystalline ceria in a whole redox cycle and will put forward references for the catalytic study in the system of metal/CeO2, and so forth.Conflicts of interest
There are no conflicts to declare.Acknowledgements
This work was supported by the Foundation of Liaoning Key Laboratory of Chemical Additive Synthesis and Separation with grant no. ZJNK2009, the Program for Innovative Research Team in Yingkou Institute of Technology with grant no. 112301004, Liaoning Revitalization Talents Program with grant no. XLYC2007185, Guiding Plan Project of Liaoning Natural Science Foundation with grant no. 2019-ZD-0369.Notes and references
- T. Montini, M. Melchionna, M. Monai and P. Fornasiero, Chem. Rev., 2016, 116, 5987–6041 CrossRef CAS PubMed.
- R. Kopelent, J. A. van Bokhoven, J. Szlachetko, J. Edebeli, C. Paun, M. Nachtegaal and O. V. Safonova, Angew. Chem., 2015, 54, 8728–8731 CrossRef CAS PubMed.
- Z. Ren, V. Botu, S. Wang, Y. Meng, W. Song, Y. Guo, R. Ramprasad, S. L. Suib and P. X. Gao, Angew. Chem., 2014, 53, 7223–7227 CrossRef CAS PubMed.
- M. Luo, J. Ma, J. Lu, Y. Song and Y. Wang, J. Catal., 2007, 246, 52–59 CrossRef CAS.
- X. Liu, K. Wang, Y. Zhou, X. Zhang, X. Tang, P. Ren, X. Jiang and B. Liu, J. Alloys Compd., 2019, 792, 644–651 CrossRef CAS.
- A. Tschtipe, J. Y. Ying and H. L. Tuller, Sens. Actuators, B, 1996, 31, 4 Search PubMed.
- H. Y. Kim, H. M. Lee and G. Henkelman, J. Am. Chem. Soc., 2012, 134, 1560–1570 CrossRef CAS PubMed.
- A. Ruiz Puigdollers, P. Schlexer, S. Tosoni and G. Pacchioni, ACS Catal., 2017, 7, 6493–6513 CrossRef CAS.
- F. Dang, K. Kato, H. Imai, S. Wada, H. Haneda and M. Kuwabara, Cryst. Growth Des., 2010, 10, 4537–4541 CrossRef CAS.
- H.-X. Mai, L.-D. Sun, Y.-W. Zhang, R. Si, W. Feng, H.-P. Zhang, H.-C. Liu and C.-H. Yan, J. Phys. Chem. B, 2005, 109, 24380–24385 CrossRef CAS PubMed.
- D. Zhang, X. Du, L. Shi and R. Gao, Dalton Trans., 2012, 41, 14455–14475 RSC.
- D. Ghosh, S. Parwaiz, P. Mohanty and D. Pradhan, Dalton Trans., 2020, 49, 17594–17604 RSC.
- A. Trovarelli and J. Llorca, ACS Catal., 2017, 7, 4716–4735 CrossRef CAS.
- S. Carrettin, P. Concepcion, A. Corma, J. M. Lopez Nieto and V. F. Puntes, Angew. Chem., 2004, 43, 2538–2540 CrossRef CAS.
- X. Huang and M. J. Beck, Chem. Mater., 2015, 27, 5840–5844 CrossRef CAS.
- M. Haneda, T. Mizushima and N. Kakuta, J. Chem. Soc., Faraday Trans., 1995, 91, 4459–4465 RSC.
- J. Soria, A. Martinezarias and J. C. Conesa, J. Chem. Soc., Faraday Trans., 1995, 91, 1669–1678 RSC.
- J. Soria, J. M. Coronado and J. C. Conesa, J. Chem. Soc., Faraday Trans., 1996, 92, 1619–1626 RSC.
- N. K. Renuka, N. Harsha and T. Divya, RSC Adv., 2015, 5, 38837–38841 RSC.
- Z. L. Wu, M. J. Li, J. Howe, H. M. Meyer and S. H. Overbury, Langmuir, 2010, 26, 16595–16606 CrossRef CAS PubMed.
- J. Kullgren, K. Hermansson and P. Broqvist, J. Phys. Chem. Lett., 2013, 4, 604–608 CrossRef CAS PubMed.
- X. D. Zhou and W. Huebner, Appl. Phys. Lett., 2001, 79, 3512–3514 CrossRef CAS.
- K. Zhou, X. Wang, X. Sun, Q. Peng and Y. Li, J. Catal., 2005, 229, 206–212 CrossRef CAS.
- Z. Hu, X. Liu, D. Meng, Y. Guo, Y. Guo and G. Lu, ACS Catal., 2016, 6, 2265–2279 CrossRef CAS.
- A. Holmgren, B. Andersson and D. Duprez, Appl. Catal., B, 1999, 22, 215–230 CrossRef CAS.
- C. Li, K. Domen, K. Maruya and T. Onishi, J. Am. Chem. Soc., 1989, 111, 7683–7687 CrossRef CAS.
- M. Prasad, K. Ray, A. Sinhamahapatra and S. Sengupta, J. Mater. Sci., 2022, 57, 2839–2856 CrossRef CAS.
- P. Pal, S. K. Pahari, A. Sinhamahapatra, M. Jayachandran, G. V. M. Kiruthika, H. C. Bajaj and A. B. Panda, RSC Adv., 2013, 3, 10837 RSC.
- D. D. Koelling, A. M. Boring and J. H. Wood, Solid State Commun., 1983, 47, 227–232 CrossRef CAS.
- F. Marabelli and P. Wachter, Phys. Rev. B: Condens. Matter Mater. Phys., 1987, 36, 1238–1243 CrossRef CAS.
- C. Sun, H. Li, H. Zhang, Z. Wang and L. Chen, Nanotechnology, 2005, 16, 1454–1463 CrossRef CAS.
- K. A. Kazunori Oshiro and M. Matsuura, Phys. Rev. B: Condens. Matter Mater. Phys., 1999, 59, 6 Search PubMed.
- S. Tsunekawa, R. Sahara, Y. Kawazoe and K. Ishikawa, Appl. Surf. Sci., 1999, 152, 4 CrossRef.
- Y. Huang, B. Long, M. Tang, Z. Rui, M.-S. Balogun, Y. Tong and H. Ji, Appl. Catal., B, 2016, 181, 779–787 CrossRef CAS.
- E. Bêche, P. Charvin, D. Perarnau, S. Abanades and G. Flamant, Surf. Interface Anal., 2008, 40, 264–267 CrossRef.
- S. K. Pahari, P. Pal, A. Sinhamahapatra, A. Saha, C. Santra, S. C. Ghosh, B. Chowdhury and A. B. Panda, RSC Adv., 2015, 5, 45144–45151 RSC.
- J. Xu, J. Harmer, G. Li, T. Chapman, P. Collier, S. Longworth and S. C. Tsang, Chem. Commun., 2010, 46, 1887–1889 RSC.
- X. Wang, Z. Jiang, B. Zheng, Z. Xie and L. Zheng, CrystEngComm, 2012, 14, 7579 RSC.
- C. D. A. B. Shik Chi Tsang, P. C. H. Mitchell and A. J. Ramirez-Cuesta, J. Phys. Chem. B, 2001, 105, 6 Search PubMed.
- S. P. P. Dutta and M. S. Seehra, Chem. Mater., 2006, 18, 3 Search PubMed.
- A. Migani, G. N. Vayssilov, S. T. Bromley, F. Illas and K. M. Neyman, J. Mater. Chem., 2010, 20, 10535 RSC.
Footnotes |
| † Electronic supplementary information (ESI) available. See https://doi.org/10.1039/d2ra03533b |
| ‡ The authors contribute equally to this work. |
| This journal is © The Royal Society of Chemistry 2022 |