
 Open Access Article
 This Open Access Article is licensed under a Creative Commons Attribution-Non Commercial 3.0 Unported Licence
Light-emitting diode (LED)-directed green synthesis of silver nanoparticles and evaluation of their multifaceted clinical and biological activities
Sumaira Anjum *a,
Rimsha Chaudharya,
Amna Komal Khana,
Mariam Hashima,
Iram Anjuma,
Christophe Hanob and
Bilal Haider Abbasic
*a,
Rimsha Chaudharya,
Amna Komal Khana,
Mariam Hashima,
Iram Anjuma,
Christophe Hanob and
Bilal Haider Abbasic
aDepartment of Biotechnology, Kinnaird College for Women, 92-Jail Road, Lahore-54000, Pakistan. E-mail: sumaira.anjum@kinnaird.edu.pk; Tel: +92-3006957038
bLaboratoire de Biologie des Ligneux et des Grandes Cultures, INRAE USC1328, University of Orleans, 45067 Orléans CEDEX 2, France
cDepartment of Biotechnology, Quaid-i-Azam University, Islamabad-45320, Pakistan
First published on 10th August 2022
Abstract
The trend of using plant extracts for the synthesis of nanoparticles has increased in recent years due to environmental safety, low cost, simplicity and sustainability of the green route. Moreover, the morphology of NPs can be fine-tuned by applying abiotic factors such as LEDs, which enhance the bio-reduction of the precursor salt and excite phytochemicals during their green synthesis. Considering this, in present study, the green synthesis of AgNPs was carried out using Dalbergia sissoo leaf extract under the illumination of red, green, blue, yellow and white LEDs. The phytochemical profile of the leaf extract in terms of total phenolic and flavonoid content was responsible for the effective synthesis of AgNPs, where alcohols and phenols were mainly involved in the capping and bio-reduction of the NPs. Moreover, the XRD data showed the face center cubic crystalline nature of the AgNPs with the interesting finding that the LEDs helped to reduce the size of the AgNPs significantly. Among the samples, Y-DS-AgNPs (34.63 nm) were the smallest in size, with the control having a size of 87.35 nm. The LEDs not only reduced the size of the AgNPs but also resulted in the synthesis of non-agglomerated AgNPs with different shapes including spherical, triangular, and hexagonal compared to the mixed-shape control AgNPs, as shown by the SEM analysis. These LED-directed AgNPs showed extraordinary therapeutic potential especially B-DS-AgNPs, which exhibited the highest anti-oxidant, anti-glycation and anti-bacterial activities. Alternatively, Y-DS-AgNPs were the most cytotoxic towards HepG2 cells, inducing intracellular ROS/RNS production, accompanied by a disruption in the mitochondrial membrane potential, caspase-3 gene activation and induction of caspase-3/7 activity. Lastly, AgNPs showed mild toxicity towards brine shrimp and moderately hemolyzed hRBCs, showing their biosafe nature. Here, we conclude that external factors such as LEDs are effective in controlling the morphology of AgNPs, which further enhanced their therapeutic efficacy.
1. Introduction
There is an emerging trend of using greener approaches in every area of research to improve and protect the environment. Accordingly, a recent focus in the field of nano-biotechnology is the synthesis of nanoparticles (NPs) using biological entities, which overcomes the disadvantages of physicochemical methods for the synthesis of NPs. Amongst the various biological entities used for the green synthesis of NPs, plant-mediated synthesis has attracted the most attention given that it is a simple, rapid, energy efficient and eco-friendly method with easy handling and availability of plants throughout the year.1 Therefore, in our study, the green synthesis of silver nanoparticles (AgNPs) was carried out using Dalbergia sissoo leaf extract, which possesses a high level of phytochemicals such as iso-flavones, coumarins, neoflavonols and flavonols having biological properties including antimicrobial, analgesic, antioxidant, anti-inflammatory, antipyretic and osteogenic properties.2 Many medicinally important plants have been explored by researchers for the synthesis of AgNPs; however, the synthesis of light-emitting diode (LED)-exposed AgNPs from D. sissoo has not been reported to date. The role of LEDs in the chemical/physical synthesis of AgNPs has been reported by many scientists but the plant-mediated synthesis of AgNPs under LED exposure has scarcely been studied. LEDs have high energy bands, small divergent angle and high emission intensity, and therefore they can be used as a source of excitation in photochemical reactions, which play a role in the size- and shape-controlled synthesis of NPs.3Lee et al.4 explored the role of sunlight and different LEDs on the S. miltiorrhiza-mediated synthesis of AgNPs. Their results showed the generation of surface plasmon resonance (SPR) bands due to the excitation of free electrons in the AgNPs under LED illumination, resulting in their faster synthesis. The rationale for the use of LEDs for the effective synthesis of NPs includes their high photon efficiency, power stability, low voltage of electricity and low cost,5 making them suitable for the large-scale synthesis of eco-friendly AgNPs.
Among the metallic nanoparticles, AgNPs are the most important due to their extensive biomedical applications, as evident by the fact that they are the most commercialized NPs with a production of about 500 tons per year.6 AgNPs are considered to be safe and biocompatible given that a clinical study reported no clinically important toxic effects of commercial colloidal silver products on patients when administered as an antibacterial agent.7 Recently, Wypij et al.8 showed the anti-bacterial and anti-cancerous activities of biogenic AgNPs as an alternative treatment option. The other biomedical applications of AgNPs include their beneficial role in treating diabetes-related complications and aging through the inhibited formation of advanced glycation end-products (AGEs).9 The significant therapeutic applications of AgNPs is accredited to their capability to scavenge reactive nitrogen species and reactive oxygen species, which is termed antioxidant activity. AgNPs mediate their antioxidant activity by neutralizing free radicals via hydrogen atom transfer or electron transfer.10 The efficiency of NPs greatly depends on their morphological properties, which can be tuned by factors such as LED exposure during their synthesis. Therefore, this research work sheds light on the role of LEDs (green, blue, red, white and yellow) in fine-tuning the morphological characteristics of AgNPs synthesized via the green route, and subsequently their influence on the biological applications of AgNPs including anti-bacterial, anti-oxidant (FRAP, CUPRAC, ORAC and ABTS), anti-glycation, anti-cancer (cell viability, mitochondrial membrane potential, intracellular ROS/RNS generation, caspase-3 gene expression and caspase-3/7 activity), biocompatibility with hRBCs and toxicity against brine shrimp larvae.
2. Materials and methods
All chemicals used in this study were purchased from Sigma-Aldrich, USA, and used as received without further purification.2.1. Dalbergia sissoo leaf extract preparation
Leaves of D. sissoo (sheesham) were freshly plucked and verified by the Department of Botany, Kinnaird College for Women, Lahore. 10 g leaves was dry weighed and washed with tap water and distilled water thrice. The washed leaves were set to boil in 400 mL distilled water on a burner and its volume reduced to 100 mL. The mixture was ground in a pestle and mortar and filtered with Whatman's filter paper. The leaf extract filtrate was stored at 4 °C for the synthesis of AgNPs.2.2. Evaluation of phytochemical content and free radical scavenging activity of Dalbergia sissoo leaf extract
The total phenolic contents (TPC) of the D. sissoo leaf extract was measured by Folin–Ciocalteu's method, while the total flavonoid content (TFC) was measured using the aluminum chloride colorimetric method according to Khan et al.1 For TPC, 1 mL leaf extract or gallic acid standard (97.5%, 50–1000 μg mL−1), 0.5 mL Folin–Ciocalteu's reagent and 5 mL distilled water were added to a test-tube. The mixture was shaken well and incubated at room temperature (RT) for 5 min, and 1.5 mL of 20% sodium carbonate (99.5%) and distilled water were added to make the total volume of 5 mL. The mixture developed a deep blue color. Lastly, the mixture was incubated for 2 h at RT and the absorbance of the standard was measured at 750 nm using a spectrophotometer (Analytik Jena, Specord 200 plus, Jena, Germany). The TPC value of the leaf extract was measured from a gallic acid standard curve (y = 0.00004x + 0.0089, R2 = 0.9953) and expressed as mg g−1 of gallic acid equivalent in milligrams per gram (mgGAE g−1) of dry extract.For TFC, 1 mL D. sissoo extract/quercetin standard (25–200 μg mL−1), 0.2 mL of 1 M potassium acetate (99.99%), 5.6 mL distilled water and 0.2 mL of 10% (w/v) AlCl3 (98%) were added to a test tube, shaken and incubated for 30 min at RT. The absorbance of the standard was measured at 415 nm using a spectrophotometer. The TFC value of the leaf extract was measured from the standard curve of quercetin (y = 0.0057x + 0.0127, R2 = 0.9973) and expressed as quercetin equivalent (QE) per gram DW.
TPC and TFC were measured using following equation:
 | (1) |
Free radical scavenging activity (FRSA) was evaluated to measure the antioxidant potential of the D. sissoo leaf extract using DPPH (2,2-diphenyl-1-picrylhydrazyl, 97%) according to the protocol reported by Anjum et al.11 Briefly, 0.5 mL leaf extract and 4.5 mL DPPH (3.2 mg/100 mL methanol) were mixed in a test tube and incubated for 1 h at RT. The absorbance of the mixture and standard was measured using a spectrophotometer at 517 nm. FRSA was expressed as a percentage of discoloration of DPPH calculated from the equation as follows:
 | (2) |
2.3. Green synthesis of AgNPs under LED exposure
AgNPs were synthesized using the leaf extract under LED exposure, as reported by Anjum et al.12 with minor modification. 0.01 M sliver nitrate solution (SNS, 99.99%) and 1 mL leaf extract (LE) were mixed in 12 v/v ratios (i.e., 1![[thin space (1/6-em)]](https://www.rsc.org/images/entities/char_2009.gif) :1, 1:2, 1:3, 1:4, 1:5, 1:6, 1:7, 1:8, 1:9, 1:10, 1:15 and 1:20) to identify an appropriate ratio for the optimal synthesis of AgNPs. Accordingly, 1:4 was selected as the best, given that an instant color change from greenish yellow to dark brown was observed and it showed stability without a change in absorbance even after 1 month. Using a ratio of 1:4, AgNPs were synthesized under exposure to 5 types of LEDs including red (640–650 nm), blue (460–465 nm), green (530–540 nm), white (450–455 nm) and yellow (590–595 nm). All the LEDs had a luminous intensity of 17000 mcd, with the typical voltage of 3.1–3.4 V and forward current of 20 mA. For the preparation of AgNPs, the mixture of SNS and LE was continuously stirred under exposure to each LED together with constant monitoring using a UV-Visible spectrophotometer. After the synthesis of the AgNPs using each LED, the reaction mixture was micro-centrifuged at 13000g rpm for 10 min, and then the pellets were re-suspended in distilled water. This step was repeated thrice. The control D. sissoo-mediated AgNPs (DS-AgNPs) and five different types of AgNPs were formed, i.e., red LED mediated (R-DS-AgNPs), blue LED mediated (B-DS-AgNPs), green LED mediated (G-DS-AgNPs), white LED mediated (W-DS-AgNPs) and yellow LED mediated (Y-DS-AgNPs), which were subjected to further characterization and biological activities.
:1, 1:2, 1:3, 1:4, 1:5, 1:6, 1:7, 1:8, 1:9, 1:10, 1:15 and 1:20) to identify an appropriate ratio for the optimal synthesis of AgNPs. Accordingly, 1:4 was selected as the best, given that an instant color change from greenish yellow to dark brown was observed and it showed stability without a change in absorbance even after 1 month. Using a ratio of 1:4, AgNPs were synthesized under exposure to 5 types of LEDs including red (640–650 nm), blue (460–465 nm), green (530–540 nm), white (450–455 nm) and yellow (590–595 nm). All the LEDs had a luminous intensity of 17000 mcd, with the typical voltage of 3.1–3.4 V and forward current of 20 mA. For the preparation of AgNPs, the mixture of SNS and LE was continuously stirred under exposure to each LED together with constant monitoring using a UV-Visible spectrophotometer. After the synthesis of the AgNPs using each LED, the reaction mixture was micro-centrifuged at 13000g rpm for 10 min, and then the pellets were re-suspended in distilled water. This step was repeated thrice. The control D. sissoo-mediated AgNPs (DS-AgNPs) and five different types of AgNPs were formed, i.e., red LED mediated (R-DS-AgNPs), blue LED mediated (B-DS-AgNPs), green LED mediated (G-DS-AgNPs), white LED mediated (W-DS-AgNPs) and yellow LED mediated (Y-DS-AgNPs), which were subjected to further characterization and biological activities.
2.4. Characterization of LED-mediated green-synthesized AgNPs
The AgNPs were characterized using techniques including UV-Visible spectroscopy, scanning electron microscopy (SEM), energy-dispersive X-ray (EDX), Fourier-transform infrared spectroscopy (FTIR) and X-ray diffraction (XRD).The progress of the green synthesis of AgNPs under LED illumination was checked by recording their UV–Vis spectra in the range of 350–750 nm using a spectrophotometer.
The FTIR analysis was performed following the method reported by Tungmunnithum et al.13 using a Bruker (Palaiseau, France) V70 interferometer in the wavenumber range of 400–4500 cm−1.
The shape of the AgNPs was determined by SEM at different magnifications using a SIGMA model SEM (MIRA3; TESCAN, Brno, Czech Republic), while an EDX detector attached to the SEM was used to analyze the elemental composition and purity of the AgNPs.
The crystalline nature of the AgNPs was evaluated by XRD using an X-ray diffractometer (Shimadzu-Model, XRD6000). Furthermore, the size of the AgNPs was calculated using the Debye–Scherrer equation.14
2.5. Antibacterial activities of LED-mediated green-synthesized AgNPs
The antibacterial activity of the AgNPs was evaluated against Bacillus subtilis, Pseudomonas fluorescens and Pseudomonas aeruginosa by the well-diffusion method, as described by Abbasi et al.15 Firstly, stock cultures of B. subtilis, P. aeruginosa and P. fluorescens were revived on nutrient agar (NA) followed by swabbing a single colony of the bacterial strains on Mueller-Hinton agar (MHA) to assess the antibacterial activity of the AgNPs. 15 μL of 0.1 M SNS (positive control), LE (negative control), 10 mg mL−1 AgNPs and 10 μg per disc tetracycline antibiotic discs (Thermo Fisher Scientific™ Oxoid™) were added to the wells on MHA plates. The plates were incubated at 37 °C overnight and the zones of inhibition were measured in millimeters (mm).2.6. Antioxidant activities of LED-mediated green-synthesized AgNPs
2.7. Anti-glycation activities of LED-mediated green-synthesized AgNPs
The anti-glycation activity of the AgNPs was measured as % inhibition of AGEs by following the protocol of Shah et al.19 The AgNP solution was mixed with 20 mg mL−1 BSA solution (Sigma Aldrich) prepared in phosphate buffer (0.1 M; pH 7.4), 1 mL of phosphate buffer (0.1 M; pH 7.4) containing sodium azide 0.02% (w/v) and glucose solution (0.5 M; Sigma Aldrich) prepared in phosphate buffer and incubated for 5 days at 37 °C in the dark. The formation of the fluorescent AGEs was verified using a VersaFluor fluorometer (Bio-Rad, France) with the emission and excitation wavelengths set at 410 nm and 330 nm, respectively.2.8. Anti-cancerous activities of AgNPs
 | (3) |
The Apo-ONE Homogeneous Caspase-3/7 Assay kit (Promega) was used to evaluate in vitro caspase-3/7 activity following the manufacturer's instructions. All the data was measured in triplicate.
2.9. Biocompatibility of AgNPs
000 rpm for 10 min. 100 μL supernatant was taken in a 96-well plate and a BioTek ELX800 absorbance microplate reader (BioTek Instruments, France) was used to measure the release of hemoglobin at 540 nm. Triton X-100 (positive) and DMSO (negative) acted as the controls. The results are expressed as % hemolysis using the following formula:
 | (4) |
2.10. Statistical analysis
All data was evaluated statistically to measure the mean and standard deviation by using SPSS (Windows Version 7.5.1, SPSS Inc., Chicago, IL, USA). The data was expressed as mean ± SD.3. Results and discussion
3.1. Evaluation of phytochemical content and free radical scavenging activity of Dalbergia sissoo leaf extract
The leaf extract of D. sissoo was rich in phenolic content, where in our study the TPC was measured to be 23.6 ± 0.76 mgGAE g−1 DW. In accordance with our findings, Kamboj et al.23 also reported a high TPC of 31.29 ± 0.29 mg GA/100 g in D. sissoo. The enriched phenolic content indicates the good metal chelating and reducing potential of D. sissoo leaf extract during the synthesis of NPs.The TFC of D. sissoo calculated for this study was 1.65 ± 0.01 mgQE gDW−1. Yasmeen et al.24 reported the highest TFC in an aqueous leaf extract of D. sissoo (156.66 ± 0.002 mgQE gextract−1) compared to the bark and fruit aqueous extract. In numerous studies, flavonoids are reported to be the major contributors during the plant-mediated synthesis of AgNPs given that hydroxyl groups play a role in reducing Ag ions into AgNPs.25
The FRSA of the D. sissoo leaf extract was found to be 80.84% ± 0.87%. Previous studies have also shown the significant antioxidant activities of D. sissoo extract such as 13.19% FRSA at 300 μg mL−1 concentration was reported for its methanolic extract.26 Our findings suggest that aqueous D. sissoo extracts have significant antioxidant potential, which means effective metal ion reduction during the biosynthesis of NPs by electron donation.
3.2. Optimization of green synthesis of AgNPs
For the synthesis of AgNPs, firstly the v/v ratio of leaf extract (LE) and silver nitrate solution (SNS) was optimized (1:1, 1:2, 1:3, 1:4, 1:5, 1:6, 1:7, 1:8, 1:9, 1:10, 1:15 and 1:20) and the best ratio showing the fastest synthesis and stabilization was chosen. Among the ratios, 1:1, 1:2 and 1:20 did not show any peak when monitored using a Specord-200 UV-Vis spectrometer in the wavelength range of 350–750 nm. In contrast, 1:4 was selected as best given that its synthesis and capping were completed within 24 h without a change in absorbance (Fig. 1). The intensity of the color change increased with time to a darker tone. All ratios were observed at room temperature for 6–48 h. After 24 h of reaction, no increase in color change and absorbance was observed in the 1:4 ratio, whereas in the case of the 1:5, 1:6 and 1:7 reaction mixtures, there was no change in color but the absorbances of all these ratios kept changing even after 48 h of incubation, which indicated the instability of the AgNPs synthesized using these ratios. Among the ratios tested, the reaction mixture of 1:4 showed no change in absorbance after 24 h, which indicates the high stability of the AgNPs synthesized in this ratio. Moreover, the highest absorbance was also shown by the 1:4 reaction mixture among the ratios, which indicates the highest yield of AgNPs. Due to the higher stability and yield of the 1:4 reaction mixture, this ratio was selected for the further synthesis of AgNPs under different LED illumination.
 | ||
| Fig. 1 Optimization of AgNPs at different ratios (v/v LE/SNS). (a) Initial change in color of reaction mixtures (LE + SNS) in all ratios. (b) Change in color of reaction mixture after 6 h incubation. (c) Change in color after 24 h incubation. (d) Color change after 48 h incubation. | ||
The synthesis and stabilization of all the AgNPs in all ratios were monitored between 6–48 h, as shown in Fig. 2a and b. Initially, no peaks were observed for the 1:1, 1:7, 1:9 and 1:20 ratios after 6 h of incubation, indicating no AgNPs were synthesized using these ratios. Even the 1:20 ratio showed no peak after 24 h of incubation, where the synthesis started in this ratio after 48 h of incubation. In contrast, there was an increase in the absorbance of the 1:4 ratio between 6–24 h but no change after 24 h, which indicates that the synthesis of AgNPs was completed without a further increase in absorbance after 48 h of incubation (Fig. 2c). Alternatively, with an increase in reaction time, the other ratios show distorted peaks or no significant increase in absorbance, which suggests the slow and unstable synthesis of AgNPs. It was found that the 1:4 ratio showed the highest absorbance (4.23) with a stable peak among the tested ratios. Jalab et al.27 evaluated the effect of the optimum extract and sliver nitrate ratio and concluded that an increase in the extract concentration yielded bigger-sized AgNPs.
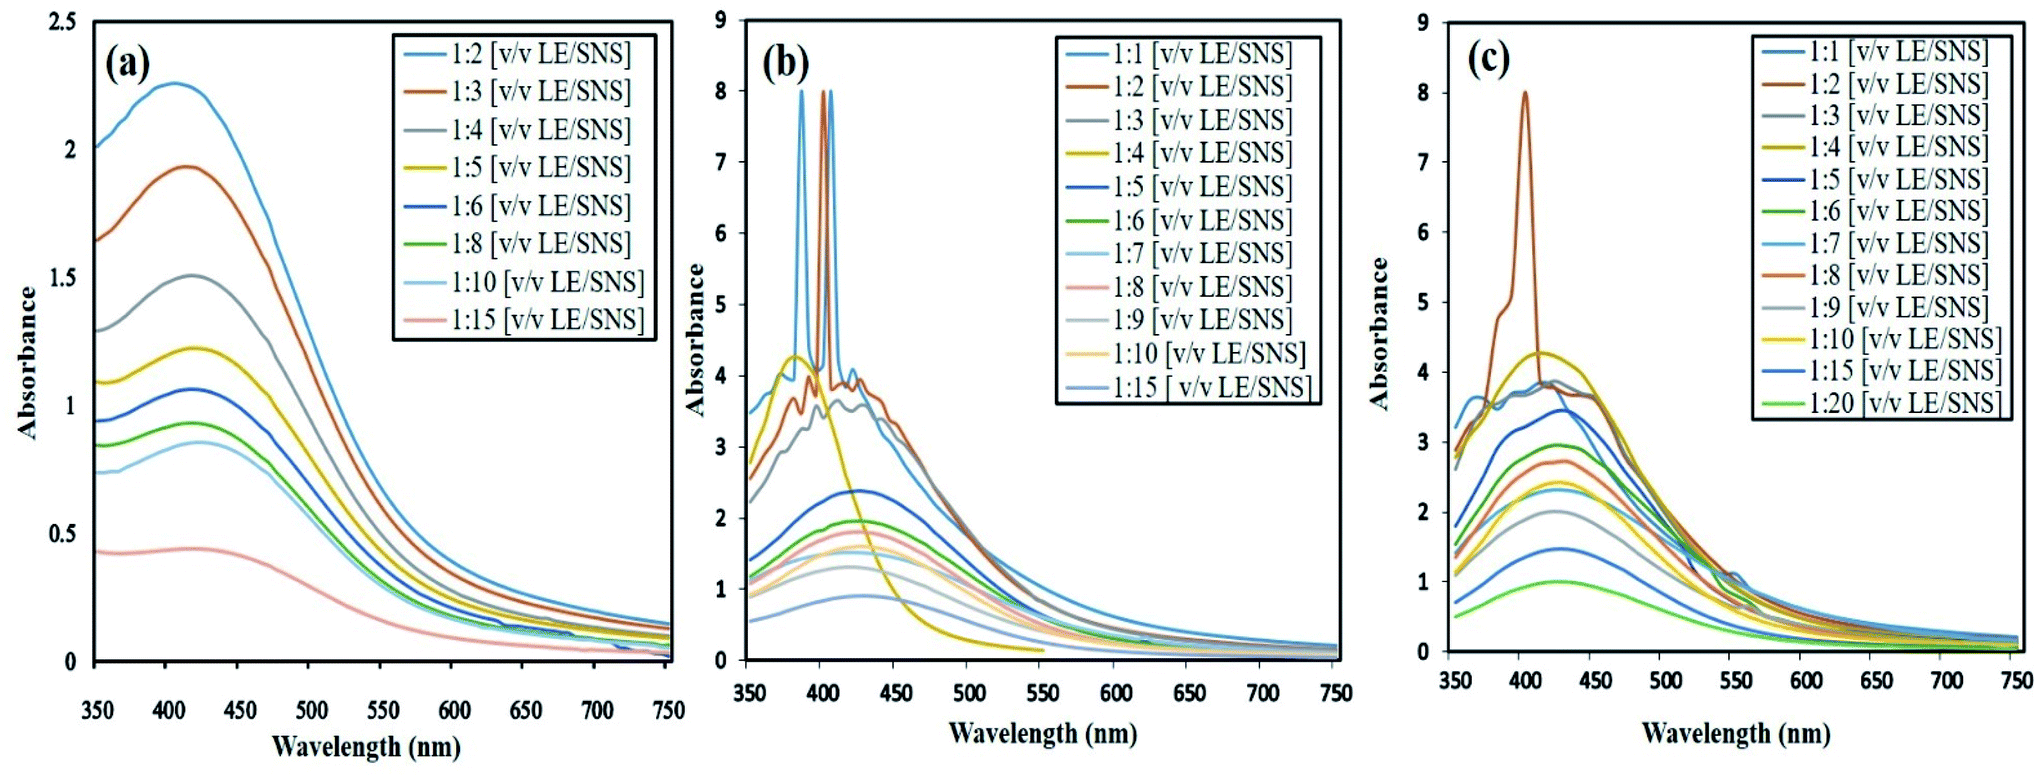 | ||
| Fig. 2 Optimization of 12 ratios of AgNPs. (a) UV-visible spectra at 6 h, (b) 24 h and (c) 48 h incubation period. | ||
3.3. Characterization of LED-mediated green-synthesized AgNPs
:4 ratio of LE and SNS, AgNPs were synthesized under LED exposure, and as shown in Fig. 3a–d, after 30 min of blue and red LED exposure, distorted peaks were formed between 420–440 nm. Meanwhile, the AgNPs synthesized with exposure to green, yellow and white LEDs were stable for 2 h. Therefore, the green synthesis of AgNPs under each LED exposure was carried out for 30 min, given that distorted peaks were observed after 30 min. Nguyen et al.28 also reported the accelerated bioreduction of Ag ions under LED exposure, particularly a blue LED compared to the control. The UV-visible spectrum revealed the important role of SNS and phytochemicals in the synthesis of AgNPs. Peaks were observed between 400–450 nm for all the AgNPs, corresponding to the absorbance by AgNPs due to excitation of surface plasmon vibration.29
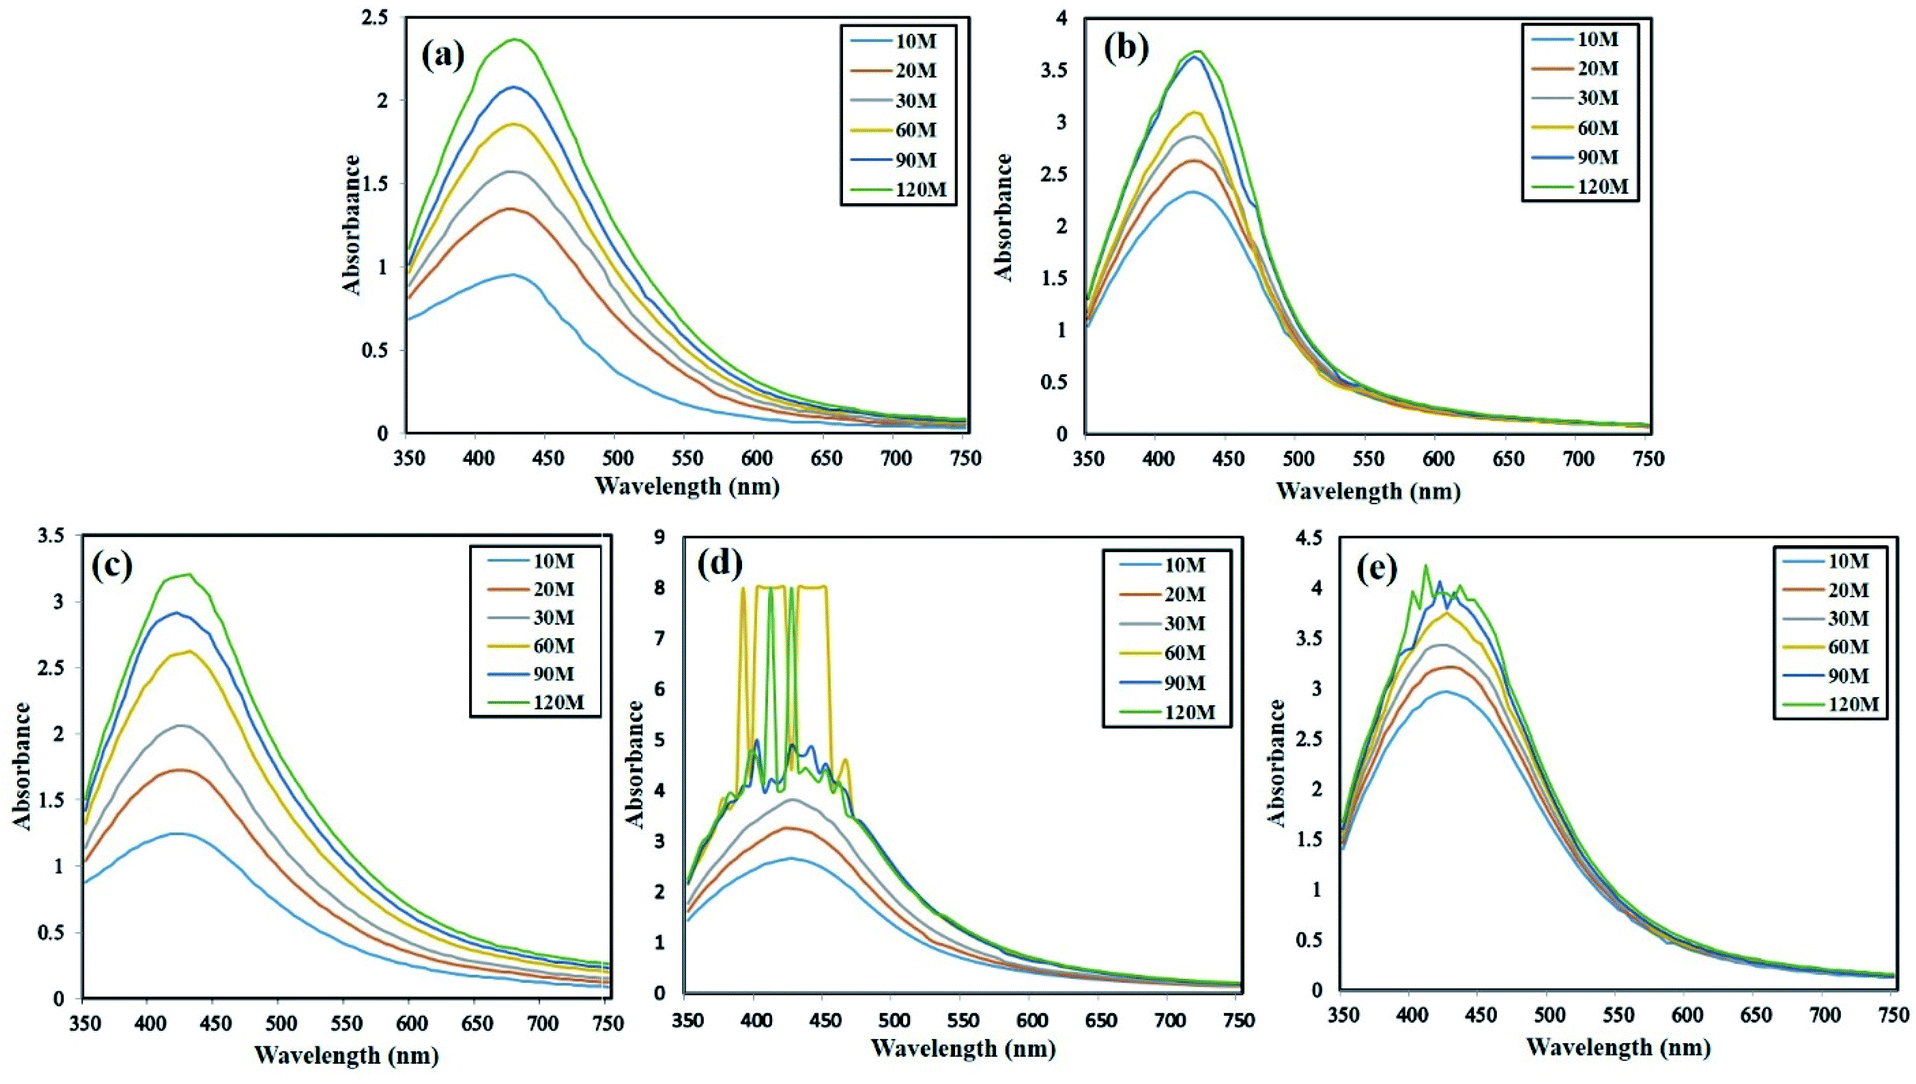 | ||
| Fig. 3 UV-Visible spectra of (a) G-DS-AgNPs, (b) W-DS-AgNPs, (c) Y-DS-AgNPs, (d) B-DS-AgNPs and (e) R-DS-AgNPs. | ||
![[double bond, length as m-dash]](https://www.rsc.org/images/entities/char_e001.gif) O– stretch (carbonyl group), –C
O– stretch (carbonyl group), –C![[triple bond, length as m-dash]](https://www.rsc.org/images/entities/char_e002.gif) C– stretch (alkynes), CN stretch (nitriles) and N–H (1°, 2° amines, amides), respectively. Previous FTIR analysis of D. sissoo extract also showed the presence of alkenes (1613.62 cm−1).31 Fig. 4b–g show the FTIR spectra of the control and LED-mediated AgNPs. The results show a sharp peak at ∼1643.16 cm−1, which reflects the capping and stabilization of AgNPs by the carbonyl group CO, as also reported by Bawazeer et al.32 A broader peak at the frequency of 3500–3200 cm−1 is also observed in all types of AgNPs, which possibly means involvement of the O–H stretch, H–bonded phenols and alcohols in the bioreduction, capping and stabilization. Similarly, Varadavenkatesan et al. reported the presence of amides (3475.15 cm−1), carboxyl (2925.23 cm−1), amino groups (2364.12 cm−1), polyphenols (1745.34 cm−1) and secondary alcohols (1625.67 cm−1) in green AgNPs synthesized from Thunbergia grandiflora flower extract.33
C– stretch (alkynes), CN stretch (nitriles) and N–H (1°, 2° amines, amides), respectively. Previous FTIR analysis of D. sissoo extract also showed the presence of alkenes (1613.62 cm−1).31 Fig. 4b–g show the FTIR spectra of the control and LED-mediated AgNPs. The results show a sharp peak at ∼1643.16 cm−1, which reflects the capping and stabilization of AgNPs by the carbonyl group CO, as also reported by Bawazeer et al.32 A broader peak at the frequency of 3500–3200 cm−1 is also observed in all types of AgNPs, which possibly means involvement of the O–H stretch, H–bonded phenols and alcohols in the bioreduction, capping and stabilization. Similarly, Varadavenkatesan et al. reported the presence of amides (3475.15 cm−1), carboxyl (2925.23 cm−1), amino groups (2364.12 cm−1), polyphenols (1745.34 cm−1) and secondary alcohols (1625.67 cm−1) in green AgNPs synthesized from Thunbergia grandiflora flower extract.33
 | ||
| Fig. 4 FTIR analysis of (a) D. sissoo leaf extract, (b) DS-AgNPs, (c) G-DS-AgNPs, (d) W-DS-AgNPs, (e) Y-DS-AgNPs, (f) B-DS-AgNPs and (g) R-DS-AgNPs. | ||
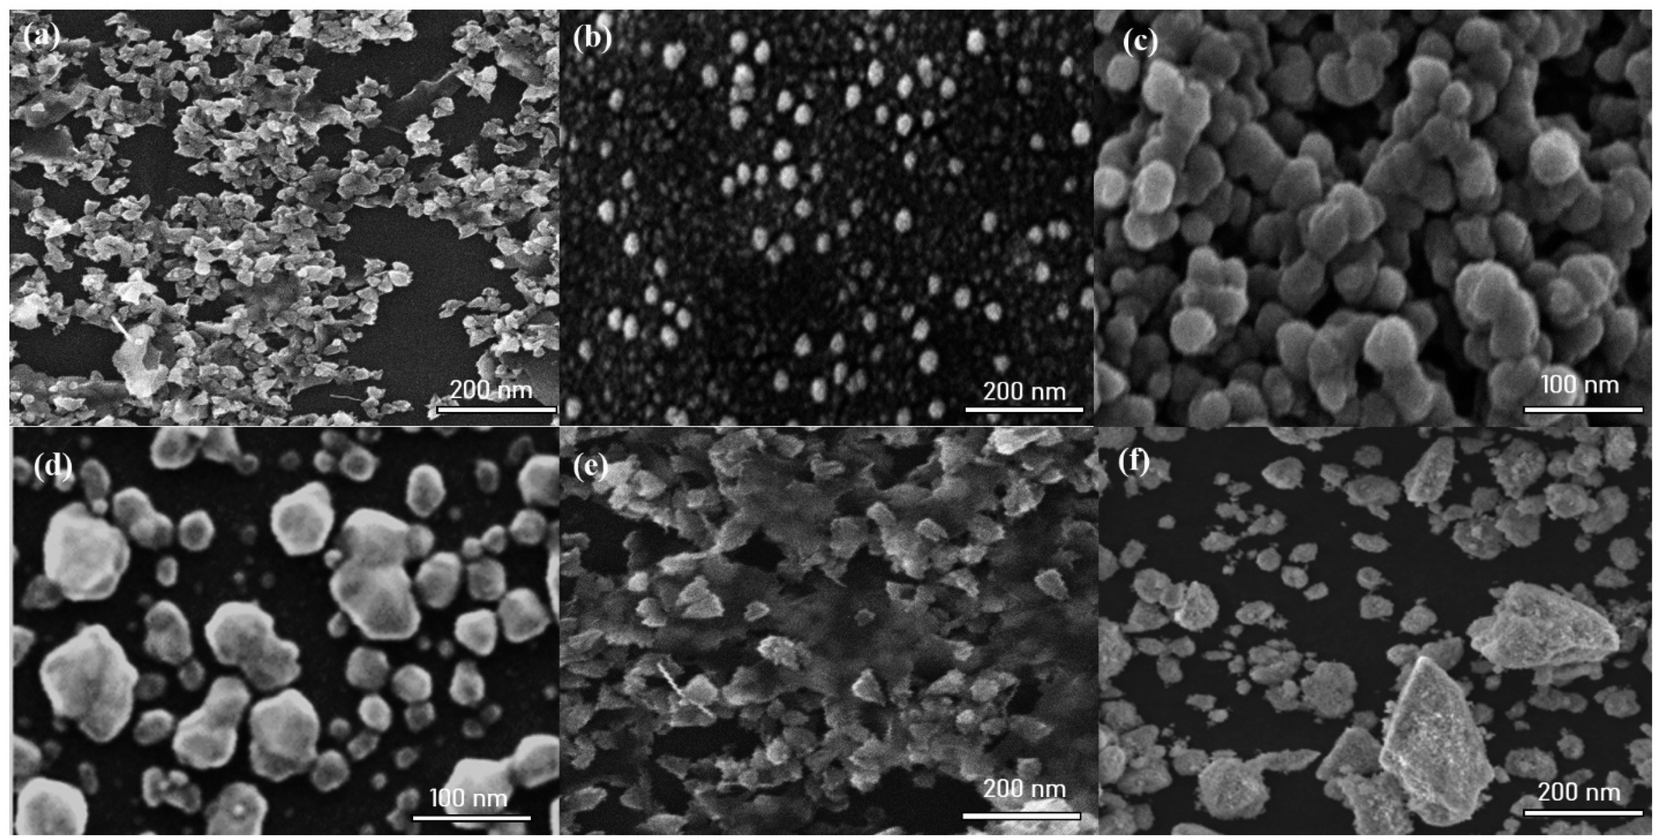 | ||
| Fig. 5 SEM images of (a) DS-AgNPs, (b) G-DS-AgNPs, (c) W-DS-AgNPs, (d) B-DS-AgNPs, (e) Y-DS-AgNPs and (f) R-DS-AgNPs. | ||
 | ||
| Fig. 6 EDX spectrum of (a) DS-AgNPs, (b) G-DS-AgNPs, (c) W-DS-AgNPs, (d) B-DS-AgNPs, (e) Y-DS-AgNPs and (f) R-DS-AgNPs. | ||
 | ||
| Fig. 7 X-ray diffractogram of (a) DS-AgNPs, (b) G-DS-AgNPs, (c) W-DS-AgNPs, (d) B-DS-AgNPs, (e) Y-DS-AgNPs and (f) R-DS-AgNPs. | ||
| Type of AgNPs | Average diameter (nm) |
|---|---|
| DS-AgNPs | 87.35 |
| G-DS-AgNPs | 45.23 |
| W-DS-AgNPs | 68.72 |
| B-DS-AgNPs | 42.78 |
| Y-DS-AgNPs | 34.63 |
| R-DS-AgNPs | 57.78 |
3.4. Antibacterial activities of LED-mediated green-synthesized AgNPs
Nano-sized AgNPs display significant antibacterial activity over a wide spectrum of bacterial species. Interestingly, AgNPs are reported as safe for use in humans, and therefore they are permitted to be used as antibacterial nanomedicines. The antibacterial activity of the LED-mediated green-synthesized AgNPs was evaluated against Bacillus subtilis, Pseudomonas aeruginosa and Pseudomonas fluorescens. These bacterial strains are reported to cause various diseases in plants, animals and humans. Bacillus subtilis was reported to cause various infections such as bacteremia, endocarditis, pneumonia, and septicemia and also spoiled preserved foods.38 Pseudomonas aeruginosa is a Gram-negative bacteria and has also been reported to cause infections in the blood, lungs (pneumonia), and other parts of the body after surgery.39 Similarly, Pseudomonas fluorescens is a rod-shaped Gram-negative bacterium species, reported to cause infections in humans (bacteremia) and animals including otitis and urinary tract infections in dogs, mastitis in dairy cows and endometritis in horses.40 To avoid these infections, AgNPs proved to be the best candidates due to their excellent antibacterial activities.41–43To evaluate the antibacterial activities of the LED-mediated AgNPs, the leaf extract of D. sissoo was used as a negative control, while SNS as a positive control. Our research showed that all the AgNPs showed considerable antibacterial activity, where a prominently higher zone of inhibition was formed against the Gram-positive B. subtilis compared to the Gram-negative Pseudomonas strains (Table 2). Fig. 8a–f show that B-DS-AgNPs and G-DS-AgNPs formed the highest zone of inhibition, i.e., 11 mm against B. subtilis, followed by Y-DS-AgNPs (8 mm), while R-DS-AgNPs and W-DS-AgNPs formed 7 mm. These zones of inhibitions are still higher than that formed against the Gram-negative bacteria, which is in accordance with the conclusion by Ju et al.44 that smaller-sized AgNPs formed an 11.4 mm zone of inhibition against the Gram-positive B. subtilis. Dutta et al.45 also reported the strong anti-bacterial activity of green AgNPs against B. subtilis.
| Bacterial strain | Sample type | Mean of zone of inhibition (mm) (15 μL per well) | |||||
|---|---|---|---|---|---|---|---|
| DS-AgNPs | G-DS-AgNPs | W-DS-AgNPs | B-DS-AgNPs | Y-DS-AgNPs | R-DS-AgNPs | ||
| Bacillus subtilis | Negative control (LE) | 5 ± 0.96 | 4.5 ± 0.23 | 4 ± 1.54 | 4.5 ± 1.22 | 5 ± 1.2 | 4 ± 0.88 |
| Positive control (SNS) | 10 ± 1.2 | 10 ± 1.91 | 9 ± 1.77 | 10 ± 2.08 | 10 ± 2.1 | 9 ± 1.86 | |
| AgNPs | 11 ± 1.5 | 11 ± 1.74 | 7 ± 1.09 | 11 ± 2.13 | 8 ± 1.14 | 7 ± 1.42 | |
| Standard test disc | 13 ± 1.7 | 14 ± 2.64 | 14 ± 2.41 | 14 ± 2.93 | 12 ± 2.82 | 14 ± 2.92 | |
| Pseudomonas aeruginosa | Negative control (LE) | 5 ± 0.7 | 5 ± 0.92 | 5 ± 0.9 | 5 ± 0.94 | 5.5 ± 1.19 | 6.5 ± 1.23 |
| Positive control (SNS) | 6 ± 1.07 | 7.5 ± 1.33 | 6.5 ± 1.1 | 8 ± 1.27 | 6.5 ± 1.4 | 7 ± 1.6 | |
| AgNPs | 5.5 ± 0.6 | 7.5 ± 1.64 | 7 ± 1.54 | 8 ± 1.25 | 8 ± 1.87 | 7 ± 1.15 | |
| Standard test disc | 10 ± 0.99 | 9.5 ± 1.79 | 8.5 ± 1.73 | 10.5 ± 1.5 | 9 ± 1.78 | 6.5 ± 1.23 | |
| P. fluorescence | Negative control (LE) | 5 ± 0.31 | 5 ± 0.38 | 5 ± 1.07 | 5 ± 0.99 | 5 ± 1.2 | 5 ± 0.99 |
| Positive control (SNS) | 6.5 ± 0.64 | 6 ± 1.28 | 6.5 ± 1.20 | 6.5 ± 1.1 | 6 ± 1.56 | 6 ± 1.23 | |
| AgNPs | 7.5 ± 1.62 | 7.5 ± 1.55 | 8 ± 1.41 | 9.5 ± 1.3 | 8.5 ± 1.66 | 8 ± 1.62 | |
| Standard test disc | 7 ± 1.33 | 7 ± 1.42 | 7.5 ± 1.09 | 6 ± 1.2 | 7.5 ± 1.88 | 7.5 ± 1.52 | |
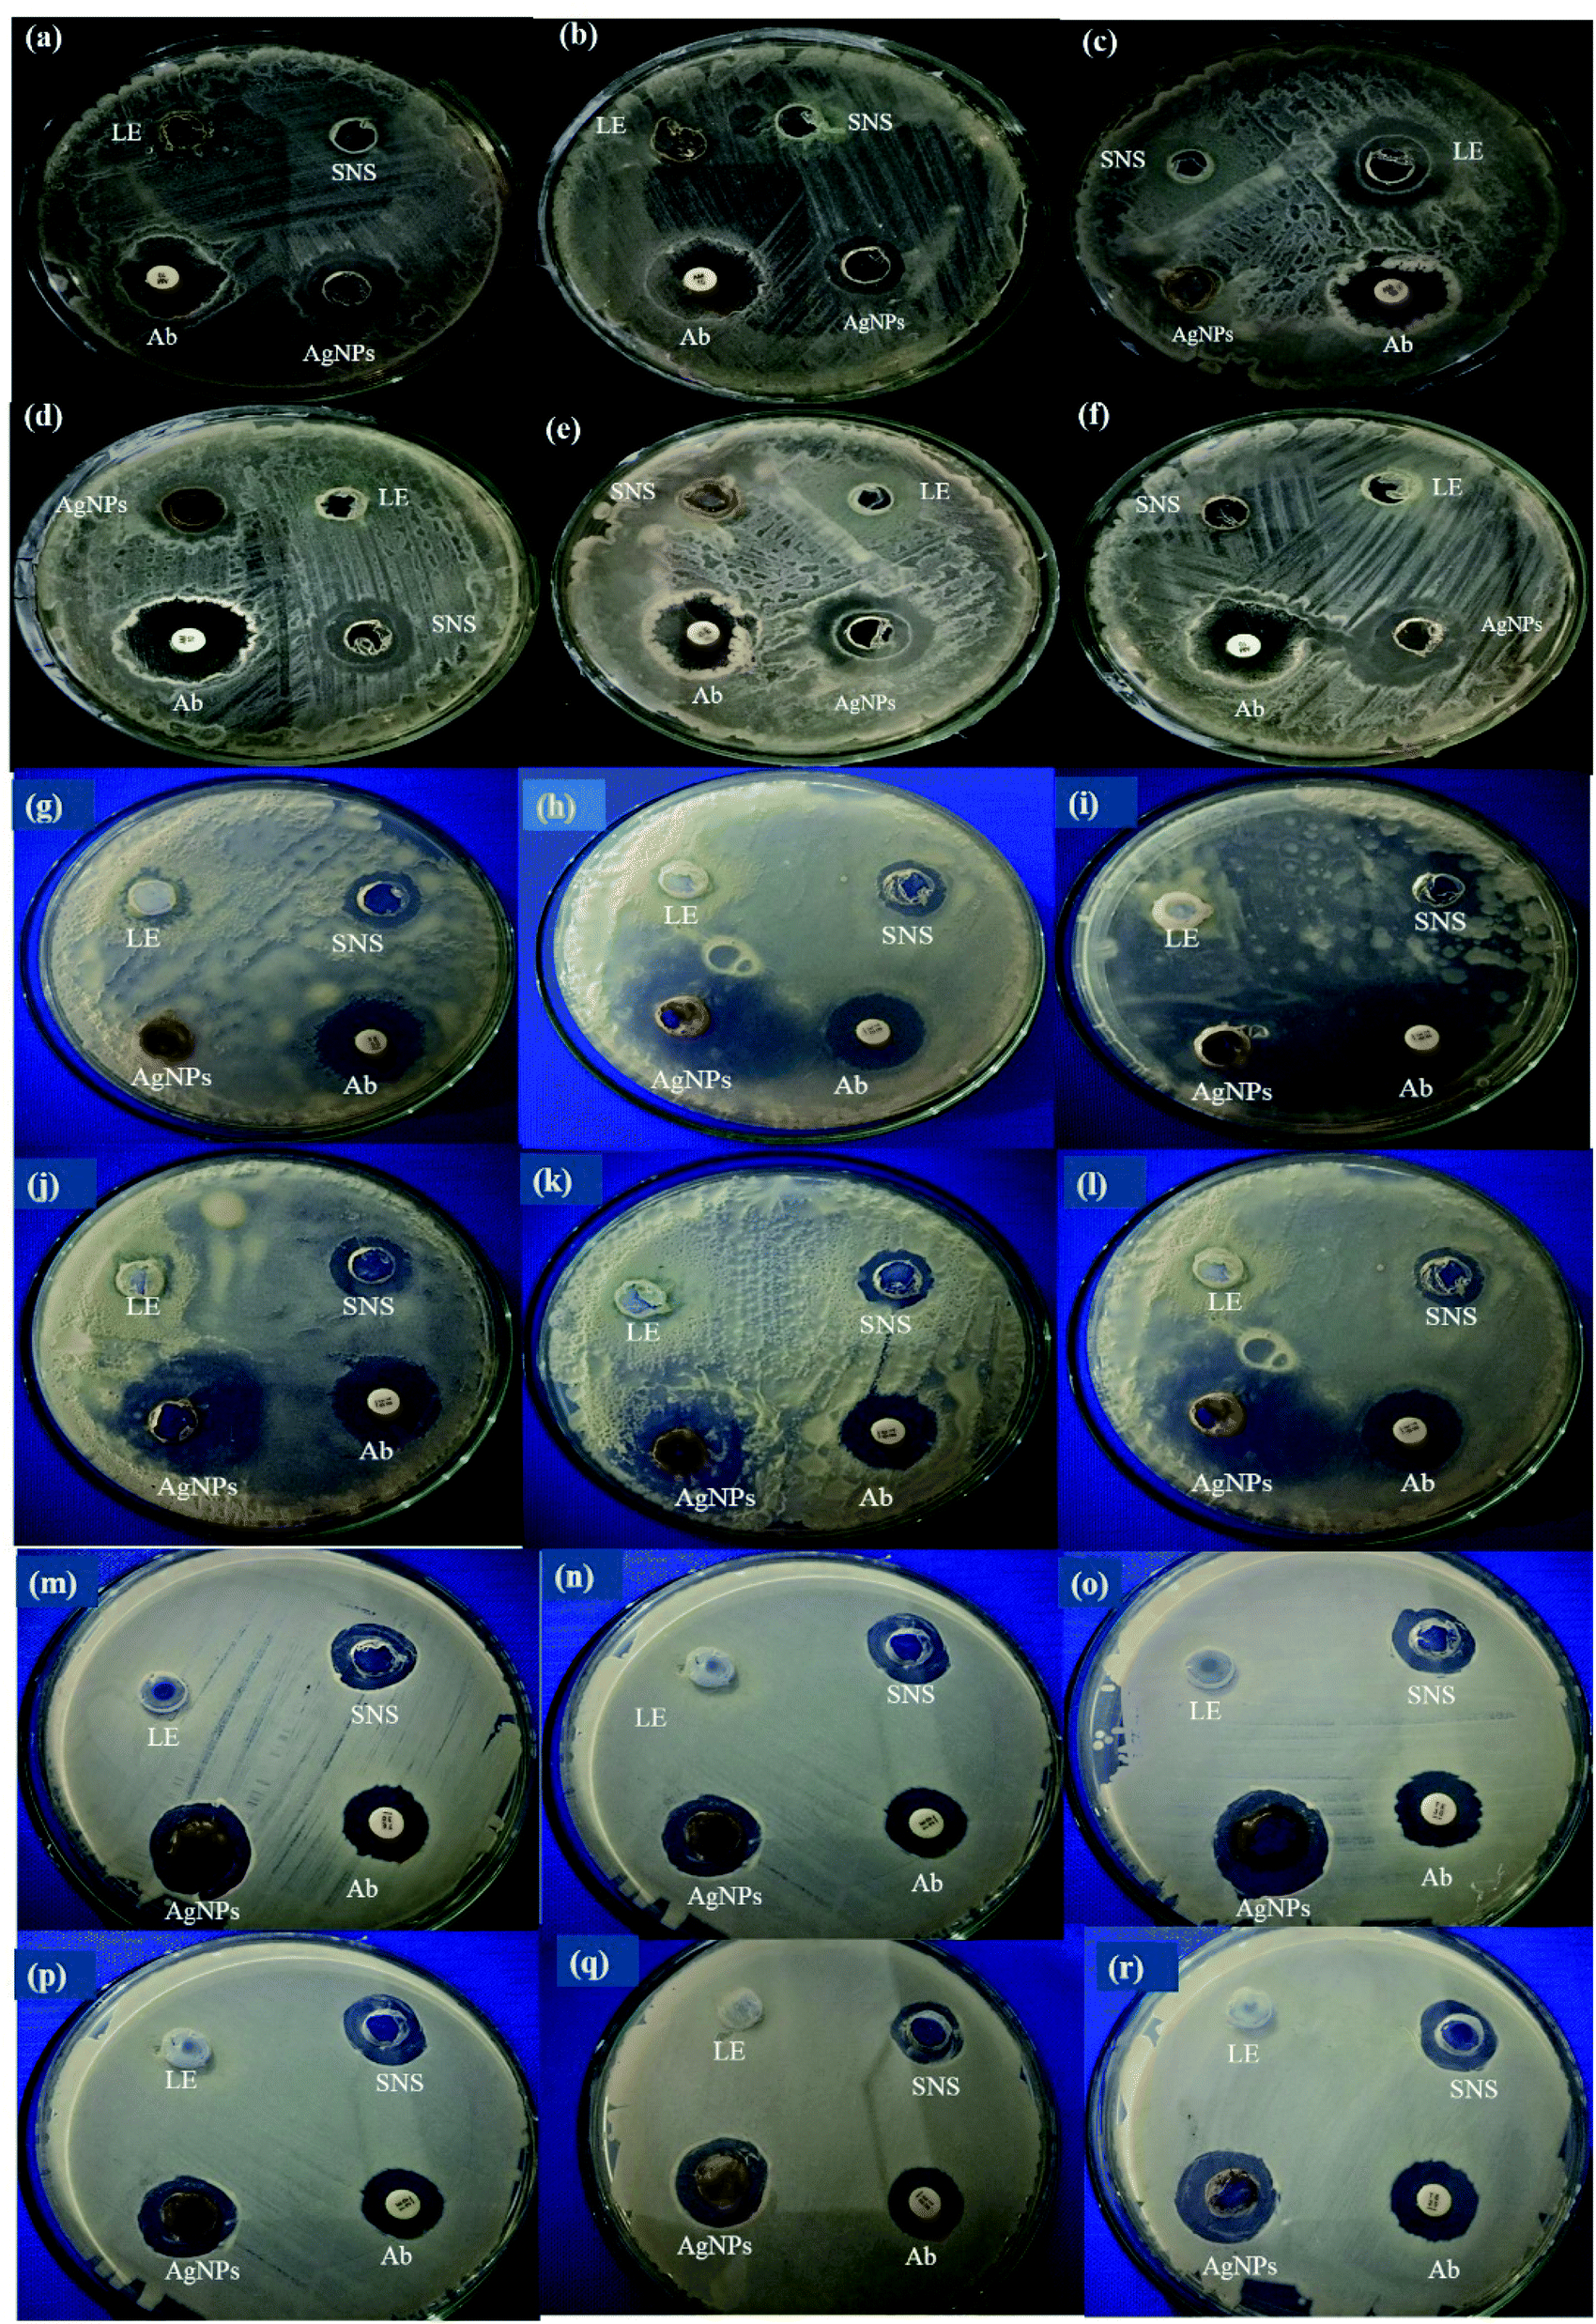 | ||
| Fig. 8 Antibacterial activity of AgNPs against B. subtilis. (a) DS-AgNPs, (b) G-DS-AgNPs, (c) W-DS-AgNPs, (d) B-DS-AgNPs, (e) Y-DS-AgNPs and (f) R-DS-AgNPs. Against P. aeruginosa (g) DS-AgNPs, (h) G-DS-AgNPs, (i) W-DS-AgNPs, (j) B-DS-AgNPs, (k) Y-DS-AgNPs and (l) R-DS-AgNPs. Against P. fluorescens (m) DS-AgNPs, (n) G-DS-AgNPs, (o) W-DS-AgNPs, (p) B-DS-AgNPs, (q) Y-DS-AgNPs and (r) R-DS-AgNPs. | ||
Fig. 8g–l show that B-DS-AgNPs and Y-DS-AgNPs formed the highest zone of inhibition (8 mm) against P. aeruginosa, which is a Gram-negative opportunistic pathogen. G-DS-AgNPs formed 7.5 mm, W-DS-AgNPs and R-DS-AgNPs formed 7 mm, while the control AgNPs formed a 5.5 mm zone of inhibition. A bioinformatic analysis found that the AgNPs mediated their antibacterial activity against P. aeruginosa by interfering with the cell membrane function and intracellular ROS generation.46 Our results show that B-DS-AgNPs and Y-DS-AgNPs are efficient in inhibiting the growth of P. aeruginosa, which can be attributed to their smaller size and morphology.
P. fluorescens is another Gram-negative bacterium, which is known to contaminate packaged food.47 In this study, we also tested the potential of the LED-mediated green-synthesized AgNPs to be used an antibacterial agent in food packaging. Fig. 8m–r show that B-DS-AgNPs formed a significant zone of inhibition of 9.5 mm, while G-DS-AgNPs formed least a 7.5 mm zone. In contrast, Y-DS-AgNPs, W-DS-AgNPs and R-DS-AgNPs formed intermediate zones of 8.5 and 8 mm. Daniel et al.48 also reported the antibacterial activity of AgNPs synthesized from Eichornia crassipes against P. fluorescens, forming a 15 mm zone of inhibition.
3.5. Antioxidant activities of LED-mediated green-synthesized AgNPs
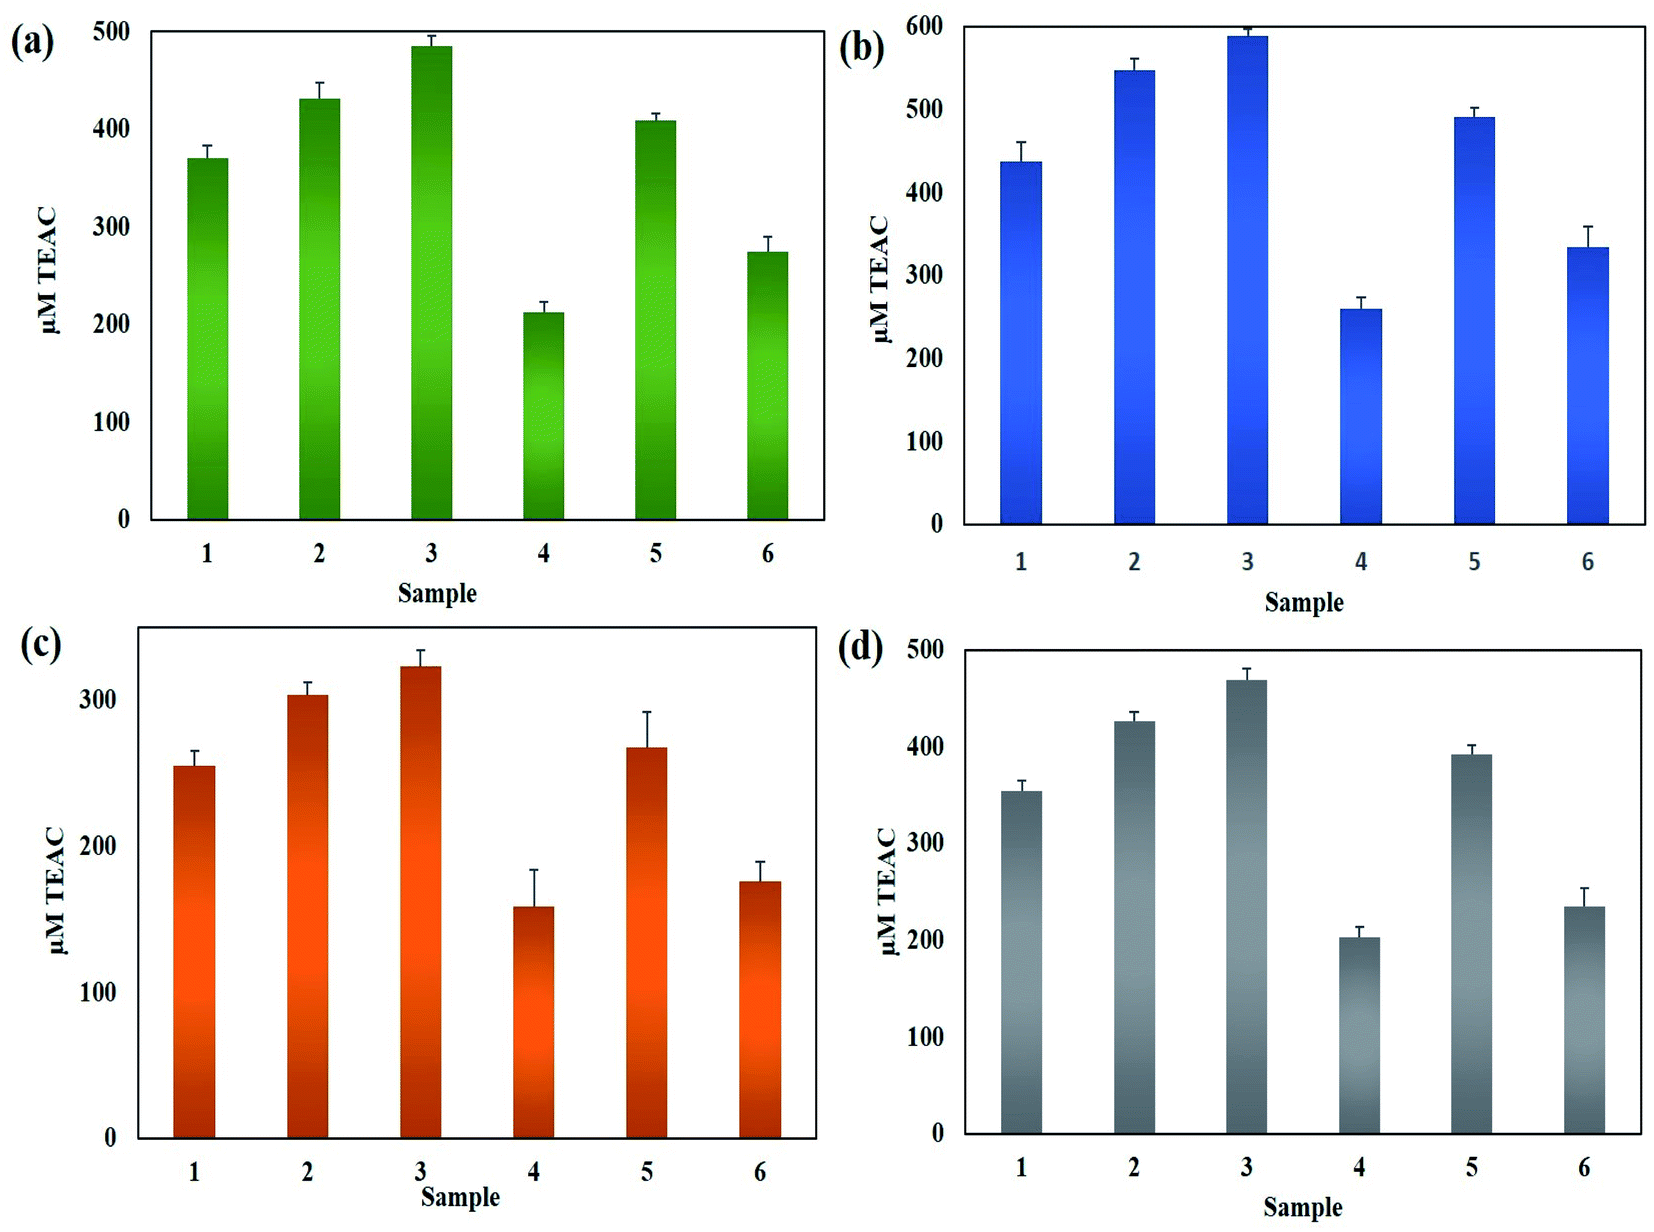 | ||
| Fig. 9 Antioxidant assays of AgNPs. (a) FRAP, (b) CUPRAC, (c) ABTS and (d) ORAC (note- 1: DS-AgNPs; 2: R-DS-AgNPs; 3: B-DS-AgNPs; 4: Y-DS-AgNPs; 5: W-DS-AgNPs; and 6: G-DS-AgNPs). | ||
3.6. Anti-glycation activities of LED-mediated green-synthesized AgNPs
Advanced glycation end-products are formed and accumulated at an accelerated rate during conditions such as diabetes mellitus, neurological diseases, cardiovascular diseases and aging processes.62–64 Studies on the potential of AgNPs as anti-glycation agents have been carried out with positive results.19 In this study, we also measured the anti-glycation activity of AgNPs in terms of % inhibition of pentosidine-like AGEs and vesperlysine-like AGEs. Interestingly, B-DS-AgNPs displayed the highest anti-glycation activity of 33.1% ± 3% and 63.3% ± 2% inhibition of pentosidine-like AGEs and vesperlysine-like AGEs, respectively. R-DS-AgNPs inhibited 30.4% ± 2.2% and 61.7% ± 1.8%, while W-DS-AgNPs inhibited 25.5% ± 3.1% and 52.8% ± 2.1% of pentosidine-like AGEs and vesperlysine-like AGEs, respectively. In contrast, G-DS-AgNPs and Y-DS-AgNPs showed the lowest level of anti-glycation activity (Fig. 10a and b), respectively. | ||
| Fig. 10 Antiglycation activities of AgNPs. (a) Inhibition of vesperlysine-like AGEs and (b) pentosidine-like AGEs (note 1: DS-AgNPs; 2: R-DS-AgNPs; 3: B-DS-AgNPs; 4: Y-DS-AgNPs; 5: W-DS-AgNPs; and 6: G-DS-AgNPs). | ||
Recently, Jan et al.65 reported the significant inhibition of vesperlysine-like AGEs (up to 31.36% ± 1.19%) and pentosidine-like AGEs (up to 34.40% ± 1.16%). Compared to ZnONPs, AgNPs showed better ability to inhibit the formation of AGEs, as reported with up to 44.63% ± 1.26% and 37.13% ± 1.99% inhibition of pentosidine- and vesperlysine-like AGEs by ZnONPs, respectively.66 Previous reports suggest that NPs interact with biomolecules differently, which is attributed to factors such as the size of NPs.67 This fact has been reinforced by our findings that the smaller-sized and non-spherical B-DS-AgNPs inhibited the formation of AGEs the most. These results shows the potential of DS-AgNPs as anti-diabetic and anti-aging agents.
3.7. Anti-cancer activities of AgNPs
 | ||
| Fig. 11 Anti-cancer activities of AgNPs against HepG2 cells (a) % cell viability, (b) ROS/RNS production and (c) mitochondrial membrane potential in response to AgNP treatment (note 1: DS-AgNPs; 2: R-DS-AgNPs; 3: B-DS-AgNPs; 4: Y-DS-AgNPs; 5: W-DS-AgNPs; and 6: G-DS-AgNPs). | ||
 | ||
| Fig. 12 (a) Caspase 3 gene expression and (b) caspase 3/7 activity of HepG2 cells when treated with AgNPs (note 1: DS-AgNPs; 2: R-DS-AgNPs; 3: B-DS-AgNPs; 4: Y-DS-AgNPs; 5: W-DS-AgNPs; and 6: G-DS-AgNPs). | ||
In the extrinsic pathway, apoptosis is initiated through the interaction of ligands and death receptors such as tumor receptors and the Fas receptor on the cell surface.83 These receptors have death domains called the Fas-associated death domain (FADD) protein, which possess various upstream inactive procaspases (caspase 8 and 10). When these caspases are activated, they activate the death signaling complex and other caspases (3, 6 and 7). Here, notably caspase 8 caused cell death by the direct or indirect method. In the direct method, caspase 3 and caspase 7 are activated, whereas in the indirect method, BH3 proteins are activated, which convert BID proteins into tBID. Here, the extrinsic cycle and indirect process are linked.84
The intrinsic pathway starts as a result of the induction of cellular and oxidative stress by stimuli such as nanoparticles. In response to these stresses and tBID from the extrinsic pathway, the mitochondrial membrane ruptures, which initiates the caspases cascade. Mitochondria play an important role in the intrinsic pathway given that mitochondrial pore opening leads to the depolarization of the mitochondrial membrane. The rupture of mitochondria leads to cytochrome c discharge in the cytosol, which activates APAF1 and permeabilizes the mitochondrial outer membrane. This leads to the discharge of Bcl2 and soluble proteins to form apoptosomes.85 The formation of apoptosomes marks the activation of caspase-9, followed by the activation of effector caspase-3. Consequently, DNA fragmentation, cell blebbing and apoptosis occurs in cells.86 The proposed mechanism is summarized in Fig. 13.
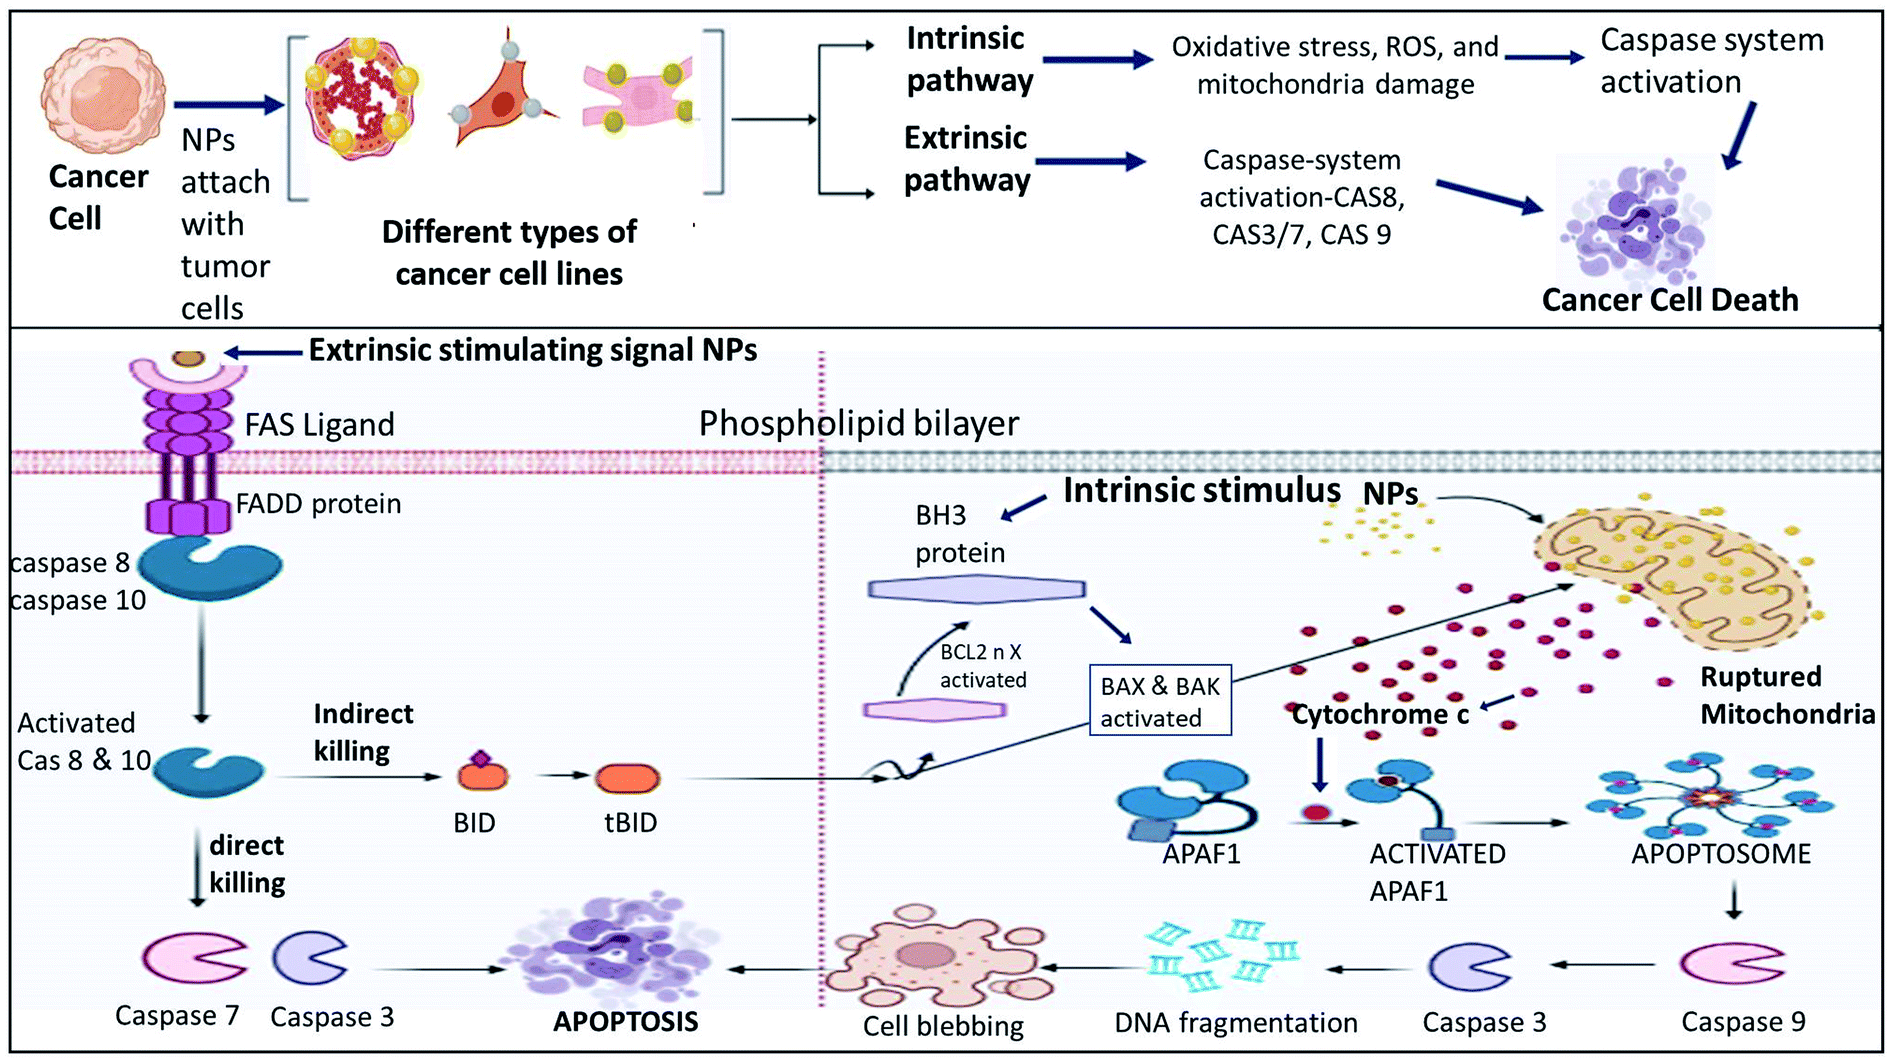 | ||
| Fig. 13 Proposed mechanism of anti-cancer activity of AgNPs. | ||
3.8. Biocompatibility of AgNPs
 | ||
| Fig. 14 Biocompatibility studies of green-synthesized AgNPs. (a) Toxicity of AgNPs against brine shrimp. (b) Biocompatibility of AgNPs with human red blood cells (hRBCs). (Note 1: DS-AgNPs; 2: R-DS-AgNPs; 3: B-DS-AgNPs; 4: Y-DS-AgNPs; 5: W-DS-AgNPs; and 6: G-DS-AgNPs). | ||
4. Conclusions
AgNPs are one of the most commonly synthesized, investigated, and utilized representatives of nanomaterials due to their excellent optical, catalytical, and biological properties. AgNPs are well-known for their broad-spectrum and highly efficient antimicrobial and anticancer activities. Other biological activities of AgNPs have been also explored, including promoting bone healing and wound repair, enhancing the immunogenicity of vaccines, anti-diabetic and anti-aging effects. Due to the numerous biological and clinical applications of AgNPs, in this study, they were bio-synthesized from D. sissoo leaf extract under LED exposure. The phytochemical analysis of D. sissoo showed that the plant extract was rich in flavonoid and phenolic content, and thereby resulted in increased free radical scavenging activity. The FTIR analysis revealed that biologically active plant ingredients including alcohols and phenolic compounds acted as bio-reductants and stabilizers of AgNPs. Further characterization by SEM-EDX showed that the LEDs promoted the synthesis of uniquely shaped AgNPs together with increased elemental percentage of Ag in AgNPs compared to the control AgNPs. A decrease in size and well defined shape were observed in the case of the yellow and blue LED-mediated green synthesis of AgNPs. Given that the morphology of NPs determine their applications and influence their efficacy, in our study, B-DS-AgNPs showed unusually high anti-oxidant activities, as reflected by the inhibition of AGE formation and best anti-bacterial activity by B-DS-AgNPs. Alternatively, the smaller-sized Y-DS-AgNPs showed exceptionally good anticancer activities, where HepG2 cells showed the least viability due to the highest intracellular ROS/RNS production and distribution of MMP by Y-DS-AgNPs. Furthermore, all the AgNPs showed mild hemolysis towards hRBCs and moderate toxicity against brine shrimp, which could be further improved by using a lower concentration of AgNPs. Our research showed the promising role of LEDs in modifying the physico-chemical characteristics of AgNPs during the synthesis, which was consequently reflected in their effective biological activities. Studying and optimizing other factors such as incubation time, concentration of plant extract, temperature, and pH can further improve the quality and yield of AgNPs. Also, concentration-dependent biological studies should be carried out to further enhance their efficacy. When the synthesis of AgNPs is optimized and up-scaled to an industrial level, these biocompatible AgNPs can be used for therapeutic applications.Conflicts of interest
The authors declare that they have no conflict of interest.References
- A. K. Khan, S. Renouard, S. Drouet, J.-P. Blondeau, I. Anjum, C. Hano, B. H. Abbasi and S. Anjum, Pharmaceutics, 2021, 13, 1977 CrossRef CAS PubMed.
- C. Singh, R. Baboota and P. Naik, Adv. Mater. Lett., 2012, 3, 279–285 CrossRef CAS.
- K. G. Stamplecoskie and J. C. Scaiano, J. Am. Chem. Soc., 2010, 132, 1825–1827 CrossRef CAS PubMed.
- J.-H. Lee, P. Velmurugan, J.-H. Park, K. Murugan, N. Lovanh, Y.-J. Park, B.-T. Oh, P. Venkatachalam and G. Benelli, Physiol. Mol. Plant Pathol., 2018, 101, 178–186 CrossRef CAS.
- B. Kumar, Y. Angulo, K. Smita, L. Cumbal and A. Debut, Particuology, 2016, 24, 123–128 CrossRef CAS.
- P. Thuesombat, S. Hannongbua, S. Akasit and S. Chadchawan, Ecotoxicol. Environ. Saf., 2014, 104, 302–309 CrossRef CAS.
- I. X. Yin, J. Zhang, I. S. Zhao, M. L. Mei, Q. Li and C. H. Chu, Int. J. Nanomed., 2020, 15, 2555 CrossRef CAS.
- M. Wypij, T. Jędrzejewski, J. Trzcińska-Wencel, M. Ostrowski, M. Rai and P. Golińska, Front. Microb., 2021, 12, 632505–632522 CrossRef PubMed.
- J. M. Ashraf, M. A. Ansari, H. M. Khan, M. A. Alzohairy and I. Choi, Sci. Rep., 2016, 6, 20414 CrossRef CAS PubMed.
- R. L. Prior, X. Wu and K. Schaich, J. Agric. Food Chem., 2005, 53, 4290–4302 CrossRef CAS PubMed.
- S. Anjum, B. H. Abbasi and C. Hano, Plant Cell, Tissue Organ Cult., 2017, 129, 73–87 CrossRef CAS.
- S. Anjum and B. H. Abbasi, Int. J. Nanomed., 2016, 11, 715 CrossRef CAS.
- D. Tungmunnithum, S. Renouard, S. Drouet, J.-P. Blondeau and C. Hano, Plants, 2020, 9, 921 CrossRef CAS PubMed.
- S. Fakhari, M. Jamzad and H. Kabiri Fard, Green Chem. Lett. Rev., 2019, 12, 19–24 CrossRef CAS.
- B. H. Abbasi, S. Anjum and C. Hano, RSC Adv., 2017, 7, 15931–15943 RSC.
- B. H. Abbasi, A. Siddiquah, D. Tungmunnithum, S. Bose, M. Younas, L. Garros, S. Drouet, N. Giglioli-Guivarc’h and C. Hano, Int. J. Mol. Sci., 2019, 20, 452 CrossRef.
- Ş. Karaman, E. Tütem, K. Sözgen Başkan and R. Apak, Food Chem., 2010, 120, 1201–1209 CrossRef.
- K. Thaipong, U. Boonprakob, K. Crosby, L. Cisneros-Zevallos and D. H. Byrne, J. Food Compos. Anal., 2006, 19, 669–675 CrossRef CAS.
- M. Shah, S. Nawaz, H. Jan, N. Uddin, A. Ali, S. Anjum, N. Giglioli-Guivarc'h, C. Hano and B. H. Abbasi, Mater. Sci. Eng., C, 2020, 112, 110889 CrossRef CAS.
- M. Nazir, D. Tungmunnithum, S. Bose, S. Drouet, L. Garros, N. Giglioli-Guivarc’h, B. H. Abbasi and C. Hano, J. Agric. Food Chem., 2019, 67, 1847–1859 CrossRef CAS.
- M. Ahmed, H. Fatima, M. Qasim and B. Gul, BMC Complementary Altern. Med., 2017, 17, 1–16 CrossRef.
- A. T. Khalil, M. Ovais, I. Ullah, M. Ali, Z. K. Shinwari, S. Khamlich and M. Maaza, Nanomedicine, 2017, 12, 1767–1789 CrossRef CAS.
- R. Kamboj, M. B. Bera and V. Nanda, Int. J. Food Sci. Technol., 2013, 48, 578–587 CrossRef CAS.
- S. Yasmeen and P. Gupta, J. Herb. Med., 2021, 29, 100456 CrossRef.
- G. Marslin, K. Siram, Q. Maqbool, R. K. Selvakesavan, D. Kruszka, P. Kachlicki and G. Franklin, Materials, 2018, 11, 940 CrossRef PubMed.
- E. Vadivel, R. D. Tendulkar and V. V. Harmalkar, Int. J. Curr. Pharm. Res., 2015, 7, 70–72 CAS.
- J. Jalab, W. Abdelwahed, A. Kitaz and R. Al-Kayali, Heliyon, 2021, 7, e08033 CrossRef PubMed.
- T. D. Nguyen, D. P. Nguyen, Y. H. Hoang, T. T. Nguyen and H. T. Nguyen, Chem. Pap., 2021, 75, 5623–5631 CrossRef CAS.
- K. Anandalakshmi, J. Venugobal and V. Ramasamy, Appl. Nanosci., 2016, 6, 399–408 CrossRef CAS.
- O. Maitera and I. Chukkol, World J. Adv. Res. Rev., 2016, 3, 25–29 Search PubMed.
- I. Ali, G. Rizwani, H. Shareef and S. Khan, Int. J. Pharm. Pharm. Sci., 2016, 8, 48–53 CrossRef CAS.
- S. Bawazeer, A. Rauf, S. U. A. Shah, A. M. Shawky, Y. S. Al-Awthan, O. S. Bahattab, G. Uddin, J. Sabir and M. A. El-Esawi, Green Process. Synth., 2021, 10, 85–94 CrossRef CAS.
- T. Varadavenkatesan, R. Selvaraj and R. Vinayagam, Mater. Today: Proc., 2019, 23, 39–42 Search PubMed.
- P. Jegadeeswaran, R. Shivaraj and R. Venckatesh, Digest Journal of Nanomaterials and Biostructures, 2012, 7, 991–998 Search PubMed.
- J. Saha, A. Begum, A. Mukherjee and S. Kumar, Sustainable Environ. Res., 2017, 27, 245–250 CrossRef CAS.
- A. Rautela, J. Rani and M. Debnath, J. Anal. Sci. Technol., 2019, 10, 5–15 CrossRef.
- A. M. Soliman, W. Abdel-Latif, I. H. Shehata, A. Fouda, A. M. Abdo and Y. M. Ahmed, Biol. Trace Elem. Res., 2021, 199, 800–811 CrossRef.
- A. C. Reboli and W. E. Farrar, in Laboratory Diagnosis of Infectious Diseases, Springer, 1988, pp. 69–82 Search PubMed.
- F. Arancibia, T. T. Bauer, S. Ewig, J. Mensa, J. Gonzalez, M. S. Niederman and A. Torres, Arch. Intern. Med., 2002, 162, 1849–1858 CrossRef.
- T. Nishimura, K. Hattori, A. Inoue, T. Ishii, T. Yumoto, K. Tsukahara, A. Nakao, S. Ishihara and S. Nakayama, World J. Emerg. Med., 2017, 8, 151 CrossRef PubMed.
- R. Balachandar, R. Navaneethan, M. Biruntha, K. K. A. Kumar, M. Govarthanan and N. Karmegam, Mater. Lett., 2022, 311, 131572 CrossRef CAS.
- A. K. Keshari, R. Srivastava, P. Singh, V. B. Yadav and G. Nath, J. Ayurveda Integr. Med., 2020, 11, 37–44 CrossRef PubMed.
- G.-A. Martínez-Castañon, N. Nino-Martinez, F. Martinez-Gutierrez, J. Martinez-Mendoza and F. Ruiz, J. Nanopart. Res., 2008, 10, 1343–1348 CrossRef.
- J. Li, K. Rong, H. Zhao, F. Li, Z. Lu and R. Chen, J. Nanosci. Nanotechnol., 2013, 13, 6806–6813 CrossRef PubMed.
- T. Dutta, S. K. Chowdhury, N. N. Ghosh, A. P. Chattopadhyay, M. Das and V. Mandal, J. Mol. Struct., 2022, 1247, 131361 CrossRef CAS.
- X. Yan, B. He, L. Liu, G. Qu, J. Shi, L. Hu and G. Jiang, Metallomics, 2018, 10, 557–564 CrossRef CAS PubMed.
- H. Kumar, L. Franzetti, A. Kaushal and D. Kumar, Ann. Microbiol., 2019, 69, 873–883 CrossRef CAS.
- S. CG Kiruba Daniel, K. Nehru and M. Sivakumar, Curr. Nanosci., 2012, 8, 125–129 CrossRef.
- A. Danet, in Antioxidants - Benefits, Sources, Mechanisms of Action, ed. V. Waisundara, IntechOpen, 2021, DOI:10.5772/intechopen.96654.
- E. Mfotie Njoya, in Cancer, ed. V. R. Preedy and V. B. Patel, Academic Press, San Diego, 2nd edn, 2021, pp. 349–357, DOI:10.1016/B978-0-12-819547-5.00031-6.
- Y. Zhong and F. Shahidi, in Handbook of Antioxidants for Food Preservation, ed. F. Shahidi, Woodhead Publishing, 2015, pp. 287–333, DOI:10.1016/B978-1-78242-089-7.00012-9.
- A. Balciunaitiene, P. Viskelis, J. Viskelis, P. Streimikyte, M. Liaudanskas, E. Bartkiene, P. Zavistanaviciute, E. Zokaityte, V. Starkute and M. Ruzauskas, Processes, 2021, 9, 1304 CrossRef CAS.
- M. Özyürek, K. Güçlü, E. Tütem, K. Sözgen Başkan, E. Erçağ, S. Karademir Çelik, S. Baki, L. Yıldız, Ş. Karaman and R. Apak, Anal. Methods, 2011, 3, 2439–2453 RSC.
- N. Muniyappan and N. S. Nagarajan, Process Biochem., 2014, 49, 1054–1061 CrossRef CAS.
- Z. Bedlovičová, I. Strapáč, M. Baláž and A. Salayová, Molecules, 2020, 25, 3191 CrossRef PubMed.
- P. Moteriya, H. Padalia and S. Chanda, J. Genet. Eng. Biotechnol., 2017, 15, 505–513 CrossRef PubMed.
- X. Baskaran, A. V. G. Vigila, T. Parimelazhagan, D. Muralidhara-Rao and S. Zhang, Int. J. Nanomed., 2016, 11, 5789 CrossRef CAS PubMed.
- F. Pilaquinga, J. Morey, L. Fernandez, P. Espinoza-Montero, M. Moncada-Basualto, J. Pozo-Martinez, C. Olea-Azar, R. Bosch, L. Meneses and A. Debut, Int. J. Nanomed., 2021, 16, 5879 CrossRef PubMed.
- R. Jaffe and J. Mani, in Polyphenols: Mechanisms of Action in Human Health and Disease, ed. R. R. Watson, V. R. Preedy and S. Zibadi, Academic Press, 2nd edn, 2018, pp. 403–413, DOI:10.1016/B978-0-12-813006-3.00029-5.
- P. Bélteky, A. Rónavári, D. Zakupszky, E. Boka, N. Igaz, B. Szerencsés, I. Pfeiffer, C. Vágvölgyi, M. Kiricsi and Z. Kónya, Int. J. Nanomed., 2021, 16, 3021 CrossRef PubMed.
- H. Kumar, K. Bhardwaj, E. Nepovimova, K. Kuča, D. Singh Dhanjal, S. Bhardwaj, S. K. Bhatia, R. Verma and D. Kumar, Nanomaterials, 2020, 10, 1334 CrossRef CAS PubMed.
- K. Jandeleit-Dahm and M. E. Cooper, Curr. Pharm. Des., 2008, 14, 979–986 CrossRef CAS PubMed.
- L.-F. Lue, D. G. Walker, S. Jacobson and M. Sabbagh, Future Neurol., 2009, 4, 167–177 CrossRef CAS PubMed.
- S. Morales, J. A. García-Salcedo and M. Muñoz-Torres, Med. Clin., 2010, 136, 298–302 CrossRef PubMed.
- H. Jan, G. Zaman, H. Usman, R. Ansir, S. Drouet, N. Gigliolo-Guivarc'h, C. Hano and B. H. Abbasi, J. Mater. Res. Technol., 2021, 15, 950–968 CrossRef CAS.
- H. Jan, M. Shah, A. Andleeb, S. Faisal, A. Khattak, M. Rizwan, S. Drouet, C. Hano and B. H. Abbasi, Oxid. Med. Cell. Longevity, 2021, 2021, 4786227 Search PubMed.
- S. Anandan, M. Mahadevamurthy, M. A. Ansari, M. A. Alzohairy, M. N. Alomary, S. Farha Siraj, S. Halugudde Nagaraja, M. Chikkamadaiah, L. Thimappa Ramachandrappa and H. K. Naguvanahalli Krishnappa, Biomolecules, 2019, 9, 882 CrossRef PubMed.
- A. R. Gliga, S. Skoglund, I. O. Wallinder, B. Fadeel and H. L. Karlsson, Part. Fibre Toxicol., 2014, 11, 1–17 CrossRef PubMed.
- L. C. Stoehr, E. Gonzalez, A. Stampfl, E. Casals, A. Duschl, V. Puntes and G. J. Oostingh, Part. Fibre Toxicol., 2011, 8, 1–15 CrossRef PubMed.
- S. Pal, Y. K. Tak and J. M. Song, Appl. Environ. Microbiol., 2007, 73, 1712–1720 CrossRef CAS PubMed.
- A. Kocyigit, E. M. Guler and M. Dikilitas, Reactive Oxygen Species in Living Cells, InterchOpen, London, 2018, pp. 21–45 Search PubMed.
- G. P. Chuy, P. C. L. Muraro, A. R. Viana, G. Pavoski, D. C. R. Espinosa, B. S. Vizzotto and W. L. da Silva, J. Inorg. Organomet. Polym. Mater., 2021, 32(4), 1213–1222 CrossRef PubMed.
- E. Huerta-García, I. Zepeda-Quiroz, H. Sánchez-Barrera, Z. Colín-Val, E. Alfaro-Moreno, M. D. P. Ramos-Godinez and R. López-Marure, Molecules, 2018, 23, 1955 CrossRef PubMed.
- J. Li, B. Zhang, X. Chang, J. Gan, W. Li, S. Niu, L. Kong, T. Wu, T. Zhang, M. Tang and Y. Xue, Environ. Pollut., 2020, 256, 113430 CrossRef CAS PubMed.
- Y.-G. Yuan, Q.-L. Peng and S. Gurunathan, Int. J. Nanomed., 2017, 12, 6487 CrossRef CAS PubMed.
- Y.-G. Yuan, S. Zhang, J.-Y. Hwang and I.-K. Kong, Oxid. Med. Cell. Longevity, 2018, 2018, 21 CrossRef PubMed.
- M. D'Amelio, V. Cavallucci and F. Cecconi, Cell Death Differ., 2010, 17, 1104–1114 CrossRef PubMed.
- S. Anjum, A. K. Khan, A. Qamar, N. Fatima, S. Drouet, S. Renouard, J. P. Blondeau, B. H. Abbasi and C. Hano, Int. J. Mol. Sci., 2021, 22, 11294 CrossRef CAS PubMed.
- I. Ullah, A. T. Khalil, M. Ali, J. Iqbal, W. Ali, S. Alarifi and Z. K. Shinwari, Oxid. Med. Cell. Longevity, 2020, 2020, 14 Search PubMed.
- A. A. Al-Khedhairy and R. Wahab, Metals, 2022, 12, 148 CrossRef CAS.
- P. V. Rao, D. Nallappan, K. Madhavi, S. Rahman, L. Jun Wei and S. H. Gan, Oxid. Med. Cell. Longevity, 2016, 2016, 3685671 Search PubMed.
- S. B. Bratton, G. Walker, S. M. Srinivasula, X. M. Sun, M. Butterworth, E. S. Alnemri and G. M. Cohen, EMBO J., 2001, 20, 998–1009 CrossRef CAS PubMed.
- A. Sarkar, J. Das, P. Manna and P. C. Sil, Toxicology, 2011, 290, 208–217 CrossRef PubMed.
- B. Kang, L. A. Austin and M. A. El-Sayed, ACS Nano, 2014, 8, 4883–4892 CrossRef CAS PubMed.
- S. W. Tait and D. R. Green, Nat. Rev. Mol. Cell Biol., 2010, 11, 621–632 CrossRef CAS PubMed.
- S. Yuan, X. Yu, M. Topf, S. J. Ludtke, X. Wang and C. W. Akey, Structure, 2010, 18, 571–583 CrossRef CAS PubMed.
- H. E. A. Mohamed, S. Afridi, A. T. Khalil, D. Zia, Z. K. Shinwari, M. S. Dhlamini and M. Maaza, J. Inorg. Organomet. Polym. Mater., 2020, 30, 3241–3254 CrossRef CAS.
- R. Singh and Navneet, Curr. Res. Green Sustainable Chem., 2021, 4, 100152 CrossRef CAS.
- R. Asadi Dokht Lish, S. A. Johari, M. Sarkheil and I. J. Yu, Environ. Pollut., 2019, 255, 113358 CrossRef CAS PubMed.
- N. H. Kumar, M. Murali, A. Satish, S. B. Singh, H. Gowtham, H. Mahesh, T. Lakshmeesha, K. Amruthesh and S. Jagannath, J. Cluster Sci., 2020, 31, 523–534 CrossRef.
- M. Zare, K. Namratha, M. Thakur and K. Byrappa, Mater. Res. Bull., 2019, 109, 49–59 CrossRef CAS.
- T. Z. Mehrizi, Nano, 2021, 16, 2130007 CrossRef CAS.
- S. Kumar, I. Jha, N. K. Mogha and P. Venkatesu, Appl. Surf. Sci., 2020, 512, 145573 CrossRef CAS.
| This journal is © The Royal Society of Chemistry 2022 |