 Open Access Article
Polydiacetylene-based colorimetric and fluorometric sensors for lead ion recognition†
Shu-Wei Chen *,
Xipeng Chen,
Yang Li,
Yalin Yang,
Yuchuan Dong,
Jinwen Guo and
Jinyi Wang
 *
*
College of Chemistry & Pharmacy, Northwest A&F University, Yangling, Shaanxi 712100, P. R. China. E-mail: chenshuwei2011@nwsuaf.edu.cn; jywang@nwsuaf.edu.cn
First published on 10th August 2022
Abstract
Development of novel sensors for the detection of lead ions (Pb2+) has attracted increasing interest due to their inherent toxic effects on human health and the environment. In this study, we describe two new polydiacetylene (PDA)-based liposome sensors for the colorimetric and fluorometric recognition of Pb2+ in aqueous solution. In the sensor system, a thymine-1-acetic acid (TAA) or orotic acid (OA) group was reasonably introduced into the diacetylene monomer to work as a strong binding site for Pb2+. The TAA- or OA-functionalized monomer and 10,12-pentacosadiynoic acid (PCDA) were incorporated into PDA liposomes in aqueous solution. After UV light-induced polymerization, deep blue colored liposome solutions were obtained. Upon the addition of a series of transition metal cations into the liposome solutions, only Pb2+ could induce a color change from blue to red observable by the naked eye and a large fluorescence enhancement. The results clearly showed that the PDA–EDEA–TAA and PDA–EDEA–OA liposomes could act as highly selective and sensitive probes to detect Pb2+ in aqueous solution. The detection limits of PDA–EDEA–TAA and PDA–EDEA–OA systems are 38 nM and 25 nM, respectively. The excellent selectivity of PDA liposomes could be attributed to the stronger complexation behavior of Pb2+ with TAA (or OA) and the carboxylic acid at the lipid–solution interface which could perturb the PDA conjugated backbone. In addition, the proposed sensors were successfully applied to detect trace amounts of Pb2+ in real water samples with excellent recovery, indicating that the developed method had a good accuracy and precision for the analysis of trace Pb2+ in practical samples.
1 Introduction
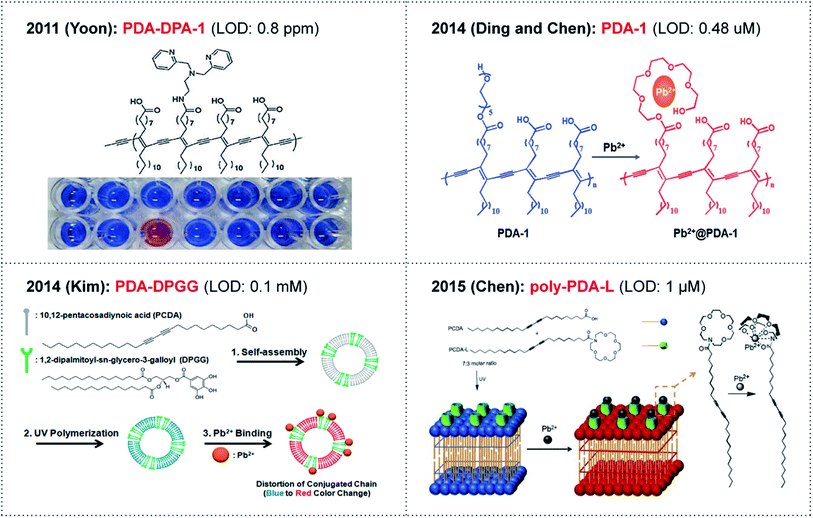
Environmental pollutants such as heavy metals have had a dramatic impact on ecosystems over the past few centuries. Among the various heavy metal ions, lead ions (Pb2+) in particular remain one of the most important targets, and have inherent toxic effects on human health and the environment.1 It is reported that even a very small amount of Pb2+ exposure can cause memory loss, muscle paralysis, anemia and intellectual disability.2,3 However, lead can be easily encountered in the environment due to its use in gasoline, batteries, pigments, etc. In 2011, the World Health Organization established guidelines for drinking water quality with a provisional guideline value of 10 μg L−1.4 At present, the most typical detection methods of trace Pb2+ are mainly focused on the atomic absorption spectroscopy, inductively coupled plasma mass spectrometry and electrochemical techniques.5–7 These traditional methods can be used to analyze the total content of Pb2+ with high sensitivity. However, the requirements of expensive cumbersome instruments, extensive pretreatment of samples and skilled professionals limit their application for rapid detection and in situ analysis.8 To overcome the above limitations, quite a number of fluorescent chemosensors based on DNAzyme,9–13 proteins,14 polymers,15 nanoparticles,16–19 peptides20 and small molecules21–25 have been developed for Pb2+ detection over the last few decades. Although some of the sensors such as DNAzyme-, protein-, and peptide-based sensors displayed high sensitivity and selectivity in aqueous solutions, their complicated process and relative instability always prevent their practical applications.24 Therefore, the development of sensitive and convenient methods for Pb2+ detection in aqueous solution is still a challenge and of great interest.Polydiacetylenes (PDAs), a representative class of conjugated polymers, have been extensively investigated and utilized as intriguing materials for sensing applications due to their sensitive colorimetric/fluorescent dual detection capabilities.25,26 Diacetylene monomers can easily self-assemble in an aqueous medium to form liposomal structures that can be photopolymerized to generate PDA with a blue color (absorption λmax at 640 nm).27 Upon exposure to external stimuli, the absorption λmax of PDA shifts from 640 nm (blue phase) to 540 nm (red phase). Interestingly, the triggered red phase of PDA is also weakly fluorescent, so PDA can provide dual signaling capability. The stimulus-induced intense blue-to-red transition and fluorescence enhancement of the PDAs have led to the development of various chemosensors.28 The dual signal generation is mainly attributed to the interfacial perturbation of PDAs caused by external stimuli, which can subsequently induce a conformational change of the PDA conjugated backbone. To date, a variety of PDA-based sensors have been developed for chemical, biological and environmental analytes such as virus,29 DNAs,30 enzymes,31–35 proteins,36,37 metal ions,38–41 surfactants42–44 and organic solvents.45,46 In addition, a few examples of PDA-based colorimetric sensors for Pb2+ detection have also been reported (Fig. 1).47–53 Certainly, naked-eye detection is the simplest process that can be applied for environmental purposes.
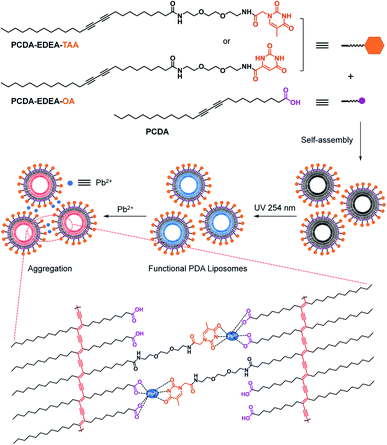
With the aim to develop more efficient PDA-based sensors for Pb2+ recognition, herein we first designed and synthesized thymine-1-acetic acid- and orotic acid-functionalized diacetylene monomers PCDA–EDEA–TAA and PCDA–EDEA–OA since the carbonyl group in thymine-1-acetic acid or orotic acid possesses high complexing power toward Pb2+ (Scheme 1).54 The binding constants of PDA–EDEA–TAA for various metal ions were calculated according to previously reported methods and shown in Table S1.†55,56 By co-assembly of PCDA–EDEA–TAA (or PCDA–EDEA–OA) and 10,12-pentacosadiynoic acid (PCDA), two new PDA-based liposome chemosensors for colorimetric and fluorometric detection of Pb2+ were obtained. Upon the addition of various metal ions into the liposome solutions, only Pb2+ could cause a distinct color change from blue to red observable by naked eye and a dramatic fluorescence enhancement, which clearly showed that PDA–EDEA–TAA and PDA–EDEA–OA liposomes possessed excellent selectivity and high sensitivity. The current work may offer new method for Pb2+ recognition in a more efficient manner.
2 Results and discussion
2.1 Optimization of PDA liposome components
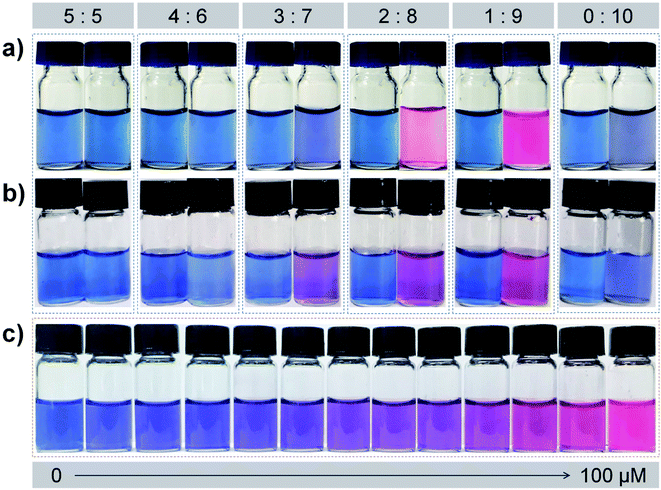
To obtain effective PDA liposome sensors for Pb2+ detection, it is desirable to investigate the optimal PDA liposome components since the monomer compositions in the liposome can significantly affect its recognition and sensing behavior.57 A series of PDA liposome solutions were prepared by using different mole ratios of PCDA–EDEA–TAA (or PCDA–EDEA–OA) and PCDA. After photoinduced polymerization under 254 nm UV light, blue colored suspensions were obtained. The colorimetric responses of each kind of PDA liposomes in the presence of different concentrations of Pb2+ were then examined (Fig. 2). It can be seen that PDA liposomes prepared from PCDA–EDEA–TAA (or PCDA–EDEA–OA) and PCDA with different mole ratios displayed different color responses to Pb2+. Among them, PDA liposomes prepared with a 1![[thin space (1/6-em)]](https://www.rsc.org/images/entities/char_2009.gif) :
:![[thin space (1/6-em)]](https://www.rsc.org/images/entities/char_2009.gif) 9 mole ratio of PCDA–EDEA–TAA (or PCDA–EDEA–OA) and PCDA showed the most distinct color changes from blue to red in the presence of 100 μM Pb2+ (Fig. 2a and b). Color changes of PDA liposomes prepared from PCDA–EDEA–TAA and PCDA (mole ratio, 1
9 mole ratio of PCDA–EDEA–TAA (or PCDA–EDEA–OA) and PCDA showed the most distinct color changes from blue to red in the presence of 100 μM Pb2+ (Fig. 2a and b). Color changes of PDA liposomes prepared from PCDA–EDEA–TAA and PCDA (mole ratio, 1![[thin space (1/6-em)]](https://www.rsc.org/images/entities/char_2009.gif) :
:![[thin space (1/6-em)]](https://www.rsc.org/images/entities/char_2009.gif) 9) became more apparent with the increased concentrations of Pb2+ (0–100 μM) (Fig. 2c). A discernible color change from blue to purple was observed when 20 μM of Pb2+ was added, indicating the potential application of PDA liposomes for Pb2+ recognition in the naked-eye. The colorimetric response values (CR, %) calculated using the UV-vis absorbance spectroscopic data were about 60% (PCDA–EDEA–TAA) and 52% (PCDA–EDEA–OA) when 100 μM Pb2+ was added respectively (Fig. 3). With the increase of the monomer component PCDA–EDEA–TAA (or PCDA–EDEA–OA) in the liposomes, the color responses of PDA liposomes to Pb2+ gradually decreased. When the mole ratio of PCDA–EDEA–TAA (or PCDA–EDEA–OA) to PCDA reached 5
9) became more apparent with the increased concentrations of Pb2+ (0–100 μM) (Fig. 2c). A discernible color change from blue to purple was observed when 20 μM of Pb2+ was added, indicating the potential application of PDA liposomes for Pb2+ recognition in the naked-eye. The colorimetric response values (CR, %) calculated using the UV-vis absorbance spectroscopic data were about 60% (PCDA–EDEA–TAA) and 52% (PCDA–EDEA–OA) when 100 μM Pb2+ was added respectively (Fig. 3). With the increase of the monomer component PCDA–EDEA–TAA (or PCDA–EDEA–OA) in the liposomes, the color responses of PDA liposomes to Pb2+ gradually decreased. When the mole ratio of PCDA–EDEA–TAA (or PCDA–EDEA–OA) to PCDA reached 5![[thin space (1/6-em)]](https://www.rsc.org/images/entities/char_2009.gif) :
:![[thin space (1/6-em)]](https://www.rsc.org/images/entities/char_2009.gif) 5, the PDA liposomes exhibited little color change, even after 100 μM of Pb2+ was added (CR, ∼4%). PDA liposomes derived from pure PCDA was also investigated and slight color changes were displayed (CR, ∼5%). These results demonstrate that both the carboxylic acid groups and thymine-1-acetic acid (or orotic acid) groups are essential for the colorimetric detection of Pb2+, and the mole ratio of carboxyl acid group to thymine-1-acetic acid (or orotic acid) group on the surface of PDA liposomes plays a key role in the recognition of Pb2+. It is desirable to note that a suitable local “micro-environment” produced by the two groups is important for the detection of Pb2+.57 In view of the color change results, PDA liposomes prepared from 1
5, the PDA liposomes exhibited little color change, even after 100 μM of Pb2+ was added (CR, ∼4%). PDA liposomes derived from pure PCDA was also investigated and slight color changes were displayed (CR, ∼5%). These results demonstrate that both the carboxylic acid groups and thymine-1-acetic acid (or orotic acid) groups are essential for the colorimetric detection of Pb2+, and the mole ratio of carboxyl acid group to thymine-1-acetic acid (or orotic acid) group on the surface of PDA liposomes plays a key role in the recognition of Pb2+. It is desirable to note that a suitable local “micro-environment” produced by the two groups is important for the detection of Pb2+.57 In view of the color change results, PDA liposomes prepared from 1![[thin space (1/6-em)]](https://www.rsc.org/images/entities/char_2009.gif) :
:![[thin space (1/6-em)]](https://www.rsc.org/images/entities/char_2009.gif) 9 mole ratio of PCDA–EDEA–TAA (or PCDA–EDEA–OA) to PCDA (denoted as PDA–EDEA–TAA or PDA–EDEA–OA) was chosen as the optimal detection system for further investigation on Pb2+ detection.
9 mole ratio of PCDA–EDEA–TAA (or PCDA–EDEA–OA) to PCDA (denoted as PDA–EDEA–TAA or PDA–EDEA–OA) was chosen as the optimal detection system for further investigation on Pb2+ detection.
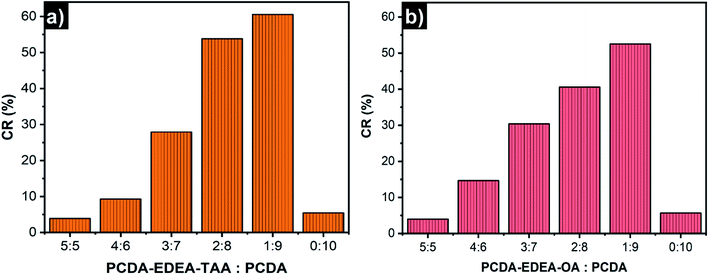 | ||
| Fig. 3 CR (%) values of PDA liposomes (100 μM) prepared from different mole ratios of (a) PCDA–EDEA–TAA and PCDA, (b) PCDA–EDEA–OA and PCDA in the presence of 100 μM Pb2+ ions. | ||
2.2 The mechanism of PDA liposomes for Pb2+
To gain insight into the detection mechanism of PDA–EDEA–TAA liposomes for Pb2+, the size changes of PDA–EDEA–TAA liposomes were investigated by using the dynamic light scattering (DLS) method.57,58 Prior to being irradiated with UV light, the liposome particles exhibited an average size of 122 nm (Fig. S4a†). The size of the liposome contracted to 91 nm after 254 nm UV light treatment because the polymerization of the diacetylene monomers could make the lipid molecules compact (Fig. S4b†). The size of PDA–EDEA–TAA liposomes increased to 955 nm in the presence of 100 μM Pb2+ (Fig. S4c†). Morphological studies by using the transmission electron microscopy (TEM) also showed that only Pb2+ or PDA–EDEA–TAA liposomes were almost spherical and well separated (Fig. 4a and b). However, the addition of 100 μM Pb2+ induced extensive aggregation of liposomes (Fig. 4c). These phenomena confirmed the strong complexation of Pb2+ with both carboxyl group and thymine-1-acetic acid groups, which further resulted in the aggregation of PDA–EDEA–TAA liposomes. These intermolecular and intramolecular interactions were believed to produce the interfacial perturbations of the PDA and subsequently resulted in the conformational changes of PDA conjugated backbone. The resulting color change and fluorescence transition can be used for naked-eye detection of Pb2+. | ||
| Fig. 4 TEM micrographs of (a) only Pb2+, and PDA–EDEA–TAA liposomes: (b) before and (c) after addition of 100 μM Pb2+. Scale bar is 100 nm. | ||
An in situ 1H-NMR spectroscopy was also performed to further verify the intense complexation of Pb2+ with carboxyl and thymine-1-acetic acid groups. As shown in Fig. S5,† the bottom blue NMR spectrum was a mixture of PCDA and PCDA–EDEA–TAA in a 9![[thin space (1/6-em)]](https://www.rsc.org/images/entities/char_2009.gif) :
:![[thin space (1/6-em)]](https://www.rsc.org/images/entities/char_2009.gif) 1 mole ratio, and the peaks at 11.97 and 11.27 ppm were the characteristic resonance signals of –COOH and –NH–, respectively. The top red NMR spectrum was the mixture after adding 100 μM Pb2+ for 5 min. As can be seen from the spectra, the resonances of the –COOH and –NH– protons were easily observed before the addition of Pb2+. However, after the addition of Pb2+ for 5 min, the resonance peaks at 11.97 and 11.27 ppm were completely disappeared. All the above results demonstrated that Pb2+ could form complexes with carboxyl and thymine-1-acetic acid groups, as depicted in Scheme 1.
1 mole ratio, and the peaks at 11.97 and 11.27 ppm were the characteristic resonance signals of –COOH and –NH–, respectively. The top red NMR spectrum was the mixture after adding 100 μM Pb2+ for 5 min. As can be seen from the spectra, the resonances of the –COOH and –NH– protons were easily observed before the addition of Pb2+. However, after the addition of Pb2+ for 5 min, the resonance peaks at 11.97 and 11.27 ppm were completely disappeared. All the above results demonstrated that Pb2+ could form complexes with carboxyl and thymine-1-acetic acid groups, as depicted in Scheme 1.
2.3 Detection of Pb2+ using PDA–EDEA–TAA (or PDA–EDEA–OA) liposomes in aqueous solution
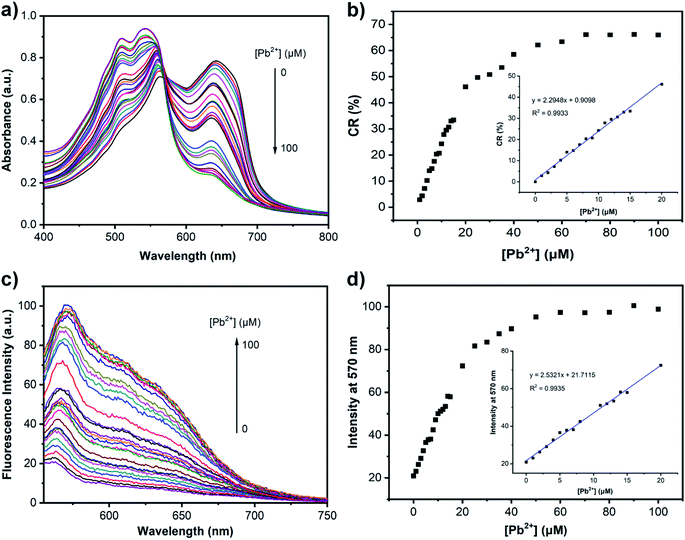
After obtaining the optimal detection system, we then evaluated the optical spectral changes of PDA–EDEA–TAA (or PDA–EDEA–OA) liposomes in the presence of different concentrations of Pb2+ (0–100 μM) at a given concentration (100 μM). As displayed in Fig. 5a and S7a,† the addition of increasing amount of Pb2+ resulted in a dramatically decrease of absorption intensity at 640 nm, accompanied by a simultaneous increase of a new absorption band at 550 nm, indicating this system demonstrated a typical blue-to-red transition of the PDA sensors. Notably, when the concentration of Pb2+ was greater than 50 μM, PDA liposomes showed a slight color transition and only a negligible absorbance change was observed, suggesting that the binding sites on the surface of PDA liposomes were saturated by the formation of Pb2+ complexes. In addition, the color response was quite fast, the CR value reached, approximately, 36.4% within 2 min, and the color obviously changed which could be easily observed via naked-eye. As the time increased, the CR value increased, gaining its maximum within 25 min (Fig. S6†). The linear relationships were observed between CR values and the concentration of Pb2+ in the range of 0 to 20 μM, with R2 = 0.9933 and R2 = 0.9929 (Fig. 5b and S7b, inset†). The maximal CR values (∼63% or ∼50%) were gained after adding 50 μM of Pb2+, and the CR values almost remained constant when the concentration of Pb2+ was over 50 μM (Fig. 5b and S7b†). These results are consistent with the observation of color and spectral changes mentioned above, which further indicated the saturation of PDA–EDEA–TAA (or PDA–EDEA–OA) liposomes by Pb2+. The detection of Pb2+ using the PDA–EDEA–TAA (or PDA–EDEA–OA) liposomes was also evaluated by fluorescence spectroscopy as the blue-to-red transition of PDA is usually accompanied by fluorescence enhancement. As expected, the fluorescence intensity was gradually increased as the concentration of Pb2+ increased (Fig. 5c or S7c†). A linear correlation (R2 = 0.9935 or 0.9923) was also obtained with the concentration of Pb2+ in the range of 0 to 20 μM (Fig. 5d and S7d, inset†). By monitoring the emission change with different concentrations of Pb2+ using 100 μM blue PADs, the calculated detection limits were 38 nM (PDA–EDEA–TAA) and 25 nM (PDA–EDEA–OA), respectively.2.4 Selectivity of PDA–EDEA–TAA (or PDA–EDEA–OA) liposomes
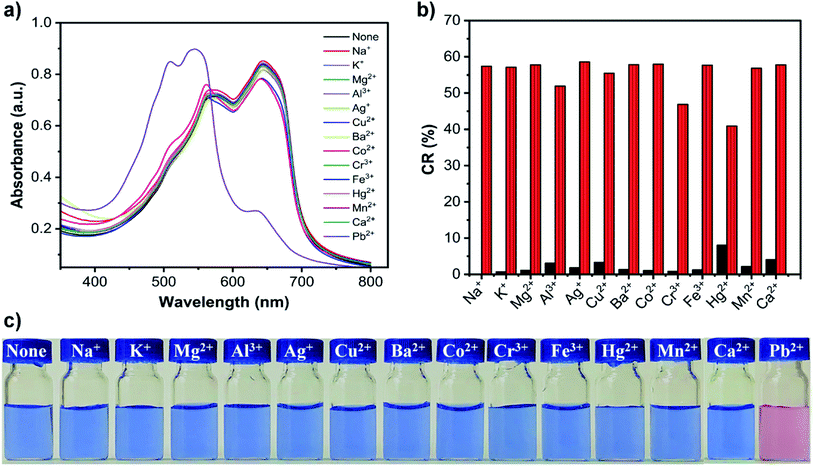
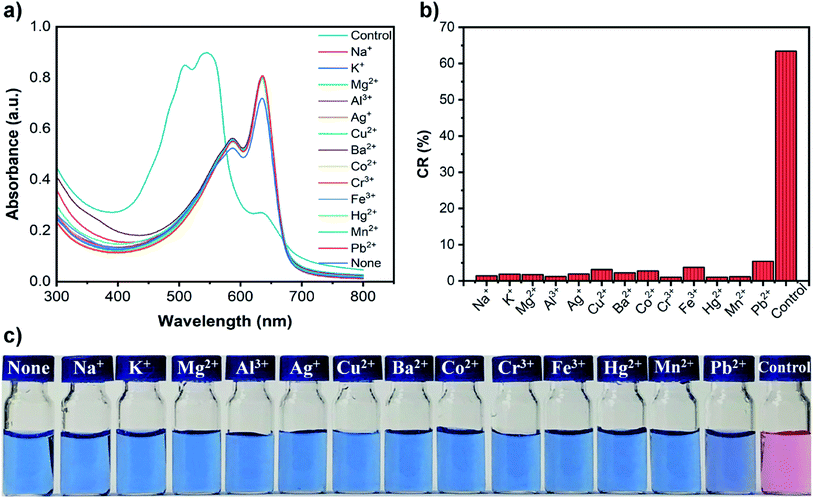
To investigate the selectivity of PDA–EDEA–TAA and PDA–EDEA–OA liposomes for Pb2+, other metal ions including Na+, K+, Mg2+, Al3+, Ag+, Cu2+, Ba2+, Co2+, Cr3+, Fe3+, Hg2+, Ca2+, Zn2+, Cd2+ and Mn2+ were chosen to introduce into the PDA–EDEA–TAA or PDA–EDEA–OA liposomes. The UV-vis absorption spectra and corresponding color changes in the presence of various metal ions (100 μM) were distinctly shown in Fig. 6a, c, S8a and c.† It can be seen that only Pb2+could cause a significant spectral change accompanied by an obvious color change. Other metal ions almost caused no spectral and color changes in PDA–EDEA–TAA or PDA–EDEA–OA liposomes. It is worth noting that PDA–EDEA–TAA and PDA–EDEA–OA liposomes showed slight color and spectral changes in the presence of Hg2+ and Cd2+, respectively. However, the color responses of Hg2+ and Cd2+ were quite mild compared with Pb2+. As control experiments, we also studied the color changes of the PDA liposomes prepared from pure PCDA to these metal ions. However, no significant color changes were observed (Fig. 7c and S9c†). Such observations indicate that the excellent selectivity of PDA–EDEA–TAA or PDA–EDEA–OA liposomes for Pb2+ may be plausibly ascribed to the strong interactions of Pb2+ with the thymine-1-acetic acid (or orotic acid) and the carboxylate carbonyl groups of the adjacent PCDA-acid moiety. The addition of Pb2+ might disturb the backbone of the PDA polymer, allowing the release of the strain energy imposed on the alkyl side chains generated during polymerization. The release of the side chain strain might cause partial distortion of the arrayed p-orbitals, which can lead to the observed change in optical properties.47 To further verify the selectivities of PDA–EDEA–TAA or PDA–EDEA–OA liposomes for Pb2+, interference experiments were also performed by adding Pb2+ into these metal ion-containing solutions and their CR values were calculated (Fig. 7b and S9b†). Relatively low CR values (0–8%) were obtained in the presence of other metal ions. However, the CR values of the mixed suspensions were enhanced after the addition of Pb2+ with a clear color change from blue to red. In addition, the selectivity was expressed quantitatively by the selectivity coefficient, as shown in Table S2.† The selectivity coefficient was the ratio of the slope of given metal ions to the slope of Pb2+, and the selectivity coefficients were found in the range of 0.3–15%. These results indicate that the presented PDA–EDEA–TAA and PDA–EDEA–OA liposomes could act as sensitive and selective colorimetric sensors to detect Pb2+ with no or little interference from other competitive metal ions.2.5 Determination of Pb2+ content in actual water samples
To further investigate the applicability of the probes, PDA–EDEA–TAA and PDA–EDEA–OA were used to detect Pb2+ in real samples. The water samples were collected from a tap in the laboratory at Northwest A&F University. They were used without further purification after sitting for 12 h and were divided into two groups. The recovery experiments were conducted by standard addition methods. All real samples were first spiked with different concentrations of Pb2+, and then precisely detected with the probe PDA–EDEA–TAA or PDA–EDEA–OA (100 μM). As the obtained results listed in Table 1, the recoveries for the method were found in the range of 101.3–103.6%, with the relative standard deviations (RSD) ranging from 2% to 3% and the relative errors being of 1.3% to 3.6%, a good agreement was obtained between the added and measured of spiked samples, revealing no influence of tape water matrix on the sensitivity of the Pb2+ analysis.| PDA liposome | Added (μM) | Detected (![[x with combining macron]](https://www.rsc.org/images/entities/i_char_0078_0304.gif) 1 ± RSD2) (μM) 1 ± RSD2) (μM) |
Recovery (%) | Relative error (%) |
|---|---|---|---|---|
| PDA–EDEA–TAA | 0 | 0 | — | — |
| 5.0 | 5.13 ± 0.03 | 102.6 | 2.6 | |
| 10.0 | 10.21 ± 0.03 | 102.1 | 2.1 | |
| PDA–EDEA–OA | 0 | 0 | — | — |
| 5.0 | 5.18 ± 0.03 | 103.6 | 3.6 | |
| 10.0 | 10.13 ± 0.02 | 101.3 | 1.3 |
3 Conclusions
In summary, we have developed two new efficient PDA-based chemosensor systems for the detection of Pb2+ in aqueous solution. Among the various metal ions, PDA–EDEA–TAA and PDA–EDEA–OA displayed a selective colorimetric change from blue to red, as well as fluorescence enhancement. Most importantly, a clear color change could be easily observed via naked-eye in the presence of 20 μM Pb2+. The detection limits of PDA–EDEA–TAA and PDA–EDEA–OA systems are 38 nM and 25 nM, respectively. Importantly, the two probes were used to trace amounts of Pb2+ in real water samples with good recoveries and less the relative standard deviations, indicating that the developed method had a good sensitivity and precision in real tape water matrix and can be further used for the analysis of trace Pb2+ in practical samples.4 Experimental
4.1 Chemicals and instrumentation
The chemicals and instrumentation used in this study can be found in the ESI.†4.2 Synthesis of PCDA derivatives PCDA–EDEA–TAA and PCDA–EDEA–OA
The diacetylene monomers PCDA–EDEA–TAA and PCDA–EDEA–OA were synthesized through a typical procedure as shown in Scheme S1.† 10,12-Pentacosadiynoic acid (PCDA) was reacted with N-hydroxysuccinimide (NHS) in the presence of 1-(3-dimethylaminopropyl)-3-ethylcarbodiimide hydrochloride (EDC·HCl), followed by reaction with 2,2′-(ethylenedioxy)bis(ethylamine) (EDEA) in anhydrous CH2Cl2 at room temperature, afforded PCDA derivative PCDA–EDEA with 78.4% yield. Then, PCDA–EDEA was reacted with thymine-1-acetic acid (TAA) or orotic acid (OA) in the presence of EDC·HCl and NHS in the solvent of N,N-dimethylformamide (DMF) respectively, to give the desired diacetylene monomers PCDA–EDEA–TAA and PCDA–EDEA–OA as white solids. Experimental details and characterization are provided in the ESI.†4.3 Preparation of PDA liposomes
The PDA liposomes used in this study were achieved following the probe sonication method.35 In short, a mixture of PCDA–EDEA–TAA (or PCDA–EDEA–OA) and PCDA with different mole ratios (5![[thin space (1/6-em)]](https://www.rsc.org/images/entities/char_2009.gif) :
:![[thin space (1/6-em)]](https://www.rsc.org/images/entities/char_2009.gif) 5, 4
5, 4![[thin space (1/6-em)]](https://www.rsc.org/images/entities/char_2009.gif) :
:![[thin space (1/6-em)]](https://www.rsc.org/images/entities/char_2009.gif) 6, 3
6, 3![[thin space (1/6-em)]](https://www.rsc.org/images/entities/char_2009.gif) :
:![[thin space (1/6-em)]](https://www.rsc.org/images/entities/char_2009.gif) 7, 2
7, 2![[thin space (1/6-em)]](https://www.rsc.org/images/entities/char_2009.gif) :
:![[thin space (1/6-em)]](https://www.rsc.org/images/entities/char_2009.gif) 8, 1
8, 1![[thin space (1/6-em)]](https://www.rsc.org/images/entities/char_2009.gif) :
:![[thin space (1/6-em)]](https://www.rsc.org/images/entities/char_2009.gif) 9, 0
9, 0![[thin space (1/6-em)]](https://www.rsc.org/images/entities/char_2009.gif) :
:![[thin space (1/6-em)]](https://www.rsc.org/images/entities/char_2009.gif) 10) was dissolved in 1 mL of chloroform. Then, the organic solvent was completely removed under nitrogen gas and an appropriate amount of ultrapurified water was subsequently added to give a total lipid concentration of 1 mM. The resulting mixture was sonicated for 30 min at 80 °C to afford a transparent or translucent solution. The formed liposome solution was cooled and stored at 4 °C at least 6 h. The composite vesicles were converted into a deep-blue solution upon UV irradiation for 15–20 min at room temperature. The obtained PDA liposome solutions could be stored at 4 °C for one week without forming a precipitation. Pure polymerized PCDA (PDA) vesicles were prepared following a similar process.
10) was dissolved in 1 mL of chloroform. Then, the organic solvent was completely removed under nitrogen gas and an appropriate amount of ultrapurified water was subsequently added to give a total lipid concentration of 1 mM. The resulting mixture was sonicated for 30 min at 80 °C to afford a transparent or translucent solution. The formed liposome solution was cooled and stored at 4 °C at least 6 h. The composite vesicles were converted into a deep-blue solution upon UV irradiation for 15–20 min at room temperature. The obtained PDA liposome solutions could be stored at 4 °C for one week without forming a precipitation. Pure polymerized PCDA (PDA) vesicles were prepared following a similar process.
4.4 Characterization of PDA liposomes
The morphology of PDA liposomes prepared from PCDA–EDEA–TAA and PCDA (mole ratio, 1![[thin space (1/6-em)]](https://www.rsc.org/images/entities/char_2009.gif) :
:![[thin space (1/6-em)]](https://www.rsc.org/images/entities/char_2009.gif) 9) before or after the addition of 100 μM Pb2+ was characterized by using a transmission electron microscope (TEM). For the typical experiment, a drop of the freshly prepared sample was dropped onto a carbon-supported copper grid and dried gradually at room temperature before observation. Dynamic light scattering (DLS) particle size distribution of PCDA–EDEA–TAA liposomes in HEPHS before and after UV irradiation, or in the presence of 100 μM of Pb2+ was determined with a Zetasizer Nano ZS (Malvern Instruments Co, UK). The liposome solutions were measured at room temperature and each diameter value was an average result of continuous measurements in a 5 min period. At least, three measurements were performed for each solution. The particle size distribution was related to the scattered light intensity.57
9) before or after the addition of 100 μM Pb2+ was characterized by using a transmission electron microscope (TEM). For the typical experiment, a drop of the freshly prepared sample was dropped onto a carbon-supported copper grid and dried gradually at room temperature before observation. Dynamic light scattering (DLS) particle size distribution of PCDA–EDEA–TAA liposomes in HEPHS before and after UV irradiation, or in the presence of 100 μM of Pb2+ was determined with a Zetasizer Nano ZS (Malvern Instruments Co, UK). The liposome solutions were measured at room temperature and each diameter value was an average result of continuous measurements in a 5 min period. At least, three measurements were performed for each solution. The particle size distribution was related to the scattered light intensity.57
4.5 Detection of Pb2+ using PDA liposomes
The typical experiment of Pb2+ detection was according to our previous method.58 To evaluate the color change of the PDA liposomes, the colorimetric response (CR, %) was employed to determine the extent of color transition.36,51,52 The formula is defined as follows:| CR = [(PB0 − PB1)/PB0] × 100% |
4.6 Detection of Pb2+ in real samples
The real samples were collected from the tap in the laboratory at Northwest A&F University, Yangling, Shaanxi. They were used without further purification after sitting for 12 h and were divided into two groups. One group was pretreated with different concentrations of Pb2+ as the experiment group (spiked) and the other group, without any pretreatment, was the control (unspiked). The method of processing samples follows references.59,60Author contributions
Shu-Wei Chen: conceptualization, supervision, methodology, investigation, writing-review & editing. Xipeng Chen: methodology, investigation, data curation. Yang Li: methodology, investigation, data curation. Yalin Yang: methodology, investigation. Yuchuan Dong: methodology. Jinwen Guo: investigation. Jinyi Wang: conceptualization, supervision, writing-review & editing.Conflicts of interest
There are no conflicts to declare.Acknowledgements
We gratefully acknowledge National Natural Science Foundation of China (21202131, 21874108 and 21675126), Natural Science Foundation of Shaanxi Province (2019JM-022) and the Chinese Universities Scientific Fund (2452018160, 2452021164). We thank the Life Science Research Core Services, NWAFU (Lei Chen) for technical support.Notes and references
- H. Needleman, Annu. Rev. Med., 2004, 55, 209–222 CrossRef CAS PubMed.
- H. L. Needleman, Human lead exposure, CRC Press, Boca Raton, FL, 1992, pp. 23–43 Search PubMed.
- Y. Finkelstein, M. E. Markowitz and J. F. Rosen, Brain Res. Rev., 1998, 27, 168–176 CrossRef CAS PubMed.
- Guidelines for Drinking-water Quality, World Health Organization, Geneva, Switzerland, 4th edn, 2011, p. 383 Search PubMed.
- P. J. Parsons, H. Qiao, K. M. Aldous, E. Mills and W. Slavin, Spectrochim. Acta, Part B, 1995, 50, 1475–1480 CrossRef.
- A. T. Townsend, K. A. Miller, S. McLean and S. Aldous, J. Anal. At. Spectrom., 1998, 13, 1213–1219 RSC.
- X. Jia, J. Li and E. Wang, Electroanalysis, 2010, 22, 1682–1687 CrossRef CAS.
- H. N. Kim, W. X. Ren, J. S. Kim and J. Yoon, Chem. Soc. Rev., 2012, 41, 3210–3244 RSC.
- J. Li and Y. Lu, J. Am. Chem. Soc., 2000, 122, 10466–10467 CrossRef CAS.
- J. Liu and Y. Lu, J. Am. Chem. Soc., 2003, 125, 6642–6643 CrossRef CAS PubMed.
- Y. Xiang, A. Tong and Y. Lu, J. Am. Chem. Soc., 2009, 131, 15352–15357 CrossRef CAS PubMed.
- T. Li, E. Wang and S. Dong, Anal. Chem., 2010, 82, 1515–1520 CrossRef CAS PubMed.
- X.-H. Zhao, R.-M. Kong, X.-B. Zhang, H.-M. Meng, W.-N. Liu, W. Tan, G.-L. Shen and R.-Q. Yu, Anal. Chem., 2011, 83, 5062–5066 CrossRef CAS PubMed.
- P. Chen, B. Greenberg, S. Taghavi, C. Romano, D. van der Lelie and C. He, Angew. Chem., 2005, 117, 2775–2779 CrossRef.
- I.-B. Kim, A. Dunkhorst, J. Gilbert and U. H. F. Bunz, Macromolecules, 2005, 38, 4560–4562 CrossRef CAS.
- Z. Wang, J. H. Lee and Y. Lu, Adv. Mater., 2008, 20, 3263–3267 CrossRef CAS.
- H. Y. Lee, D. R. Bae, J. C. Park, H. Song, W. S. Han and J. H. Jung, Angew. Chem., 2009, 121, 1265–1269 CrossRef.
- L. Beqa, A. K. Singh, S. A. Khan, D. Senapati, S. R. Arumugam and P. C. Ray, ACS Appl. Mater. Interfaces, 2011, 3, 668–673 CrossRef CAS PubMed.
- S. Rouhani and S. Haghgoo, Sens. Actuators, B, 2015, 209, 957–965 CrossRef CAS.
- S. Deo and H. A. Godwin, J. Am. Chem. Soc., 2000, 122, 174–175 CrossRef CAS.
- J. Y. Kwon, Y. J. Jang, Y. J. Lee, K. M. Kim, M. S. Seo, W. Nam and J. Yoon, J. Am. Chem. Soc., 2005, 127, 10107–10111 CrossRef CAS PubMed.
- Q. He, E. W. Miller, A. P. Wong and C. J. Chang, J. Am. Chem. Soc., 2006, 128, 9316–9317 CrossRef CAS PubMed.
- L. Marbella, B. Serli-Mitasev and P. Basu, Angew. Chem., Int. Ed., 2009, 48, 3996–3998 CrossRef CAS PubMed.
- X. Pan, Y. Wang, H. Jiang, G. Zou and Q. Zhang, J. Mater. Chem., 2011, 21, 3604–3610 RSC.
- M. A. Reppy and B. A. Pindzola, Chem. Commun., 2007, 4317–4338 RSC.
- X. Sun, T. Chen, S. Huang, L. Li and H. Peng, Chem. Soc. Rev., 2010, 39, 4244–4257 RSC.
- B. Yoon, S. Lee and J.-M. Kim, Chem. Soc. Rev., 2009, 38, 1958–1968 RSC.
- X. Chen, G. Zhou, X. Peng and J. Yoon, Chem. Soc. Rev., 2012, 41, 4610–4630 RSC.
- A. Reichert, J. O. Nagy, W. Spevak and D. Charych, J. Am. Chem. Soc., 1995, 117, 829–830 CrossRef CAS.
- Y. K. Jung and H. G. Park, Biosens. Bioelectron., 2015, 72, 127–132 CrossRef CAS PubMed.
- S. Y. Okada, R. Jelinek and D. Charych, Angew. Chem., Int. Ed., 1999, 38, 655–659 CrossRef CAS PubMed.
- S. Kolusheva, T. Shahal and R. Jelinek, J. Am. Chem. Soc., 2000, 122, 776–780 CrossRef CAS.
- D.-E. Wang, J. Yan, J. Jiang, X. Liu, C. Chang, J. Xu, M.-S. Yuan, X. Han and J. Wang, Nanoscale, 2018, 10, 4570–4578 RSC.
- G. Zhou, F. Wang, H. Wang, S. Kambam, X. Chen and J. Yoon, ACS Appl. Mater. Interfaces, 2013, 5, 3275–3280 CrossRef CAS.
- D.-E. Wang, Y. Zhang, T. Li, Q. Tu and J. Wang, RSC Adv., 2014, 4, 16820–16823 RSC.
- S. Kolusheva, R. Zadmard, T. Schrader and R. Jelinek, J. Am. Chem. Soc., 2006, 128, 13592–13598 CrossRef CAS PubMed.
- Y. K. Jung, T. W. Kim, H. G. Park and H. T. Soh, Adv. Funct. Mater., 2010, 20, 3092–3097 CrossRef CAS.
- J. Lee, H.-J. Kim and J. Kim, J. Am. Chem. Soc., 2008, 130, 5010–5011 CrossRef CAS PubMed.
- D. A. Jose, S. Stadlbauer and B. König, Chem.–Eur. J., 2009, 15, 7404–7412 CrossRef CAS.
- D. A. Jose and B. König, Org. Biomol. Chem., 2010, 8, 655–662 RSC.
- K. M. Kim, D. J. Oh and K. H. Ahn, Chem.–Asian J., 2011, 6, 122–127 CrossRef CAS PubMed.
- X. Chen, J. Lee, M. J. Jou, J.-M. Kim and J. Yoon, Chem. Commun., 2009, 3434–3436 RSC.
- X. Chen, S. Kang, M. J. Kim, J. Kim, Y. S. Kim, H. Kim, B. Chi, S.-J. Kim, J. Y. Lee and J. Yoon, Angew. Chem., Int. Ed., 2010, 49, 1422–1425 CrossRef CAS PubMed.
- D.-E. Wang, L. Zhao, M.-S. Yuan, S.-W. Chen, T. Li and J. Wang, ACS Appl. Mater. Interfaces, 2016, 8, 28231–28240 CrossRef CAS PubMed.
- J. Yoon, S. K. Chae and J.-M. Kim, J. Am. Chem. Soc., 2007, 129, 3038–3039 CrossRef CAS PubMed.
- J. Lee, H. T. Chang, H. An, S. Ahn, J. Shim and J.-M. Kim, Nat. Commun., 2013, 4, 2461 CrossRef PubMed.
- K. M. Lee, X. Chen, W. Fang, J.-M. Kim and J. Yoon, Macromol. Rapid Commun., 2011, 32, 497–500 CrossRef CAS PubMed.
- S. Zhang, B. Shi and G. Yang, Macromol. Res., 2020, 28, 51–56 CrossRef CAS.
- P. Narkwiboonwong, G. Tumcharern, A. Potisatityuenyong, S. Wacharasindhu and M. Sukwattanasinitt, Talanta, 2011, 83, 872–878 CrossRef CAS PubMed.
- D. H. Kang, H.-S. Jung, N. Ahn, S. M. Yang, S. Seo, K.-Y. Suh, P.-S. Chang, N. L. Jeon, J. Kim and K. Kim, ACS Appl. Mater. Interfaces, 2014, 6, 10631–10637 CrossRef CAS PubMed.
- Y. Li, L. Wang, X. Yin, B. Ding, G. Sun, T. Ke, J. Chen and J. Yu, J. Mater. Chem. A, 2014, 2, 18304–18312 RSC.
- M. Wang, F. Wang, Y. Wang, W. Zhang and X. Chen, Dyes Pigm., 2015, 120, 307–313 CrossRef CAS.
- G. Yang, Z. Nie, S. Zhang, Z. Ge, J. Zhao, J. Zhang and B. Li, Macromol. Res., 2020, 28, 1192–1197 CrossRef CAS.
- H. Yin and S.-X. Liu, Inorg. Chem. Commun., 2009, 12, 187–190 CrossRef CAS.
- X. Y. Liu, D. R. Bai and S. Wang, Angew. Chem., Int. Ed., 2006, 45, 5475–5478 CrossRef CAS PubMed.
- M.-S. Yuan, Z.-Q. Liu and Q. Fang, J. Org. Chem., 2007, 72, 7915–7922 CrossRef CAS PubMed.
- Y.-S. Cho and K. H. Ahn, J. Mater. Chem. B, 2013, 1, 1182–1189 RSC.
- D.-E. Wang, Y. Wang, C. Tian, L. Zhang, X. Han, Q. Tu, M. Yuan, S. Chen and J. Wang, J. Mater. Chem. A, 2015, 3, 21690–21698 RSC.
- L. Lan, Q. Niu and T. Li, Anal. Chim. Acta, 2018, 1023, 105–114 CrossRef CAS PubMed.
- Y. Zhang, L. Chen, J. Yang, Y. Zhang and M.-S. Yuan, Spectrochim. Acta, Part A, 2020, 232, 118163 CrossRef CAS PubMed.
Footnote |
| † Electronic supplementary information (ESI) available. See https://doi.org/10.1039/d2ra03435b |
| This journal is © The Royal Society of Chemistry 2022 |

