 Open Access Article
A high-performance porous flexible composite film sensor for tension monitoring
Yuanyuan Fengab,
Rui Caic,
Yi Zhou d,
Zonghao Hub,
Yanlong Wanga,
Daiqiang Liua,
Sensen Hanef,
Jiankai Zhaoa,
Lisheng Xug and
Qingshi Meng
 *ab
*ab
aCollege of Aerospace Engineering and College of Civil Aviation Engineering, Shenyang Aerospace University, Shenyang 110136, China. E-mail: mengqingshi@hotmail.com
bShenyang Aircraft Design Institute, AVIC, Shenyang 110135, China
cSchool of Mechanical, Aerospace and Automotive Engineering, Coventry University, Coventry CV1 2JH, UK
dDyson School of Design Engineering, Imperial College London, London SW7 2DB, UK
eShi-changxu Innovation Center for Advanced Materials, Institute of Metal Research, Chinese Academy of Sciences, Shenyang 110016, China
fSchool of Materials Science and Engineering, University of Science and Technology of China, Shenyang 110016, China
gCollege of Medicine and Bioinformatics Engineering, Northeastern University, Shenyang 110819, China
First published on 15th September 2022
Abstract
Flexible, lightweight sensors with a wide strain-sensing range are showing increasing significance in structural health monitoring compared with conventional hard sensors, which typically have a small strain range, are heavyweight, and have a large volume. In this work, salt particle precipitation and mechanical coating methods are used to fabricate porous graphene nanoplatelet (GNP)/polydimethylsiloxane (PDMS) flexible sensors for tension monitoring in structural health applications. The signal transformation through the Back Propagation (BP) algorithm is integrated to provide monitoring data that are comparable with other sensors. The results reveal that the flexible sensors with a low content of GNPs (0.1–0.25 wt%) possess better flexibility, allowing tensile strains over 200% to be measured. In addition, due to the enhanced deformation capacity of the pore structures, they can achieve high sensitivity (1–1000) under 65% strain, and a fast response time (70 ms) under 10% strain at 60 mm min−1. They also show high performance in the fatigue test (20![[thin space (1/6-em)]](https://www.rsc.org/images/entities/char_2009.gif) 000 cycles) under 5% strain, and can effectively respond to bending and torsion. In addition, the sensors show an obvious response to temperature. Overall, the prepared flexible composite sensors in this work have the advantages of a wide strain-sensing range, a full-coverage conductive network, and being lightweight, and show potential for structural health monitoring in the near future.
000 cycles) under 5% strain, and can effectively respond to bending and torsion. In addition, the sensors show an obvious response to temperature. Overall, the prepared flexible composite sensors in this work have the advantages of a wide strain-sensing range, a full-coverage conductive network, and being lightweight, and show potential for structural health monitoring in the near future.
1 Introduction
Industrial equipment and devices are often subjected to complex load conditions during their service, which often lead to damage to their main structural parts.1,2 If this damage is not detected in time, this often results in a catastrophic accident with a potentially significant financial loss.3–5 Opening mode (Mode I crack) is the most common opening mode and contributes to the most damage. In this mode, the crack opening occurs under tensile stress.6–9 Because of this, it is of great significance to detect and monitor the tensile damage evolution in the tensile process to ensure structural safety, integrity, and operational performance. Commercially available sensors come in many diverse forms, such as metal-foil strain gauges, fiber grating sensors, and acoustic emission sensors.10–12 Among these sensors, the metal-sensitive gate of a traditional strain gauge can exist in the form of a foil, which has a certain flexibility and can be adapted to a surface with a small curvature. However, due to the limited material properties, the deformation range is small, and it is still difficult to install on the surface of complex structures. At the same time, a large number of strain gauges can form a dense sensor network, which causes significant unnecessary weight and volume to the inspected structure.13,14 Optical fiber sensors are widely used in sensing applications because of their advantages of being lightweight, and having low transmission loss and corrosion resistance, but optical-fiber-based sensors are brittle, and embedding optical fibers into structures, such as laminated composites, may not only complicate the fabrication process, but degrade the local strength of the composites.15,16 Acoustic emission testing is a dynamic detection method that detects energy coming from the tested part itself, and can be used to detect early-stage damage. However, acoustic emission testing is very sensitive and susceptible to noise interference.17–19 The emergence of flexible-sensor technology is expected to promote the application of structural health monitoring technology in complex practical engineering structures and make up for the limitations of existing sensor network technology.Flexible composite sensors have high flexibility, high sensitivity, a wide strain-sensing range, and a full-coverage conductive network. They can be easily installed on the surface of complex structures without excessive extra weight, providing a basis for the research of a new generation of sensors for structural health monitoring.20–23 Various functional materials, including carbon nanotubes (CNTs), carbon blacks (CBs), and silver nanowires (AgNWs), have been used for flexible sensor applications.24–28 Compared with metal nanoparticles, carbon-based nanoparticles form a network more easily under the same mass fraction, which makes them an ideal material for preparing flexible sensors. Zeng et al.29 prepared carbon black/polyvinylidene fluoride composite film sensors by a standard hot-pressing process for structural health monitoring with a sensitivity up to 5. Jung et al.30 obtained qualitatively comparable biomedical signals by adding 4.5 wt% of CNTs to PDMS. In order to reach the permeability threshold, a high concentration of carbon nanomaterials is required to achieve sufficient electrical conductivity. Due to the strong π–π interactions of carbon nanomaterials, uniformly dispersing them into polymer substrates remains a challenge.31 Wang et al.32 demonstrated dense graphene papers that were well stacked by conductive graphene nanosheets as an electrochemically stable host. In comparison with other porous carbon scaffolds/architectures, the reported 2D binder-free GN paper cathodes suggested more advantages for balancing ion channels and the utilization of graphitic ion storage regions.33 Liu et al.34 developed a facile approach to fabricate a highly sensitive and flexible polyurethane/graphene platelet composite film for use as a wearable strain sensor with a maximum tensile strain of 25%, and a gauge factor of up to 150.
In addition, combining flexible sensors with microstructures enables the manufacture of powerful and efficient sensors, which eventually realize high linearity and tiny hysteresis. In general, linearity represents a directly proportional relationship between the relative resistance variation and the applied strain, and the hysteresis originates from the viscoelasticity of the polymer and is related to the weak interactions between the polymer substrate and the conductive materials. The micropores undergo reversible mechanical deformation due to the decrease of viscoelasticity and the anti-barreling phenomenon, improving the linearity and decreasing the hysteresis of the composite, which significantly influence real-time detection accuracy and reliability in practical applications.35–37 Wang et al.38 prepared a porous aerogel structure of graphene oxide by freeze-casting, but the porous structures prepared by the ice-template method are mostly used in pressure sensors and have limitations in detecting tensile, bending, and torsional strains. Lee, Kim et al.39 developed a low-cost, flexible, porous sensor. In their research, the micropores are generated from the phase separation between a prepolymer material and deionized water. However, this method cannot effectively control the size and number of pores. Therefore, it is necessary to develop a method for preparing large-scale porous composite film sensors with simple operation and high performance.
In this study, porous PDMS/GNP composite film sensors are fabricated by salt particle precipitation and a mechanical coating method, which maximize the integrity of the overall structure and improve the sensitivity. The conductive GNP networks are dispersed over the porous matrix, and the whole material becomes a structure rich in numerous sensing units. The BP neural network algorithm is used to transform the electrical output responses into values of strain, and the results are compared with strain gauge and fiber Bragg grating tensile test results. Sensing performances of the porous strain sensors, including sensitivity, linearity, and response time coupled with long-term response durability, are investigated systematically. In addition, a method of signal transformation using the BP neural network is proposed, which can transform nonlinear models more accurately. The results are compared with the strain gauge and fiber Bragg grating tensile test results, verifying the overall monitoring ability of the porous PDMS/GNP composite film sensors.
2 Experimental section
2.1 Materials
The graphite intercalation compounds (GICs) were purchased from Qingdao Huatai Co., Ltd. PDMS (E620) was purchased from Shenzhen Hongye Technology Co., Ltd, China. Conductive copper pastes (NX-515, Tech) were purchased from the local market. All laboratory reagents were obtained from Tianjin Beichen Founder Reagent Factory, China.2.2 Fabrication of graphene nanoplatelets and their PDMS composites
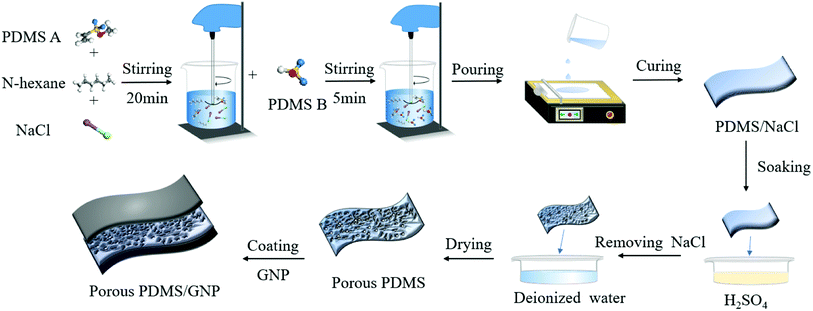
Fabrication of GNPs has been reported in our previous work.40–42 In short, 0.1 g GICs were heat-treated in a furnace at 700 °C. The expansion product was placed in acetone solution and ultrasonicated for 2 hours below 20 °C.Porous PDMS/GNP composite films were prepared by salt precipitation and mechanical coating. First, 5 g PDMS (component A), 2 g n-hexane, and 12 g NaCl (50–150 mesh) were added in sequence, and then mechanically stirred for 20 minutes. After thorough mixing, 5 g PDMS (Part B, curing agent) was added and the mixture stirred with a mixer for 5 minutes. Then, the mixture was poured onto a polytetrafluoroethylene mold and spread by an automatic film applicator (BEVS 1811/3). After curing for 5 h at 30 °C, the film was slowly removed into a thick plastic box with a small amount of concentrated sulfuric acid for 20 seconds. After that, the obtained film was soaked in deionized water for 5 h to remove the NaCl particles. Then, the PDMS porous film was obtained and placed in a fume hood for 1 h. After complete drying, a small amount of GNPs was coated on the surface of the film many times to obtain a porous PDMS/GNP composite film. The detailed process of the operation is shown in Fig. 1.
Finally, the porous PDMS/GNP composite film was cut to a customized rectangular shape (6.00 × 2.00 cm) by a laser cutting machine and encapsulated with a PU film to fabricate the strain sensors. Copper tape was stuck on both ends of the specimen to ensure good contact between the specimen and the electrode.
2.3 Characterization
The samples were prepared by suspending GNPs in N-methyl-2-pyrrolidone (NMP) at 0.0004 wt%. The mixture was ultrasonicated for 30 min below 30 °C and dropped on a 200-mesh copper net to dry. Transmission electron microscopy (TEM) images were obtained with a TEM (Hitachi, Japan) at 200 kV acceleration voltage. The thickness of the GNPs was obtained by atomic force microscopy (AFM, Bruker Icon). The oscillation magnitude was 15 nm, and the scan rate for 2 × 2 μm images was typically 0.5 Hz. The morphology of the porous film was observed using scanning electron microscopy (SEM, ZEISS Sigma 300). The film was sprayed with gold then the surface was observed at an accelerating voltage of 10 kV. Using a FLUKE 2638A data acquisition system, the resistance of the composites under different deformations was recorded under the conditions of a potential of 12 V and a current source of 100 μA. The sample was stretched at 25 °C by a universal tensile machine (GX-SF001, Shenzhen Shared Instrument Equipment Co. Ltd, China). For a typical thermal test between 30–80 °C, the composite film was placed into a program-controlled temperature chamber (Guangzhou-GWS Environmental Equipment Co., Ltd., Model MW3030).3 Results and discussion
3.1 Characterization of graphene nanoplatelets
Fig. 2(a) shows a transmission electron microscope (TEM) micrograph of a typical GNP in which some regions are featureless and almost transparent, indicating the presence of only a few layers or monolayers. A region in Fig. 2(a) was randomly selected and further examined, as shown in Fig. 2(b). Fig. 2(b) shows roughness at the edges, which enhances the mechanical interlocking with the PDMS substrate. The thickness of the GNPs was characterized by atomic force microscopy. Twenty graphene sheets were randomly selected for measurement, and their representative 2D morphologies are as shown in Fig. 2(a). AFM analysis indicates an average thickness of about 2.4 ± 0.45 nm for the line shown in Fig. 2(c), confirming that the GNPs are composed of a only a single sheet or a few layers of sheets.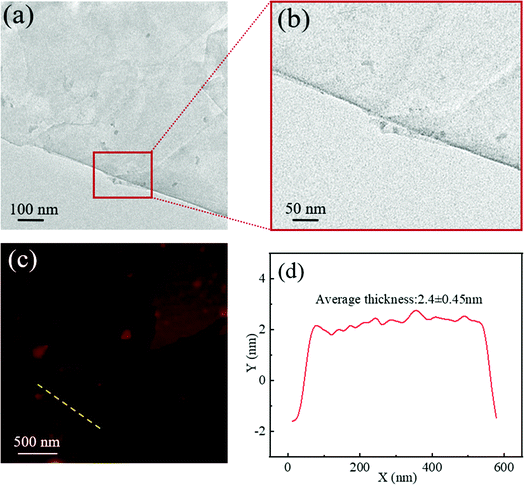 | ||
| Fig. 2 (a) TEM image of a GNP; (b) TEM image of a GNP at high magnification; (c) AFM image of a GNP; (d) average thickness of a GNP. | ||
3.2 Morphologies of the samples
The interior microstructures and morphologies of the porous pure PDMS film and the porous PDMS/GNP composite film are shown in Fig. 3. Fig. 3(a and b) show the morphology of the porous pure PDMS film. In the side view (Fig. 3(a)), the cross-section shows a uniformly dispersed pore structure. Due to the bonding between the salt particles, pores have been formed through the layer. The top view of the porous layer is observed in Fig. 3(b). The porous layer is formed by soaking the lower surface with concentrated sulfuric acid. As displayed in Fig. 3(b3), the surface of the porous layer is rough and there are many bumps with different sizes, which provide conditions for graphene to be firmly adsorbed on the surface. The areas of 500 μm × 500 μm were randomly selected in Fig. 3(a2 and b2), and the number and size of their pores were counted by the Image J software (National Institutes of Health). A statistical bar chart is shown in Fig. 3(f), which shows that the pores with different sizes are distributed uniformly. When the diameter of the salt particles is small, the pathway formed is relatively narrow, and it is difficult for the salt particles to fully precipitate through the layer to obtain uniform porous materials with a small aperture. The composite film was immersed in concentrated sulfuric acid to form a porous structure on the surface of the film. At this time, the salt particles inside can be fully dissolved and precipitated.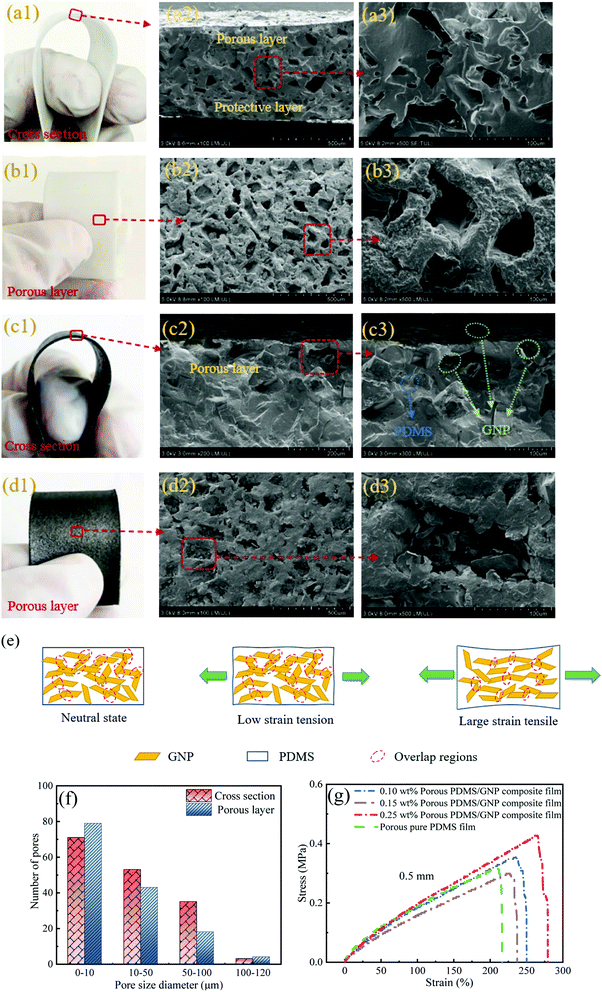 | ||
| Fig. 3 The porous pure PDMS film: (a1) photograph of the cross-section; (a2) SEM of the cross-section; (a3) SEM of the cross-section at higher magnification; (b1) photograph of the porous layer; (b2) SEM of the porous layer; (b3) SEM of the porous layer at higher magnification. The porous PDMS/GNP composite film: (c1) photograph of the cross-section; (c2) SEM of the cross-section; (c3) SEM of the cross section at higher magnification; (d1) photograph of the porous layer; (d2) SEM of the porous layer; (d3) SEM of the porous layer at higher magnification; (e) schematic of GNPs at neutral and tensile-loaded states; (f) number of pores in Fig. 3(a2 and b2); (g) stress–strain curves of different GNP fractions. | ||
The porous PDMS/GNP composite film was fabricated by mechanically coating GNPs on a porous pure PDMS film forming a 2D film of overlapping GNPs. Fig. 3(c1 and d1) are photographs of the porous PDMS/GNP composite film, showing the cross-section, and the porous layer. As illustrated in Fig. 3(c), the GNPs are fully dispersed on the PDMS surface layer and form a conductive layer. The middle of the film contained few GNPs; it is a sandwich structure composed almost purely of PDMS, and has a high resistance. Fig. 3(d2) is the SEM image of the porous layer, which shows the connection and overlap between adjacent plates, thus forming a large number of conductive paths. Some of the smaller pores are filled by GNPs. When the porous PDMS/GNP composite film is stretched, the GNPs that are loosely distributed in the pores will form a new conductive path, which improves the sensitivity, and the GNPs will not easily fall off. Fig. 3(d3) shows the SEM of the porous layer at higher magnification. Many exposed GNPs are found on the surfaces of the pore walls, which is helpful for improving the sensitivity of the composite. Strain sensors in polymer composites work based on the micro- and nano-movement of overlapped and connected electrically conductive fillers within the matrix. Therefore, the conductive filler must form a global network inside the matrix to establish a strain-sensing mechanism. To better understand the strain-sensing mechanism of the composite film sensor, we introduce a simple structural model of the conductive network in Fig. 3(e). At the neutral state, conductive particles are connected to each other, forming many conductive paths. In the stretched states, the area of the overlap decreases and the resistance increases. The model shows the tensile states of conductive particles under low strain and large strain.
In order to further prove the adhesion between the GNPs and the PDMS film, the sensor was blown with a hair dryer 10 times for 3 hours each, and the resistance was recorded each time. The relative resistance change recorded after being blown with a hair dryer 10 times did not fluctuate by more than 1%. This proves that the GNPs were firmly attached to the surface of the PDMS film.
In Fig. 3(g), the stress–strain curves of these sensors are shown. The fraction of GNPs is calculated by the difference in mass before and after coating the PDMS film with GNPs. Due to the limited range of the FLUKE data acquisition system, only GNP concentrations of 0.1–0.25 wt% can be monitored. This is because, when the fraction is lower than 0.1 wt%, no resistance signal can be detected. When the fraction is higher than 0.25 wt%, the GNPs have completely covered the surface of the porous PDMS film and reached a saturated state, and the resistance does not change significantly thereafter. The results show that the GNP concentration has no obvious effect on the mechanical properties of the films. The maximum tensile strength of 0.43 MPa is achieved at 0.25 wt% of GNPs. The elongation at the break of all component sensors is greater than 200%, providing a precondition to achieve a wider sensing range. GNPs were coated directly on to the surface of the composite, ensuring the integrity of the internal structure and reducing the number of conductive particles used in the filling method by about 20 times.30
3.3 Stretching sensitivity
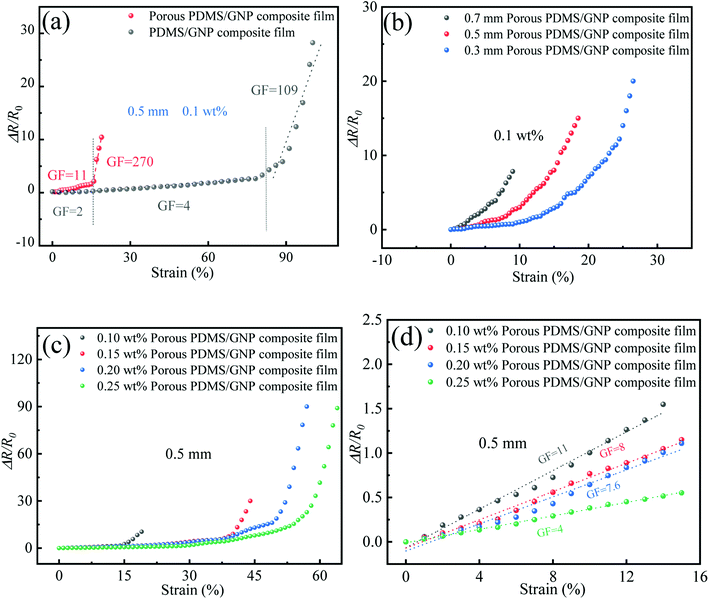
Fig. 4 displays the typical relative resistance variation–strain curves for the porous PDMS/GNP composite film sensors. The gauge factor (GF) was employed to investigate the sensitivity. The formula is as follows:| GF = ΔR/R0/ε | (1) |
0.1 wt% porous PDMS/GNP composite films were selected for the thickness sensitivity test under which better performance in an application can be obtained. The measurement results of the relative resistance changes with different thicknesses, 0.3 mm, 0.5 mm, and 0.7 mm, are shown in Fig. 4(b). Under the same strain, as the thickness of the composite film increases, ΔR/R0 increases, and the strain-sensing range decreases. The sensors were fabricated with four different concentrations of GNPs: 0.1 wt%, 0.15 wt%, 0.20 wt%, and 0.25 wt%, with a thickness of 0.5 mm. The results are shown in Fig. 4(c). When the axial tensile strain reached 60%, ΔR/R0 increased from 0 to 90, and the GF increased to over 1000 (a strain range of 50–65%). The results show that the smaller the fraction of GNPs, the smaller the strain range. In order to show ΔR/R0 clearly, the data with the strain of 0–15% is magnified in Fig. 4(d). From the results, it is shown that the sensor has a wide strain range of up to 65%, and the strain range increases with increasing GNP concentration. This is attributed to the film shape change at high strains, and the departure of conductive fillers based on the tunnelling effect at low strains.
By choosing an appropriate concentration of GNPs and a suitable thickness of the porous film, a strain sensor with high sensitivity, a wide working range, or a compromise between these two characteristics according to the application requirements, can be designed. Because structural health monitoring is mostly used in civil engineering, flexible aircraft, and other fields, the strain range of the structural parts involved in the design is more than 10%.49,50 The 0.7 mm thick 0.1 wt% porous PDMS/GNP composite film has the highest sensitivity, but the strain range is inadequate. Therefore, the 0.5 mm thick 0.1 wt% porous PDMS/GNP composite film was chosen for the following sensor performance test and tensile test. When the monitored strain range changes, the composite with the highest sensitivity can be selected according to the requirements.
3.4 Sensing performance of the porous PDMS/GNP composite film
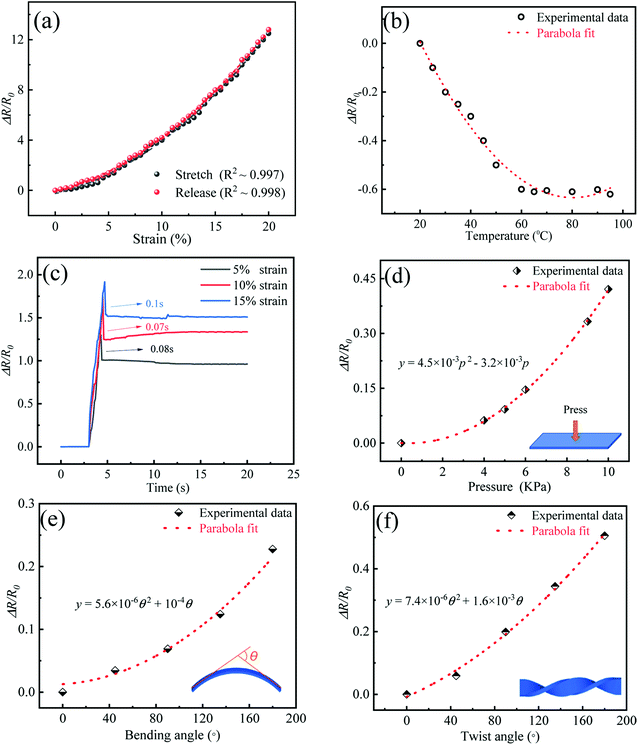
Fig. 5(a) shows ΔR/R0 for the 0.5 mm thick 0.1 wt% porous PDMS/GNP composite film sensor as a function of strain during the loading/unloading process with a maximum strain of 20%. The differences between the two response curves are negligible. Due to the chemical structure of PDMS and satisfactory interactions between GNPs and the PDMS substrate, the very weak sensing hysteresis endows PDMS/GNP composite film sensors with excellent reliability in practical applications. In order to get more intuitive GF analysis results, the GF of a sensor can be described by a mathematical function. The first derivative of the polynomial regression function of the sensitivity graph is obtained. A fitted second-order polynomial function with R2 = 0.997 for the sensitivity graph in Fig. 5(a) is derived by conducting linear regression analysis for the testing data using Origin software as,| ΔR/R0 (%) = 2.2ε2 + 18ε − 5.7 | (2) |
The GF, therefore, is derived as:
| GF = 4.4ε + 18 | (3) |
The GF has a linear relationship with strain. By substituting strain values of 0–20%, the GF is found to be 0–106 for the composite sensor.
Temperature drift generally refers to the fact that the change of ambient temperature causes changes to the semiconductor or conductor sensing parameters, leading to scattering of the output signals. Therefore, it is necessary to explore the effect of temperature on the conductivity of the porous PDMS/GNP composite film. The temperature response test was conducted over a temperature range of 20–100 °C.
In Fig. 5(b), the resistance of the composite decreases with increasing temperature. In the range of 20–60 °C, the relative resistance change decreases; after 60 °C, it gradually becomes stable at higher temperatures. This is mostly due to non-reversible changes in the electrical network associated with the morphological rearrangement of the GNPs.51 The results show that the composite is sensitive to temperature changes in the specific temperature range, indicating its potential as a temperature sensor.
In addition, the 0.5 mm thick 0.1 wt% porous PDMS/GNP composite film sensor exhibits hysteresis behavior when being stretched to 5%, 10%, and 15% at a rapid tensile rate (60 mm min−1), as shown in Fig. 5(c). After recovery of the overshoot, the resistance of the porous PDMS/GNP composite film sensor remains stable, indicating its reliable performance. The response time from the peak to the stationary state was 0.08 s, 0.07 s and 0.1 s for 5%, 10% and 15% strains, respectively, with the data showing very rapid responses without any obvious hysteresis.
Fig. 5(d) shows ΔR/R0 of the strain sensor under different pressures. The relative resistance change increases from 0 to 450%, when the pressure changes from 0 to 10 MPa. The ΔR/R0 versus pressure can be fitted to a parabolic equation:
| y = 4.5 × 10⁻³p2 − 3.2 × 10⁻³p | (4) |
| y = 5.6 × 10⁻⁶θ2 + 10−4θ | (5) |
| y = 7.4 × 10⁻⁶θ2 + 1.6 × 10⁻³θ | (6) |
The relative resistance change is 519% at the twist angle of 180°. This characteristic shows that the porous PDMS/GNP composite film with excellent flexibility can be adapted to practical monitoring, and arranged on substrates with arbitrary angular shapes.
3.5 Strain fatigue characteristics
To prove the stability of the sensor over time, the 0.5 mm thick 0.1 wt% porous PDMS/GNP composite film sensor was tested for 20![[thin space (1/6-em)]](https://www.rsc.org/images/entities/char_2009.gif) 000 cycles under 5% strain at 1 Hz, as shown in Fig. 6(a). Insets also show the expanded responses for 0–50, 10
000 cycles under 5% strain at 1 Hz, as shown in Fig. 6(a). Insets also show the expanded responses for 0–50, 10![[thin space (1/6-em)]](https://www.rsc.org/images/entities/char_2009.gif) 000–10
000–10![[thin space (1/6-em)]](https://www.rsc.org/images/entities/char_2009.gif) 100 and 19
100 and 19![[thin space (1/6-em)]](https://www.rsc.org/images/entities/char_2009.gif) 950–20
950–20![[thin space (1/6-em)]](https://www.rsc.org/images/entities/char_2009.gif) 000 cycles. ΔR/R0 gradually decreases and stabilizes around the 5000th cycle. It then remains constant until the end of 20
000 cycles. ΔR/R0 gradually decreases and stabilizes around the 5000th cycle. It then remains constant until the end of 20![[thin space (1/6-em)]](https://www.rsc.org/images/entities/char_2009.gif) 000 cycles. In the initial stage of cycles, ΔR/R0 exhibits a small downward trend, which is due to formation of some new pathways during the process.52,53 From the ΔR/R0 curves for 10
000 cycles. In the initial stage of cycles, ΔR/R0 exhibits a small downward trend, which is due to formation of some new pathways during the process.52,53 From the ΔR/R0 curves for 10![[thin space (1/6-em)]](https://www.rsc.org/images/entities/char_2009.gif) 000–10
000–10![[thin space (1/6-em)]](https://www.rsc.org/images/entities/char_2009.gif) 100 cycles and 19
100 cycles and 19![[thin space (1/6-em)]](https://www.rsc.org/images/entities/char_2009.gif) 950–20
950–20![[thin space (1/6-em)]](https://www.rsc.org/images/entities/char_2009.gif) 000 cycles, no apparent changes are seen to occur. The equilibrium state of the conductive network between destruction and reconstruction has been achieved after a period of self-adjustment, which demonstrates excellent durability. High cycling performance also means that the interfaces and dispersion of the GNPs are well maintained during the process.
000 cycles, no apparent changes are seen to occur. The equilibrium state of the conductive network between destruction and reconstruction has been achieved after a period of self-adjustment, which demonstrates excellent durability. High cycling performance also means that the interfaces and dispersion of the GNPs are well maintained during the process.
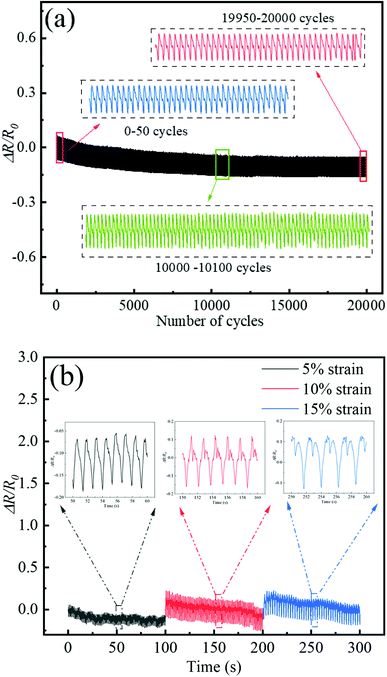 | ||
Fig. 6 Loading–unloading cycles: (a) 0–20![[thin space (1/6-em)]](https://www.rsc.org/images/entities/char_2009.gif) 000 cycles; with insets of 0–50 cycles, 10 000 cycles; with insets of 0–50 cycles, 10![[thin space (1/6-em)]](https://www.rsc.org/images/entities/char_2009.gif) 000–10 000–10![[thin space (1/6-em)]](https://www.rsc.org/images/entities/char_2009.gif) 100 cycles and 19,950–20,000 cycles. (b) Cycling tests at 5%, 10%, and 15% strain. 100 cycles and 19,950–20,000 cycles. (b) Cycling tests at 5%, 10%, and 15% strain. | ||
In order to further confirm the repeatability of the results of the 0.5 mm thick 0.1 wt% porous PDMS/GNP composite film sensor, the measurement of the loading–unloading cycles with different strains was carried out and the results are shown in Fig. 6(b). In these measurements, the different applied strains are 5%, 10% and 15%, and the stretching speed of the moving stage is set at 1 Hz. In the strain-applying process, the higher peaks of the relative resistance change at each strain-applying moment can be observed. When the applied strain is larger, the peak at the strain-applying moment is larger. With the increase of strain, a single waveform has a slight change, indicating that the internal conductive network has changed.
3.6 Application of the composite film sensor in tension monitoring
Damage detection and early warning of problems with structural components are important because they provide information for organizational maintenance, especially in civil engineering.54 To study whether a film sensor can be used for tension monitoring, a tensile test was carried out on standard aluminum alloy dumbbell parts (GBT228-2002) at room temperature. As shown in Fig. 7(a), a 0.5 mm thick 0.1 wt% porous PDMS/GNP composite film, a strain gauge, and a fiber Bragg grating were glued to the centers of the dumbbell parts being stretched using KH502 glue. Two identical copper wires were attached to the composite film by conductive adhesive tape and the other ends of the wires were connected to a FLUKE data acquisition system to simultaneously record the resistance change upon straining. The strain of the strain gauge was output by the resistance strain gauge (ASMB2). The wavelength variation of the fiber Bragg grating under strain change was obtained by fiber optic sensor extension modules (SA-10001218), which can be used to obtain measurements of strain:
 | (7) |
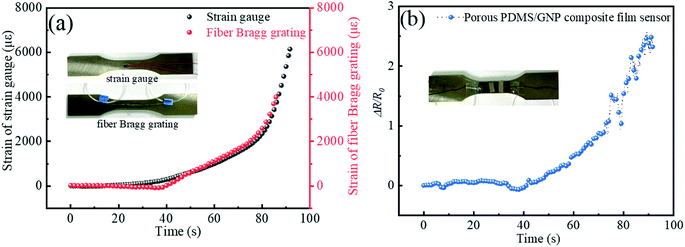 | ||
| Fig. 7 Tensile test in 90 s: (a) strain trends of the strain gauge and fiber Bragg grating; (b) ΔR/R0 of the porous PDMS/GNP composite film sensor. | ||
A signal modulation method is needed to convert the output data of the composite sensor into parameters that can directly reflect the deformation of the structural parts. Nonlinear models of the relative resistance change and strain are often complex and difficult to predict. Therefore, we trained the model based on the BP network algorithm to approximate the nonlinear mapping relationship of the flexible sensors with ‘MATLAB’ software. The neural network model consists of 1 input layer, 1 hidden layer and 1 output layer. The input layer is 1 neural unit, which represents the value of the relative resistance change, the hidden layer contains 4 neural units, and the output layer contains 1 neural unit, which is the strain value output by the strain gauge in the stretching process. It is assumed that the strain obtained from the strain gauge is the actual strain of the structural part, ignoring the error caused by bonding. In determining the transfer function, the tansig function and the purelin function were selected as the functions of the hidden layer and output layer, respectively. The tansig function is continuously differentiable and can be strictly calculated by the gradient method. However, the input and output values of the purelin function can be arbitrary. The trainlm function was selected as the training function. The sample data were divided into training samples and verification samples. The network model was trained and the data were preprocessed by normalization. The data were allowed to fall within the range of [0,1], and the objective predictive value of the BP neural network could be obtained by reverse normalization processing. In order to deduce a general pattern, and further optimize the BP neural network model, five flexible composite sensors with the same fraction of GNP were used for the experiments. Four groups of data were learned to obtain the best model, and one group was used for verification.
The verification results are shown in Fig. 8. The transformed strain signal of the composite material is coincident with the strain gauge data, and the accuracy of the model is proved. At a certain tensile speed, relatively accurate strain results can be obtained by directly substituting the initial resistance and time. In addition, when the flexible sensor exceeds the monitoring range of the strain gauge, the prediction can still continue after the strain gauge fails. At about 120 s, the part under tension approaches its yield limit. When the load environment of the specimen changes, multiple groups of experiments can be added to provide corresponding variables for more accurate results.
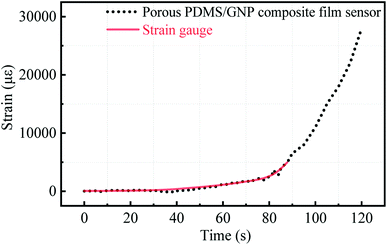 | ||
| Fig. 8 Strain prediction results by the BP neural network for the 0.5 mm thick 0.1 wt% porous PDMS/GNP composite film and the strain measured by the strain gauge. | ||
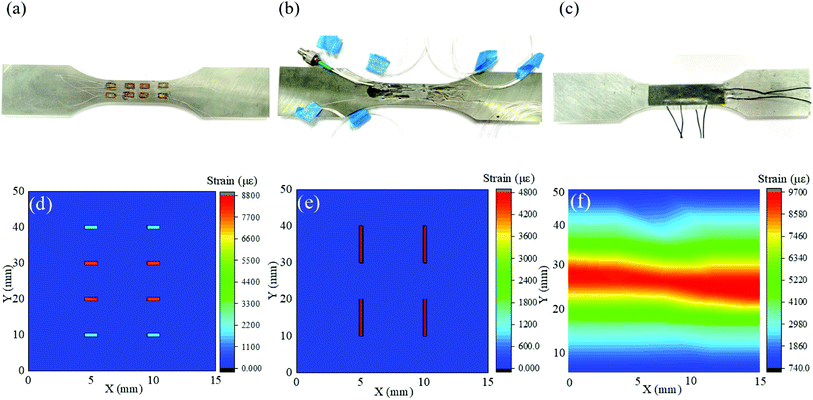
In order to further compare the monitoring results of the three sensors, the dumbbell parts were covered with the three sensors for the tensile tests. The strain grid coverage area of the strain gauge is 1 mm × 1 mm (a total of 8 are attached), the grating length of the fiber Bragg grating is 10 mm, and the diameter of the fiber is 125 μm (a total of 4 are attached), and the size of the film sensor is 15 mm × 50 mm (a total of 6 channels), as shown in Fig. 9(a–c). Stretching was carried out at a speed of 1 mm min−1. The monitoring results of the three sensors were recorded after stretching for 90 s, as shown in Fig. 9(d–f).
When the strain gauge is subjected to strain changes, the metal wire of the sensitive grid is stretched or compressed, and the resistance changes, which is converted into strain output by the resistance strain gauge. The monitoring area is very small and can be approximately regarded as “point” monitoring. Under strain, the grating spacing changes, and the output wavelength changes accordingly. According to its monitoring area, it can be regarded as “line” monitoring, which is mainly used for local damage identification. It is difficult to make an accurate evaluation for the overall safety of large and complex structures. For structural parts with a slightly larger volume, overall damage identification should be carried out first to determine the approximate location of the damage, and then the area narrowed down to localize the damage. The flexible strain sensor can completely cover the surface of complex structures, avoiding easy detachment and measurement errors caused by mismatching geometric shapes. Different from the first two sensors, although independent wires are set to form different monitoring channels, due to the large area and high-density complete sensor network inside, the two electrodes can monitor not only the area between the electrodes, but also the whole network. By inserting the output resistance change and initial resistance into the previously obtained BP neural network model and outputting the strain, the strain contours in the entire monitoring range can be obtained, which is in sharp contrast with the test results of the other two sensors, which verifies the field detection capability of the flexible strain sensor.
Finally, we compare the sensing performance of the porous PDMS/GNP composite film sensor with traditional hard sensors and recently reported stretchable strain sensors in Table 1.
| Type | Materials | Sensing mechanism | Stretchability (%) | Gauge factor | Response time (ms) |
|---|---|---|---|---|---|
| Composite film sensor | GNP–PDMS | Resistive | 200 | 2–1000 | 70 |
| Hard sensor | Strain gauge56 | — | 2 | 2–2.2 | — |
| Fiber Bragg grating57 | — | 0.5 | 1.2 | — | |
| Flexible sensor | GNP–PU58 | Resistive | 100 | 11–80 | 200 |
| GNP–PDMS59 | Capacitive | 80 | 0.98 | 180 | |
| MWCNTs–PDMS60 | Resistive | 40 | 3.89–7.22 | — | |
| CNTs–PDMS61 | Resistive | 44 | 0.4–22.6 | — | |
| CBs–PDMS62 | Resistive | 30 | 29.1 | — | |
| Self-healing polymer-AgNWs–PDMS63 | Resistive | 60 | 1.5 | — | |
| SiC–Ecoflex64 | Resistive | <5% | 247![[thin space (1/6-em)]](https://www.rsc.org/images/entities/char_2009.gif) 020.2 020.2 |
200 |
4 Conclusion
In summary, porous PDMS/GNP composite film sensors with good flexibility, high sensitivity and excellent durability have been fabricated through salt particle precipitation and the mechanical coating method. By integrating the BP neural network model, the signal of the composite sensor can be transformed into strain. Due to the excellent conductive network on the surface of interconnected pores within the film, the prepared porous PDMS/GNP composite film sensors have synchronously achieved high sensitivity (1–1000) under 65% strain, fast response (70 ms) under 10% strain at 60 mm min−1, and good durability (20![[thin space (1/6-em)]](https://www.rsc.org/images/entities/char_2009.gif) 000 cycles) under 5% strain at 1 Hz. The composite film sensors have also shown a high response to temperature. In addition, the composite film sensors can be customized to any size and shape, and can effectively respond to bending and torsion. Compared with strain gauges and fiber gratings through tensile tests, the composite film sensor shows the advantages of effective monitoring of large areas, a wider sensing range, and can be adapted to any shape, which provides a new direction for engineering health monitoring sensors.
000 cycles) under 5% strain at 1 Hz. The composite film sensors have also shown a high response to temperature. In addition, the composite film sensors can be customized to any size and shape, and can effectively respond to bending and torsion. Compared with strain gauges and fiber gratings through tensile tests, the composite film sensor shows the advantages of effective monitoring of large areas, a wider sensing range, and can be adapted to any shape, which provides a new direction for engineering health monitoring sensors.
Conflicts of interest
The authors declare no competing financial interest.References
- I. Lopez and N. Sarigul-Klijn, Prog. Aerosp. Sci., 2010, 46, 247–273 CrossRef.
- Y. Yu, X. Liu, J. Li and Y. Wang, Smart Mater. Struct., 2022, 31, 015033 CrossRef CAS.
- Y. J. Yan and L. H. Yam, Compos. Struct., 2002, 58, 29–38 CrossRef.
- P. Irving, E. M. Yu, Z. Xiang, G. Servetti, S. Williams, G. Moore, J. D. Santos and M. Pacchione, Control of Crack Growth Rates and Crack Trajectories for Enhanced Fail Safety and Damage Tolerance in Welded Aircraft Structures., Springer Netherlands, 2009, pp. 387–405 Search PubMed.
- L. I. Chen-Peng, Y. L. Yue, L. I. Yong-Zheng, Z. Wang, P. Y. Wei, X. P. Sun and C. Qin, Ship Science and Technology, 2019 Search PubMed.
- F. Yang, Int. J. Solids Struct., 2001, 38, 3813–3830 CrossRef.
- A. Turatsinze and A. Bascoul, Adv. Cem. Based Mater., 1996, 4, 77–92 CrossRef.
- K. Reincke, W. Grellmann and G. Heinrich, Engineering Fracture Mechanics for Crack Toughness Characterisation of Elastomers, Springer Netherlands, 2006, pp. 763–764 Search PubMed.
- F. Sun, R. Zhang and B. Blackman, Int. J. Solids Struct., 2021, 217–218, 60–73 CrossRef CAS.
- M. B. Rao, M. R. Bhat, C. Murthy, K. V. Madhav and S. Asokan, Structural Health Monitoring (SHM) Using Strain Gauges, PVDF Film and Fiber Bragg Grating (FBG) Sensors: A Comparative Study, Taylor & Francis Group, 2006 Search PubMed.
- S. K. T. Grattan, S. E. Taylor, S. Tong, P. Basheer and K. T. V. Grattan, IEEE Sens. J., 2009, 9, 1355–1360 Search PubMed.
- Y. Li, H. Wang, W. Cai, S. Li and Q. Zhang, Measurement, 2020, 153, 107449 CrossRef.
- P. M. Nellen, P. Anderegg, R. Broennimann and U. J. Sennhauser, Smart Mater. Struct., 1997, 3241, 77–86 Search PubMed.
- M. Borotto, E. D. Cais, M. Belloli, A. Bernasconi and S. Manzoni, Key Eng. Mater., 2011, 495, 53–57 Search PubMed.
- W. L. Schulz, E. Udd, J. M. Seim and G. E. Mcgill, Proc. SPIE-Int. Soc. Opt. Eng., 1998, 3325, 212–221 CrossRef.
- H. K. Kang, J. S. Park, D. H. Kang, C. U. Kim, H. J. Yoon, I. H. Cho, C. S. Hong and C. G. Kim, J. Korean Soc. Aeronaut. Space Sci., 2002, 11, 848 Search PubMed.
- A. Carpinteri, G. Lacidogna and N. Pugno, Eng. Fract. Mech., 2007, 74, 273–289 CrossRef.
- Y. G. Matvienko, I. E. Vasil'Ev, A. V. Pankov and M. A. Trusevich, Inorg. Mater., 2017, 53, 1484–1495 CrossRef CAS.
- C. Grosse, G. Mclaskey, S. Bachmaier, S. D. Glaser and M. Krüger, Proc. SPIE-Int. Soc. Opt. Eng., 2008, 6932, 693238 CrossRef.
- X. Cheng, C. Bao, X. Wang and W. Dong, Proc. Inst. Mech. Eng., Part L, 2020, 234, 496–503 CAS.
- M. Nie, Y. H. Xia and H. S. Yang, Cluster Computing, 2019, 22, 8217–8224 CrossRef.
- B. Ying, Q. Wu, J. Li and X. Liu, Mater. Horiz., 2020, 7, 477 RSC.
- S. Cheng, Y. S. Narang, C. Yang, Z. Suo and R. D. Howe, Adv. Mater. Interfaces, 2019, 6, 1900985 CrossRef.
- L. Yang, S. Chakrabartty, D. S. Gkinosatis, A. K. Mohanty and N. Lajnef, Agro-based micropore-structured ionic polymer sensor with enhanced ionic conduction and flexibility, Biomedical Circuits & Systems Conference IEEE, 2008, pp. 51–52 Search PubMed.
- M. Amjadi, A. Pichitpajongkit, S. Lee, S. Ryu and I. Park, ACS Nano, 2014, 8, 5154–5163 CrossRef CAS PubMed.
- Z. Xu, Z. Li, X. Tan and C. M. B. Holt, RSC Adv., 2012, 2, 2753–2755 RSC.
- A. B. Mohammed, B. Aissa and C. Alistair, Int. J. Low-Carbon Technol., 2022, 17, 622–629 CrossRef.
- C. A. Perez-Lopez, J. A. Perez-Taborda, C. Labre, J. M. Marmolejo-Tejada and A. Avila, Energy Rep., 2021, 7, 896–903 CrossRef.
- Z. Zeng, M. Liu, H. Xu, Y. Liao, F. Duan, L. M. Zhou, H. Jin, Z. Zhang and Z. Su, Carbon, 2017, 121, 490–501 CrossRef CAS.
- H. C. Jung, IEEE Trans. Biomed. Eng., 2012, 59, 1472–1479 Search PubMed.
- H. Ning, Y. Karube, Y. Cheng, Z. Masuda and H. Fukunaga, Acta Mater., 2008, 56, 2929–2936 CrossRef.
- P. Wang, H. Chen, N. Li, X. Zhang, S. Jiao, W.-L. Song and D. Fang, Energy Storage Mater., 2018, 13, 103–111 CrossRef.
- N. Jayaprakash, S. K. Das and L. A. Archer, Chem. Commun., 2011, 47, 12610 RSC.
- Q. Meng, Z. Liu, S. Han, L. Xu, S. Araby, R. Cai, Y. Zhao, S. Lu and T. Liu, J. Mater. Sci., 2019, 54, 10856–10870 CrossRef CAS.
- A. Qx, A. Sw, Z. A. Wei, A. Cs, X. B. Ling, B. Dy, Y. C. Ning, D. Kda, A. Cl and A. Cs, Compos. Commun., 2021, 26, 100809 CrossRef.
- B. X. Zou, G. You, L. Bo, Y. Yu and Y. Lu, RSC Adv., 2016, 6, 4483–4489 RSC.
- A. Vp, A. Sm and B. Ga, Sens. Actuators, A, 2021, 325, 112716 CrossRef.
- C. Wang, C. Xiong, B. Wang, H. Ming and R. S. Ruoff, ACS Nano, 2018, 12, 5816–5825 CrossRef CAS.
- B. Y. Lee, J. Kim, H. Kim, C. Kim and S. D. Lee, Sens. Actuators, A, 2016, 240, 103–109 CrossRef CAS.
- S. A. Gouda, X. Su, Q. Meng, C. H. Wang and J. Ma, Nanotechnology, 2019, 30, 385703 CrossRef PubMed.
- Q. Meng, H. C. Kuan, S. Araby, N. Kawashima, N. Saber, C. H. Wang and J. Ma, J. Mater. Sci., 2014, 49, 5838–5849 CrossRef CAS.
- Q. Meng, Y. Zhao, Z. Liu, S. Han and T. Liu, J. Appl. Polym. Sci., 2019, 136, 47906 CrossRef.
- W. C. Yu, J. Z. Xu, Z. G. Wang, Y. F. Huang, H. M. Yin, X. Ling, Y. W. Chen, D. X. Yan and Z. M. Li, Composites, Part A, 2018, 110, 237–245 CrossRef CAS.
- Y. Zhou, P. Zhan, M. Ren, G. Zheng, K. Dai, L. Mi, C. Liu and C. Shen, ACS Appl. Mater. Interfaces, 2019, 7, 7405–7414 CrossRef.
- H. S. Bedi, B. K. Billing and P. K. Agnihotri, Polym. Compos., 2020, 41, 2803–2815 CrossRef CAS.
- C. G. Zhou, W. J. Sun, L. C. Jia, L. Xu and Z. M. Li, ACS Appl. Mater. Interfaces, 2019, 11, 37094–37102 CrossRef CAS PubMed.
- S. Cheng and Z. Wu, Adv. Funct. Mater., 2011, 21, 2282–2290 CrossRef CAS.
- D. Cho, J. Park, J. Kim, T. Kim, J. Kim, I. Park and S. Jeon, ACS Appl. Mater. Interfaces, 2017, 9, 17369 CrossRef CAS PubMed.
- F. Yin, D. Ye, C. Zhu, L. Qiu and Y. Huang, Sensors, 2017, 17, 2677 CrossRef.
- T.-g. Sun, T. Zhu, G. Yang, L. Bian and J. Feng, Journal of Shandong Institute of Architecture and Engineering, 2006, 21, 82–85 Search PubMed.
- C. S. Park, K. I. Joo, S. W. Kang and H. R. Kim, J. Opt. Soc. Korea, 2011, 15, 329–334 CrossRef CAS.
- X. Li, T. Hua and B. Xu, Carbon, 2017, 118, 686–698 CrossRef CAS.
- K. C. Dao, Polym. Compos., 1982, 3, 12–17 CrossRef CAS.
- Y. Ding and A. Li, Earthq. Engin. Engin. Vib., 2007, 6, 289–294 CrossRef.
- A. D. Kersey, T. A. Berkoff and W. W. Morey, Opt. Lett., 1993, 18, 1370 CrossRef CAS PubMed.
- J. Gomez, J. Zubia, G. Aranguren, G. Durana and E. Hartl, Appl. Opt., 2008, 51–52 Search PubMed.
- Y. Zha, Y. Zhu, M. Yuan, J. Wang and S. Zhu, IEEE Photon. Technol. Lett., 2016, 28, 2573–2576 Search PubMed.
- J. Z. Gul, M. Sajid and K. H. Choi, J. Mater. Chem. C, 2019, 7, 4692–4701 RSC.
- C. Deng, L. Lan, P. He, C. Ding, B. Chen, W. Zheng, X. Zhao, W. Chen, X. Zhong and M. Li, J. Mater. Chem. C, 2020, 8, 5541–5546 RSC.
- T. Li, J. Li, A. Zhong, F. Han and Y. Jin, Sens. Actuators, A, 2020, 306, 111959 CrossRef CAS.
- C. Zhang, H. Li, A. Huang, Q. Zhang, K. Rui, H. Lin, G. Sun, J. Zhu, H. Peng and W. Huang, Small, 2019, 15, 1805493 CrossRef PubMed.
- N. Lu, C. Lu, S. Yang and J. Rogers, Adv. Funct. Mater., 2012, 22, 4044–4050 CrossRef CAS.
- D. Jiang, Y. Wang, B. Li, C. Sun, Z. Wu, H. Yan, L. Xing, S. Qi, Y. Li, H. Liu, W. Xie, X. Wang, T. Ding and Z. Guo, Macromol. Mater. Eng., 2019, 304, 1900074 CrossRef.
- Y. Gao, Q. Li, R. Wu, J. Sha, Y. Lu and F. Xuan, Adv. Funct. Mater., 2019, 29, 1806786 CrossRef.
| This journal is © The Royal Society of Chemistry 2022 |

