 Open Access Article
Microwave synthesis of upconverting nanoparticles with bis(2-ethylhexyl) adipate†
Ana Egatz-Gomez *ab,
Michaela Asher
 ab,
Rozabel Peterson
 ab,
Manuel A. Roldanc and
Alexandra Ros
 ab
ab
aSchool of Molecular Sciences, Arizona State University, Tempe, Arizona, USA. E-mail: angomez@asu.edu
bCenter for Applied Structural Discovery, Biodesign Institute, Arizona State University, Tempe, Arizona, USA
cJohn M. Cowley Center for High-Resolution Electron Microscopy, Arizona State University, Tempe, Arizona, USA
First published on 18th August 2022
Abstract
Despite efforts to develop effective upconverting nanoparticle (UCNP) synthesis methods, there is still a need for approaches that are accessible and up-scalable while reproducibly providing fine control of UCNP size, crystallinity, and luminescence. This work presents a one-pot microwave-assisted strategy for synthesizing NaYF4:Yb3+/Er3 UCNPs. A premixed rare earth (RE) solution in oleic acid (OA) was used to enhance repeatability while testing various synthesis conditions. The stock solution aliquots were mixed with OA and bis(2-ethylhexyl) adipate (BEHA), a polycarboxylic ester with a high boiling point, high thermal stability, and moderately polar character that facilitated rapid microwave heating at an average rate (room temperature to 300 °C) up to 60 °C min−1. Combinations of BEHA concentration and high-temperature reaction time were identified for consistently producing cubic and hexagonal UCNPs with narrow size distributions in the tens and hundreds of nanometers. After washing, the resulting UCNPs were dispersible in aqueous media without further processing. This straightforward, accessible, and repeatable microwave-assisted synthesis method holds potential for scaling up the production of UCNPs with well-defined size and crystallinity.
Introduction
Upconverting nanoparticles (UCNPs) are artificial materials that absorb low-energy photons in the infrared or near-infrared (NIR) range and emit high-energy photons in the UV-Vis range. This process was first observed by Auzel in 1966 in Yb–Er and Yb–Tm co-doped glasses,1 where the emission of a photon is the result of the sequential absorption of two or more low-energy photons followed by energy transfer between nearby lanthanide ions. Currently, research and industrial UCNP applications encompass areas as diverse as solar energy harvesting,2 photocatalysis,3 NIR-responsive drug delivery systems,4 photodynamic therapy,5 multimodal biological imaging,6–8 and sensing physical and chemical stimuli.9–12Since the physicochemical properties of UCNPs correlate with their geometrical parameters, well-defined nanoparticle characteristics such as size, shape, and crystallographic phase are crucial for achieving high luminescence efficiency and application performance.13 Although great effort has been made into developing effective nanocrystal synthesis methods,14–16 there is still a need for improved approaches that can consistently deliver well-defined particles while being feasible from the research to the pilot and industrial scales towards future applications.2,3,17–22 The two most common UCNP synthesis methods are the wet chemical hot-injection and heat-up strategies. During hot injection, a precursor solution is swiftly injected into a hot mixture of a surfactant and a high boiling point solvent to achieve a short, controlled nanoparticle nucleation event. Hot injection leads to highly homogeneous nanoparticle distributions. Still, it can hardly be scaled up due to the inherent difficulty of maintaining the reaction temperature and mixing the precursor upon injection.17–20 On the other hand, heat-up (non-injection) methods are regarded as reliable and reproducible means to achieve nanomaterials on larger scales, however, at the expense of widening the nanoparticle size distributions because the reaction temperature increases gradually over time.23–25
The advantage of microwave heating in nanoparticle synthesis is that microwave energy can be used to achieve rapid, homogeneous volumetric heating on a typical laboratory scale.26,27 Since heat can be very rapidly and uniformly generated within the reaction mixture and elevated temperatures can be reached in only a few minutes, microwave-assisted nanocrystal synthesis can combine the benefits of both the heat-up and the hot injection methods. Moreover, efficient microwave heating combined with flow synthesis has been proposed for the mass production of nanomaterials.26 Still, there are particular challenges in microwave-assisted synthesis that need to be solved,26–28 starting with the fact that only reactants and solvents that efficiently absorb and convert microwave energy into heat can be used. Difficulties also arise from reaction conditions. For example, to promote the transition of NaYF4 UCNPs from the cubic to the more thermodynamically stable and luminescent hexagonal phase, the application of very high temperatures (300 °C or more) for long times (up to one or two hours) is required, conditions that the reactor must withstand. Moreover, rapid microwave heating necessitates accurate temperature monitoring to achieve fast-responding power control. However, it is impossible to place any temperature and pressure sensors that bare metallic components inside the reactor cavity because of their potential interaction with microwaves and antenna effect. Temperature is thus measured directly using optical fibers or non-contact infrared sensors, the problem of the former, being fragile, and the latter, giving inaccurate measurements.26–28
Microwave-assisted methods have been used to synthesize UCNPs with different crystal hosts such as NaYF4 (ref. 29–35) NaGdF4,25,36–39 and other matrices40–47 via the hydrothermal and solvothermal routes. Examples of the microwave-assisted hydrothermal route for producing UCNPs capped with hydrophilic ligands include syntheses using polar solvents such as ethanol,38 ethylene glycol (EG),30,31,37,42,43,45 and ionic liquids,30,45 and chelating surfactants such as and acetic acid,35,47 trisodium citrate,46 polyethylenimine (PEI),37,43 polyvinylpyrrolidone (PVP),42 and EDTA.33,34 With the boiling point of these solvents being relatively low, most of these syntheses were carried out in pressurized closed vessels to achieve the high energy required for nanocrystal formation. The main limitation of microwave-heated pressurized containers is that only indirect measurement of the actual reaction internal temperature is possible, which is detrimental to reproducibility.18
UCNPs have also been synthesized via the microwave-assisted solvothermal route.25,29,36,38–41 These syntheses were carried out with the same high boiling point organic solvents typically used with conventional heating, i.e., oleic acid (OA), oleylamine (OM), and 1-octadecene (OD), at temperatures around 300 °C and higher. With the minimal capacity of these solvents to convert microwave energy into heat, the application of the solvothermal route using laboratory microwave reactors was limited to reaction volumes of only a few milliliters since only relatively small vials may receive or adsorb significant power.48
Instead of the non-polar solvents ubiquitous in solvothermal methods with conventional heating, we used a low-cost polycarboxylic acid ester, bis(2-ethylhexyl) adipate (BEHA). Its high boiling point, temperature stability, solubility in most organic solvents, and adequate polar and microwave absorbing characteristics make BEHA a good candidate for UCNP synthesis. This work presents a simple and reproducible strategy for the microwave-assisted synthesis of NaYF4:Yb3+/Er3 UCNPs by thermal decomposition of acetate and trifluoroacetate precursors in a mixture of BEHA and OA. We implemented solutions to common challenges in microwave-assisted inorganic nanocrystal synthesis, explored a comprehensive set of synthesis conditions that produce UCNPs, and demonstrated fine-tuning the size and crystallinity of highly homogeneous UCNPs.
Results and discussion
The geometrical parameters size, shape, and crystallinity are closely related to UCNP properties such as emission efficiency and chemical stability.13 For the successful implementation of UCNP applications, the synthesis method must reproducibly provide nanoparticles with well-defined characteristics. In addition to reproducibility, production up-scaling potential is an essential benefit for synthesis methods initially developed at the laboratory scale.Our strategy combines the reproducibility and potential scalability of the heat-up methods with the narrow particle size distributions of the precursor injection-based methods. It consists of a microwave-assisted heat-up approach using an OA![[thin space (1/6-em)]](https://www.rsc.org/images/entities/char_2009.gif) :
:![[thin space (1/6-em)]](https://www.rsc.org/images/entities/char_2009.gif) BEHA mixture, where the high temperature required for UCNP crystallization can be reached in minutes thanks to the BEHA's good microwave-absorbing properties. A wide range of synthesis conditions and the resulting UCNP characteristics were explored. Nanoparticles were synthesized in OA
BEHA mixture, where the high temperature required for UCNP crystallization can be reached in minutes thanks to the BEHA's good microwave-absorbing properties. A wide range of synthesis conditions and the resulting UCNP characteristics were explored. Nanoparticles were synthesized in OA![[thin space (1/6-em)]](https://www.rsc.org/images/entities/char_2009.gif) :
:![[thin space (1/6-em)]](https://www.rsc.org/images/entities/char_2009.gif) BEHA with BEHA concentrations from 20 to 91.7% v/v (Table 1) and high temperature (300 °C) residence times from 5 to 60 minutes. A concentrated stock rare-earth (RE) precursor solution was prepared to facilitate the synthesis workflow. Stabilizing the stock solution for at least two hours after being prepared was found to be a prerequisite for consistent and repeatable heating rates. After the initial stabilization, the stock solution was stored and used for up to 6 months. Aliquots of the stock solution were used to tune the size and crystalline phase of the resulting UCNPs by varying the BEHA concentrations and high-temperature (HT) residence times. Conditions favorable for the synthesis of UCNPs with cubic and hexagonal crystalline phases and tunable narrow size distributions were found. Despite the synthesis being performed in organic solvents, after washes, the resulting nanoparticles had a hydrophilic character and could be dispersed in aqueous solutions.
BEHA with BEHA concentrations from 20 to 91.7% v/v (Table 1) and high temperature (300 °C) residence times from 5 to 60 minutes. A concentrated stock rare-earth (RE) precursor solution was prepared to facilitate the synthesis workflow. Stabilizing the stock solution for at least two hours after being prepared was found to be a prerequisite for consistent and repeatable heating rates. After the initial stabilization, the stock solution was stored and used for up to 6 months. Aliquots of the stock solution were used to tune the size and crystalline phase of the resulting UCNPs by varying the BEHA concentrations and high-temperature (HT) residence times. Conditions favorable for the synthesis of UCNPs with cubic and hexagonal crystalline phases and tunable narrow size distributions were found. Despite the synthesis being performed in organic solvents, after washes, the resulting nanoparticles had a hydrophilic character and could be dispersed in aqueous solutions.
| Name | OA (% v/v) | BEHA (% v/v) | RE (mM) |
|---|---|---|---|
| S20-8.3 | 80.0 | 20.0 | 8.3 |
| S50-8.3 | 50.0 | 50.0 | 8.3 |
| S65-8.3 | 35.0 | 65.0 | 8.3 |
| S83-8.3 | 16.7 | 83.3 | 8.3 |
| S91-8.3 | 8.3 | 91.7 | 8.3 |
| S91-6.7 | 8.3 | 91.7 | 6.7 |
Addressing technical challenges in microwave-assisted UCNP synthesis
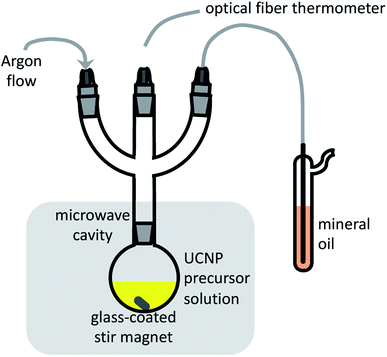
The performance of microwave-assisted nanoparticle synthesis depends on several non-trivial practical aspects.49–52 Efficient mixing is essential to prevent a non-uniform temperature distribution within the reaction that arises when the sample is irradiated by microwaves at one point rather than over the whole volume, and because of the limited microwave penetration depth in different media. In addition, reliable and fast temperature monitoring is required for reactor power control during fast heating. Conventional immersion thermometers and thermocouples cannot be used because they couple with the microwaves. For our application, the reactor built-in, non-contact, IR temperature sensor, located below the microwave cavity floor for probing the reaction flask wall temperature, did not provide sufficient speed, dynamic range, linearity, stability, and reproducibility. We, therefore, used an immersion optical fiber sensor with a custom protective glass sleeve for long-term heat resistance and improved mechanical stability, which provided many rounds of UCNP synthesis at 300 °C with durations from 5 to 60 minutes. An additional consideration is whether to use an open or a pressurized vessel. The disadvantage of a pressurized setup in laboratory reactors is that the production of gas species can rapidly increase the reaction pressure above the maximum operating pressure (20 bar in most cases) and halt the reaction. Pressure variations can also be induced by differences in the thermal stability of the lanthanide precursors, in detriment to batch-to-batch reproducibility.39 To avoid pressure variations, we run our syntheses in a standard non-pressurized round-bottom flask under a gentle Ar flow. A schematic representation of our setup is shown in Fig. 1.Microwave friendly reagents
The choice of a solvent is crucial for the outcome of microwave-assisted organic synthesis reactions. The solvent must be able to convert microwave energy into heat. Since the NaYF4 UCNP transition from the cubic to the hexagonal phase requires very high temperatures, a boiling point above 300 °C, and high stability and low reactivity at high temperatures are essential solvent features. The solvent also needs to be miscible with OA, the most common capping agent for regulating the shape and growth of UCNPs. These conditions are met by several low-cost polycarboxylic acid esters that are widely used to impart flexibility to polyvinyl chloride (PVC) and in cosmetics, such as di-n-butyl phthalate (DBP) and bis(2-ethylhexyl) adipate (BEHA).53–56 In our preliminary experiments with OA![[thin space (1/6-em)]](https://www.rsc.org/images/entities/char_2009.gif) :
:![[thin space (1/6-em)]](https://www.rsc.org/images/entities/char_2009.gif) DBP mixtures, the resulting UCNPs were tightly embedded within an organic matrix that persisted after nanoparticle washing steps (not shown). The OA
DBP mixtures, the resulting UCNPs were tightly embedded within an organic matrix that persisted after nanoparticle washing steps (not shown). The OA![[thin space (1/6-em)]](https://www.rsc.org/images/entities/char_2009.gif) :
:![[thin space (1/6-em)]](https://www.rsc.org/images/entities/char_2009.gif) BEHA mixtures used in this work (Table 1) were heated from room temperature to 300 °C in a few minutes and after washes, provided UCNPs dispersible in aqueous media.
BEHA mixtures used in this work (Table 1) were heated from room temperature to 300 °C in a few minutes and after washes, provided UCNPs dispersible in aqueous media.
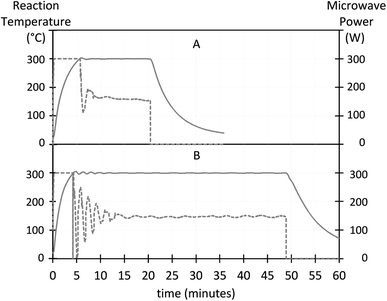
The evolution of the reaction temperature and the applied microwave power during UCNP synthesis is shown in Fig. 2. The heating rate increased with the BEHA concentration. For a 30 ml reaction, the average 100-to-300 °C heating rate increased from approximately 41 °C min−1 for 20% v/v BEHA (Fig. 2A) to 56 °C min−1 for 91.7% v/v BEHA (Fig. 2B). The reactor ran at its maximum constant power (300 W) until the reaction reached 300 °C, and then switched to constant temperature mode with power control. At the end of the HT step, forced air circulation rapidly lowered the temperature to below 200 °C in approximately 2 to 3 minutes and quenched the reaction.
The ability of a solvent to convert electromagnetic energy into heat, i.e., how fast it can be heated by microwaves, can be represented by its loss tangent, tan![[thin space (1/6-em)]](https://www.rsc.org/images/entities/char_2009.gif) δ = ε′/ε′′, where the dielectric loss, ε′′, indicates the efficiency with which electromagnetic radiation is converted into heat, and the dielectric constant, ε′, describes the polarizability of molecules in the electric field.57,58 However, choosing a solvent for microwave-assisted synthesis is not always straightforward because the dielectric properties within a full range of temperatures and microwave frequencies are often unavailable for many solvents, including BEHA. For that reason, we have investigated the topological polar surface area (TPSA), a widely available descriptor of the overall polar area of a molecule related to the dielectric permittivity,59 as an alternative molecular descriptor to evaluate the microwave-absorbing properties of a liquid. Table 2 shows the boiling point, experimental values for ε′, ε′′, and tan
δ = ε′/ε′′, where the dielectric loss, ε′′, indicates the efficiency with which electromagnetic radiation is converted into heat, and the dielectric constant, ε′, describes the polarizability of molecules in the electric field.57,58 However, choosing a solvent for microwave-assisted synthesis is not always straightforward because the dielectric properties within a full range of temperatures and microwave frequencies are often unavailable for many solvents, including BEHA. For that reason, we have investigated the topological polar surface area (TPSA), a widely available descriptor of the overall polar area of a molecule related to the dielectric permittivity,59 as an alternative molecular descriptor to evaluate the microwave-absorbing properties of a liquid. Table 2 shows the boiling point, experimental values for ε′, ε′′, and tan![[thin space (1/6-em)]](https://www.rsc.org/images/entities/char_2009.gif) δ at room temperature and 2.45 GHz, and TPSA for some of the solvents in UCNP microwave synthesis and also for di-n-butyl phthalate (DBP), a carboxylic ester we used in preliminary experiments. By dividing the TPSA by the solvent molecular weight (MW), we obtained a rough estimate of the polar density of the molecule. The correlation of the TPSA/MW ratio to tan
δ at room temperature and 2.45 GHz, and TPSA for some of the solvents in UCNP microwave synthesis and also for di-n-butyl phthalate (DBP), a carboxylic ester we used in preliminary experiments. By dividing the TPSA by the solvent molecular weight (MW), we obtained a rough estimate of the polar density of the molecule. The correlation of the TPSA/MW ratio to tan![[thin space (1/6-em)]](https://www.rsc.org/images/entities/char_2009.gif) δ (Fig. 3) suggests that this ratio can be used as an indicator of the suitability of a solvent to convert microwave energy into heat in the absence of more detailed characterization data. The linear correlation trend allowed us to predict a tan
δ (Fig. 3) suggests that this ratio can be used as an indicator of the suitability of a solvent to convert microwave energy into heat in the absence of more detailed characterization data. The linear correlation trend allowed us to predict a tan![[thin space (1/6-em)]](https://www.rsc.org/images/entities/char_2009.gif) δ for BEHA that positions it within the moderately good microwave absorbers group,60 in agreement with the fast heating rates we observed, up to 60 °C min−1. A final consideration for solvents in microwave synthesis is good stability at high temperatures without generating unstable, reactive decomposition products, which BEHA fulfills.61
δ for BEHA that positions it within the moderately good microwave absorbers group,60 in agreement with the fast heating rates we observed, up to 60 °C min−1. A final consideration for solvents in microwave synthesis is good stability at high temperatures without generating unstable, reactive decomposition products, which BEHA fulfills.61
![[thin space (1/6-em)]](https://www.rsc.org/images/entities/char_2009.gif) δ; topological polar surface area, TPSA; molecular weight, MW; OD, octadecene; OA, oleic acid; DBP, di-n-butyl phthalate; BEHA, bis(2-ethylhexyl) adipate; EG, ethylene glycol
δ; topological polar surface area, TPSA; molecular weight, MW; OD, octadecene; OA, oleic acid; DBP, di-n-butyl phthalate; BEHA, bis(2-ethylhexyl) adipate; EG, ethylene glycol
| Solvent | BP (°C) | ε′ | ε′′ | tan![[thin space (1/6-em)]](https://www.rsc.org/images/entities/char_2009.gif) δ δ |
TPSA (Å2)62 | TPSA/MW |
|---|---|---|---|---|---|---|
| OD | 315 | 2 (ref. 63) | 0.0005 (ref. 63) | 0 | 0.000 | |
| OA | 360 | 2 (ref. 64) | 0.012 (ref. 64) | 37.3 | 0.132 | |
| BEHA | 410 | 4–6 (ref. 54) | 52.6 | 0.142 | ||
| DBP | 340 | 6 (ref. 65 and 66) | 0.9 (ref. 65 and 66) | 52.6 | 0.189 | |
| EG | 197.3 | 1.350 (ref. 60) | 40.5 | 0.652 | ||
| Ethanol | 78.4 | 0.941 (ref. 60) | 20.2 | 0.438 | ||
| Isopropanol | 82.5 | 0.7 | 20.2 | 0.337 | ||
| Water | 100 | 0.123 (ref. 60) | 1 | 0.056 |
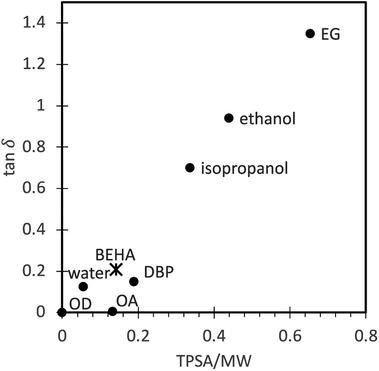 | ||
Fig. 3 Correlation between the experimental loss tangent (tan![[thin space (1/6-em)]](https://www.rsc.org/images/entities/char_2009.gif) δ) and the topological polar surface area/molecular weight (TPSA/MW) ratio (dots, experimental values reported in the literature, see Table 2; asterisk, predicted value). A linear trend model allows us to predict the BEHA loss tangent corresponding to the group of moderately good microwave absorbers. OD, octadecene; OA, oleic acid; DBP, di-n-butyl phthalate; BEHA, bis(2-ethylhexyl) adipate; EG, ethylene glycol. δ) and the topological polar surface area/molecular weight (TPSA/MW) ratio (dots, experimental values reported in the literature, see Table 2; asterisk, predicted value). A linear trend model allows us to predict the BEHA loss tangent corresponding to the group of moderately good microwave absorbers. OD, octadecene; OA, oleic acid; DBP, di-n-butyl phthalate; BEHA, bis(2-ethylhexyl) adipate; EG, ethylene glycol. | ||
Effect of the heat-up strategy on the reaction heating rate
We used a concentrated RE precursor stock solution that can be stored for a few months to facilitate the synthesis workflow, improve repeatability, and compare different conditions by minimizing potential variations in reagent amounts between batches. We found that a prerequisite for repeatable heating rates is to allow the RE stock precursor solution to stabilize for around 2 hours after being prepared.Several different heat-up programs were tested in early experiments. Initially, we ran a one-pot method (ESI Preliminary method 1†), where the precursor salts were mixed with 30 ml of solvent at room temperature and run through a 2-step microwave program consisting of 110 °C for 10 minutes, followed by 300 °C for variable times. We then observed an unexpected endothermic dip in the reaction temperature despite applying constant, maximum microwave power. For this preliminary method, the overall heating rate was rather low. Taking into account the time required for the temperature to stabilize past the endothermic dip, the 100-to-300 °C heating rate was 10 °C min−1 (Fig. S1†). The endothermic dip was also observed with a modified strategy consisting of a 2-pot method (ESI Preliminary method 2†). In this second preliminary method, the precursor salts were mixed with 60 ml of solvent at room temperature at their final concentrations and heated at 110 °C for 10 minutes. The resulting precursor solution was immediately split into three 20 ml aliquots, and the aliquots were successively run at 300 °C for variable times. Fig. 4 shows the temperature and power evolution for these three aliquots. The first aliquot (Fig. 4A) was run immediately after making the precursor solution, and the subsequent batches were run consecutively one after the other (Fig. 4B and C), roughly 65 and 40 minutes after finalizing the precursor solution, respectively. Over time, the temperature dip appeared less pronounced, and the time until temperature stabilization at 300 °C decreased. For the successive aliquots, the 100-to-300 °C heating rate increased from 4 (Fig. 4A) to 28 °C min−1 (Fig. 4C). These results suggest that the precursor solution stabilizes over time. A similar endothermic drop has been recently reported during both heating-up and hot-injection synthesis of cobalt nanoparticles.67 The temperature dip may be attributed to a combination of endothermic processes such as precursor nucleation67 and the thermal decomposition of OA.68
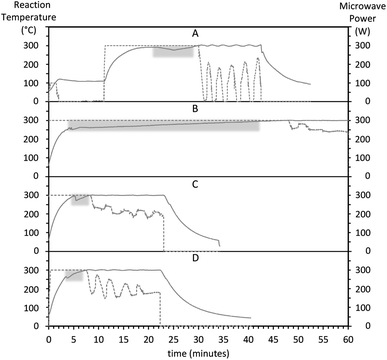 | ||
| Fig. 4 Evolution of the reaction temperature (left axis, solid line) and microwave power (right axis, dotted line) for non-optimized preliminary synthesis methods 1 (A) and 2 (B–D). The endothermic dips while applying a constant power of 300 W are emphasized with a gray background. After the reaction stabilizes at 300 °C, the reactor control switches from constant power to power regulation to maintain a constant temperature. Heating rates correspond to a temperature rise from 100 to 300 °C, past the endothermic dip. (A) A one-pot method (ESI Preliminary method 1†) where precursors and 30 ml of solvent were mixed at their final concentration and volume at room temperature and run through a 2-step heating program for precursor dissolution and nanoparticle formation. Heating rate, 10 °C min−1. (B–D) A 2-pot method (ESI “Preliminary method 2”†) where first, a larger volume of precursor solution was prepared at 100 °C (not shown), and second, aliquots of the precursor solution were successively run. (A) First aliquot, ran immediately after the precursor solution, 4 °C min−1. (C) Second aliquot, ran approximately 65 minutes after the precursor solution, 24 °C min−1. (D) Third aliquot, ran approximately 100 minutes after making the precursor solution, 28 °C min−1. | ||
The problem with the appearance of an endothermic dip is that it can prevent an accurate account of the reaction time and prevent fast heating by the microwaves. This issue was overcome by preparing a concentrated stock 100 mM RE precursor solution and allowing it to stabilize at ambient conditions for 2 hours or longer before running any HT synthesis step. After stabilization we stored and used the same RE stock solution over several months, which provided fast, repeatable 100-to-300 °C heating rates up to 56 °C min−1 as mentioned.
Tuning UCNP crystallinity and size with BEHA concentration and HT residence time
Among the most efficient upconversion systems is NaYF4:Yb3+/Er3. It can occur in the cubic (α) and the hexagonal (β) crystalline phases, each with different luminescence characteristics. Many different strategies with various degrees of complexity have been used to control UCNP size and crystallinity. Examples of these strategies include using additional dopants, carefully selected surfactants, relative ratios of elemental components outside of the desired product stoichiometric proportions, and different reaction temperatures.14,36 In this work, we studied the effect of varying the HT residence time, and the BEHA and RE concentration. UCNP morphology, size, and crystallinity were investigated by XRD and TEM for nanoparticle batches using HT residence times from 5 to 60 minutes, BEHA concentrations from 20 to 91.7% v/v, and a RE concentration of 8.3 mM. In addition, a series of batches with a lower 6.4 mM RE concentration and 91.7% BEHA were also synthesized using 5 to 60 minute HT times (Table 1). Succinctly, higher BEHA concentrations lead to an earlier α-to-β transition and larger average UCNP size, over time producing a bimodal size distribution of particles, as summarized in Fig. 5. Within each mode, the UCNPs are highly monodisperse. The polydispersity index, PdI = (σ/μ)2, where σ and μ are the sample standard deviation and mean, ranges from 0.01 to 0.05 for the UCNPs of this work. Such PdI values are generally considered indicative of a highly homogeneous population.69 The evolution of UCNP crystallinity and size is discussed in detail in the following paragraphs and figures.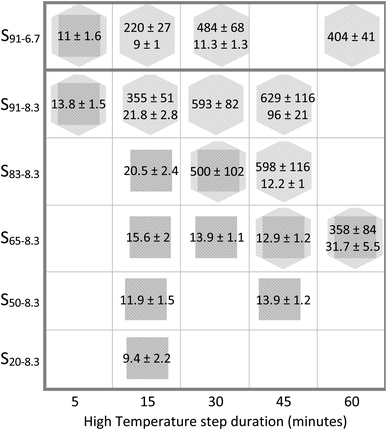 | ||
| Fig. 5 Summary of UCNP size (mean ± standard deviation in nanometers) and crystallinity resulting from the entire parameter space tested. The first and second subscripts on each UCNP batch name indicate the BEHA and RE concentration in the UCNP synthesis solution (see Table 1). Conditions with two measurements correspond to bimodal distributions, where both small nuclei and large particles were observed in TEM images. The crystalline phase from XRD measurements is represented by a square for cubic phase (α), a square inscribed in a hexagon for mixed cubic and hexagonal phases, and a hexagon for pure hexagonal phase (β). | ||
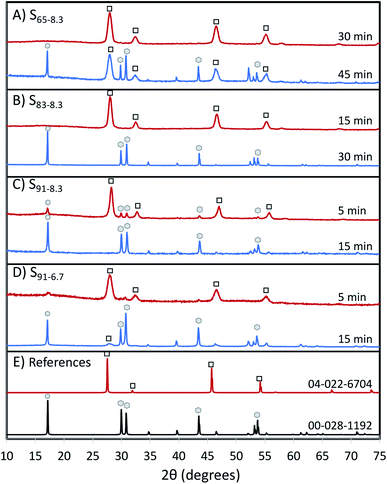
The UCNP crystalline phase evolves from α to β as the BEHA concentration and the HT step duration increase; the higher the BEHA concentration, the shorter the residence time at the high temperature required for the transition. Fig. 6 illustrates XRD patterns from samples before (top traces) and after (bottom traces) the α-to-β phase transition, for increasing BEHA concentrations of 65 (A), 83.3 (B), and 91.7 (C and D) % v/v. As the BEHA concentration increased, the α-to-β transition required shorter high-temperature incubation times. The phase transition was shortened from 45 minutes to 5 minutes for a BEHA increase from at 65 to 91.7% (Fig. 6A, C and D). UCNPs synthesized using lower, 20 to 50% v/v BEHA, remained in the α phase after 45 minutes of incubation at 300 °C (Fig. S1†). We observed a shift in the alpha patterns towards high diffraction angles relative to the reference pattern. This shift suggests a lattice contraction, possibly attributed to the dopant concentration in our samples being lower than in the reference patterns 04-022-6704 (cubic Na(Y0.78Yb0.2Er0.02)F4) and 00-028-1192 (hexagonal Na(Y0.57Yb0.39Er0.04)F4). The shift is not noticeable beta patterns, which may be due to the more dense hexagonal packing being less affected by the dopant concentration. A set of XRD patterns corresponding to all the investigated experimental conditions is shown in Fig. S1.†
Within the explored parameter space, we found a few synthesis conditions that yield UCNPs with unimodal, narrow size distribution and a single crystalline phase. The lowest BEHA concentrations produced the smallest particles, as expected due to the larger concentration of OA, which limits nanoparticle growth. Longer HT times and larger BEHA concentrations promoted the formation of β-UCNPs, particle agglomeration, and bimodal size distributions. The complete set of electron microscopy images and size distributions for all the experimental conditions are shown in Fig. S2 and S3.†
Pure α-phase UCNPs with a narrow unimodal size distribution were synthesized using a 15 minute HT step and increasing BEHA concentrations (Fig. 7). These α-UCNPs grew from spherical to irregular spheroids with an average diameter from 9.4 ± 2.2 nm to 20.5 ± 2.4 nm, fine-tuned using 20 to 83.3% v/v BEHA. Producing β-UCNPs with unimodal distributions was accomplished with a few HT duration and BEHA concentration combinations. For example, a 15 minute HT step with a 91.7% v/v BEHA concentration produced β-UCNPs with an average diameter of 21.8 ± 2.8; however, a few particles with an average diameter of 355 ± 55 nm were also observed in electron microscopy images (Fig. S4†). A 45 minute HT with 65% BEHA (S65-8.3) produced a unimodal distribution of 12.9 ± 1.2 nm UCNPs with mixed α and β phases. A 60 minute HT with 91.7 BEHA and a reduced RE concentration (S91-6.7) produced a unimodal distribution of 404 ± 41 nm β-UCNPs (Fig. S2 and S3†). These results demonstrate the possibility of further tuning the average size of β-UCNPs over a continuous range with future optimization of the synthesis parameters.
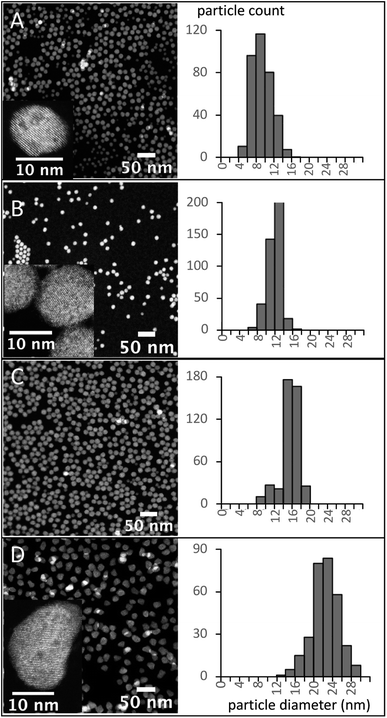
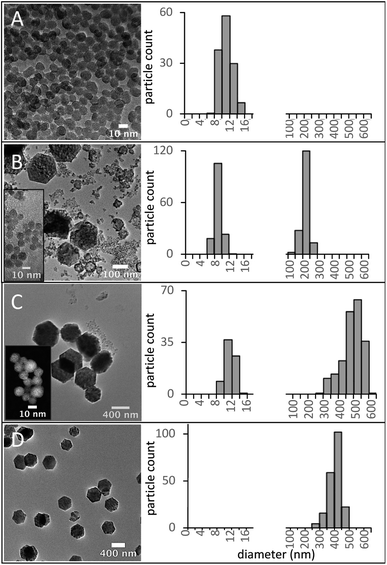
The RE concentration in the precursor solution is another factor that influences the size and phase of the UNCPs. The effect of a reduction in the RE concentration from 8.3 to 6.7 mM was investigated. A series of samples with 6.7 mM RE and 91.7% BEHA (S91-6.7) was synthesized using HT residence times from 5 to 60 minutes. The size evolution of these UCNPs is shown in Fig. 8, along with the corresponding diameter measurement distributions. Small nuclei were formed after 5 minutes (Fig. 8A). A bimodal distribution with larger hexagonal UCNPs and remaining small nuclei was observed for the 15- and the 30 minute HT steps (Fig. 8B and C). After a 60 minute HT step, the small nuclei were no longer observed, suggesting they were entirely incorporated into the large hexagonal particles (Fig. 8D). Further tuning of the UCNP size over a may be achieved through optimization of the synthesis parameters we have initially explored in this work, e.g., using smaller RE and intermediate BEHA concentrations and HT times, or alternatively, through a post-treatment at high temperature to promote the dissolution of the small UCNP nuclei as demonstrated in previous work.8,21
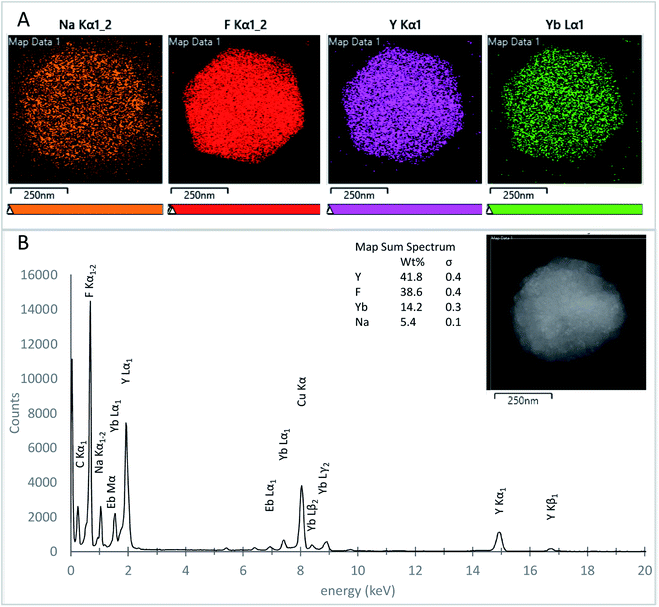
The atomic elemental composition mapping of the UCNPs was investigated using TEM EDS on samples S65-8.3 60 minutes, and S91.7-6.4 30 minutes, over both small and large UCNPs. Fig. 9A shows the EDS atomic distribution maps for a nanoparticle with an approximate diameter of 500 nm (inset) from the S91.7-6.4 60 minute UCNP batch. The elementary distribution maps were obtained from the EDS signal corresponding to Na Kα1 (orange), F Kα1 (red), Y Kα1 (purple), and Yb Lα1 (green) peaks. Fig. 9B shows the EDS spectrum corresponding to the entire 500 nm particle (inset) and the corresponding weight percent (wt%) elemental quantification. All the expected elements Na, Y, F, Yb, and Eb were confirmed and found similarly distributed for the particles analyzed. For each of the elements, we calculated the atomic percentage, A% = wt%/MW, and the atomic ratio nRE = A%/(A% Y + A% Yb + A% Er), where wt% is the elemental weight percentage (Fig. 9A), and MW is the molecular weight. The atomic ratio nRE for the measured samples ranged from 0.77 to 0.85 for Y, 0.23 to 0.16 for Y, and 3.91 to 4.26 for F, in agreement with the expected composition of the UCNPs based on the reaction stoichiometry. For Na, nRE ranged from 0.21 to 0.79. This lower than the expected unity value is perhaps due to the lower sensitivity of EDS for low atomic number elements, or vacancies in the crystal structure originated from nanoparticle washing.70
Luminescence
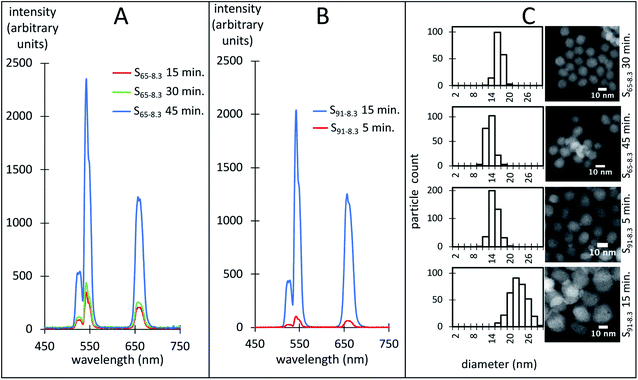
It is well established that the luminescence of hexagonal (β) NaYF4 UCNPs is around one order of magnitude larger than the cubic phase (α) UCNPs.31,32 The luminescence is also more intense for dispersions of large UCNPs compared to smaller ones because the difference in luminescence quenching at the nanoparticle surface.71 Fig. 10 shows exemplary luminescence characteristic spectra of dispersions of UCNPs with similar size distributions (Fig. 10C). Measured by its peak intensity at 542 nm, the luminescence of the S65-8.3 UCNPs was enhanced approximately 8 times as they transitioned from a pure α to a mixed α-β crystalline phase (Fig. 10A). The luminescence of the S91-8.3 UCNPs was enhanced 18 times as they transitioned from a mixed α–β to a pure β crystalline phase (Fig. 10B). The S65-8.3 45 minute and the S91-8.3 5 minute samples, with an α–β mixed phase and comparable in size, exhibit a very different luminescence intensity, which may be attributed to differences in crystalline phase. While the α and β peak intensities are comparable in the S65-8.3 45 minute XRD pattern (Fig. 6A, blue trace), the β peaks are barely noticeable in the S91-8.3 5 minute XRD pattern (Fig. 6C, red trace), which explains the difference between the luminescence of these two samples.BEHA as a stripping ligand
Typically, OA is used in UCNP synthesis to solubilize the reactants and provides oleate capping ligands that limit nanoparticle growth and aggregation while rendering them hydrophobic. Using OA![[thin space (1/6-em)]](https://www.rsc.org/images/entities/char_2009.gif) :
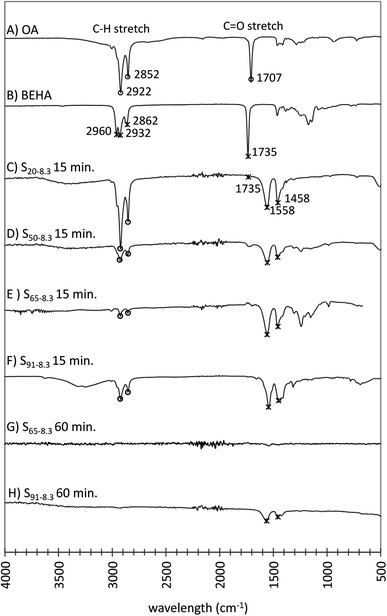
:![[thin space (1/6-em)]](https://www.rsc.org/images/entities/char_2009.gif) BEHA mixtures, the resulting UCNPs became dispersible in aqueous media as the BEHA concentration and HT duration increased. The UCNP surface ligands for increasing BEHA (Fig. 11A–F) and HT time (Fig. 11G, H and S6†) were investigated using Fourier transform infrared-attenuated reflectance spectroscopy (FTIR-ATR). The OA and BEHA traces exhibit characteristic peaks corresponding to the C–H and the C
BEHA mixtures, the resulting UCNPs became dispersible in aqueous media as the BEHA concentration and HT duration increased. The UCNP surface ligands for increasing BEHA (Fig. 11A–F) and HT time (Fig. 11G, H and S6†) were investigated using Fourier transform infrared-attenuated reflectance spectroscopy (FTIR-ATR). The OA and BEHA traces exhibit characteristic peaks corresponding to the C–H and the C![[double bond, length as m-dash]](https://www.rsc.org/images/entities/char_e001.gif) O stretches in the 3000–2750 cm−1 and 1800–1650 cm−1 bands, respectively (Fig. 11A, B, S6A and B†). Except for the particles synthesized with a short 5 minute HT step (Fig. S6C†), the intense C
O stretches in the 3000–2750 cm−1 and 1800–1650 cm−1 bands, respectively (Fig. 11A, B, S6A and B†). Except for the particles synthesized with a short 5 minute HT step (Fig. S6C†), the intense C![[double bond, length as m-dash]](https://www.rsc.org/images/entities/char_e001.gif) O stretch band disappears from the spectra of UCNPs synthesized with longer HT steps (Fig. 11C–H and S6D–F†). Two new bands were observed at 1558 and 1548 cm−1, which may be attributed to coordinating dicarboxylate ligands from adipate.72 These peaks gradually disappeared from the UCNP traces corresponding to HT step durations of 30 and 60 minutes (Fig. 11G, H, S4E and F†), suggesting that BEHA functions as a stripping ligand, with a mechanism proposed by recent work.73,74 In the stock precursor solution, the only ligand present was oleate. Upon heating, the decomposition of the oleate complexes initiated the nucleation of the UCNPs. At the same time, BEHA and its potential thermal decomposition products (low molecular weight carboxylic acids, monoesters, and diesters61) competed and displaced the oleate ligands from the nanoparticle surface. The displacement of the oleate ligands by the BEHA ligands induced nanoparticle agglomeration in agreement with the observation that the UCNPs became larger the higher the BEHA concentration and the longer the HT residence time. At sufficiently large BEHA concentrations and HT residence times, the resulting nanoparticles became dispersible in aqueous solutions, in agreement with the corresponding FTIR-ATR spectra, where UCNPs appear to be nearly ligand-free (Fig. 11G, H, S4E and F†).
O stretch band disappears from the spectra of UCNPs synthesized with longer HT steps (Fig. 11C–H and S6D–F†). Two new bands were observed at 1558 and 1548 cm−1, which may be attributed to coordinating dicarboxylate ligands from adipate.72 These peaks gradually disappeared from the UCNP traces corresponding to HT step durations of 30 and 60 minutes (Fig. 11G, H, S4E and F†), suggesting that BEHA functions as a stripping ligand, with a mechanism proposed by recent work.73,74 In the stock precursor solution, the only ligand present was oleate. Upon heating, the decomposition of the oleate complexes initiated the nucleation of the UCNPs. At the same time, BEHA and its potential thermal decomposition products (low molecular weight carboxylic acids, monoesters, and diesters61) competed and displaced the oleate ligands from the nanoparticle surface. The displacement of the oleate ligands by the BEHA ligands induced nanoparticle agglomeration in agreement with the observation that the UCNPs became larger the higher the BEHA concentration and the longer the HT residence time. At sufficiently large BEHA concentrations and HT residence times, the resulting nanoparticles became dispersible in aqueous solutions, in agreement with the corresponding FTIR-ATR spectra, where UCNPs appear to be nearly ligand-free (Fig. 11G, H, S4E and F†).
Thermal analysis of the S65-8.3 60 minutes sample, with a ligand-free like FTIR spectra (Fig. 11G), revealed two transitions with weight loss (Fig. S6†). The first transition is characterized by an endothermic peak on the DSC curve (dashed line, right axis) that starts around 80 °C, with a mass loss of 6% observed on the TGA curve (solid line, left axis), indicative of residual solvent evaporation. The second transition appears in the DSC curve as an exothermic peak immediately followed by an endothermic peak starting around 400 °C, just before the BEHA boiling point, with an additional mass loss of 11% in the TGA curve, indicative of BEHA thermal decomposition. The magnitude of the mass loss after 450 °C is consistent with previously reported values for UCNP after ligand removal.75
It is well established that a ±25 mV zeta potential or larger indicates a stable colloidal system where hydrophilic particles are stabilized by electrostatic repulsion.76 The surface charge of the UCNPs with ligand-free like FTIR spectra (S65-8.3 60 minutes, Fig. 11G) was investigated by zeta potential measurements, using as the electrolyte a 1 mM KF aqueous solution at pH 6.4, 2.2, and 4.0 (adjusted with HCl), and 11.2 (adjusted with NaOH) (Fig. 12A). At pH 6.4 and more basic, the zeta potential was negative (−45 mV), which suggests coordination complexes between the nanoparticle surface positively charged RE ions and solvent OH− ions and thus a negative surface charge, while at a pH of 2.2, the zeta potential became positive, indicative of positively charged surface RE ions coordinated with H2O and OH3+, in agreement with previously reported analysis for ligand-free UCNPs.77 As a result, at a pH in the range relevant for biological applications, from 6.4 to 7.5, the UCNPs show hydrophilic properties, i.e., are dispersed by electrostatic (electric double layer repulsion) stabilization forces, which is very relevant for biological applications with nanoparticles dispersed in aqueous media at physiological pH.78 The hydrodynamic size of these UCNPs (Fig. 12B) exhibited peak values below 100 nm for a pH of 6.4 and higher. At pH 4.0 and 2.2, the larger hydrodynamic size and reduced zeta potential of the UCNPs suggest colloidal instability caused by the reduction of electrostatic repulsion between particles at low pH.78
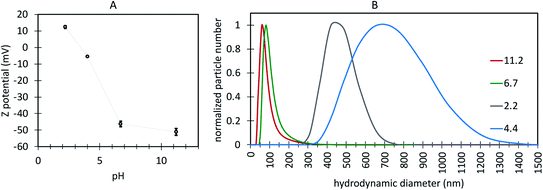 | ||
| Fig. 12 (A) Variation of zeta potential at the surface of the oleate-free Ln-UCNPs as a function of pH. (B) variation of the UCNP hydrodynamic diameter as a function of pH. | ||
Conclusions
We have successfully developed a microwave-assisted method for synthesis of α- and β-phase NaYF4:Yb3+/Er3 upconverting nanoparticles (UCNPs) in bis(2-ethylhexyl) adipate (BEHA) with tunable, narrow size distributions. The calculated topological surface area (TPSA), a widely available calculated descriptor that can be used to describe a solvent's ability to convert microwave energy into heat, positions BEHA among the moderate microwave-absorbing solvents. We used a pre-made concentrated stock precursor solution of rare earth acetates and trifluoroacetates in oleic acid (OA) with a long shelf life, which after stabilization allows to reproducibly synthesize UCNPs under different conditions. The stock solution with a OA![[thin space (1/6-em)]](https://www.rsc.org/images/entities/char_2009.gif) :
:![[thin space (1/6-em)]](https://www.rsc.org/images/entities/char_2009.gif) BEHA mixture provided microwave heating rates up to 60 °C min−1. Increasing the BEHA concentration promotes nanoparticle growth and the transition from the cubic to the hexagonal phase. The UCNP size can be tuned from tens to hundreds of nanometers by the BEHA concentration and the high-temperature residency time. After washes with isopropanol and acetone, the resulting nanoparticles can be dispersed in aqueous media in the physiological pH range for biological applications. This straightforward protocol produces UCNP nanoparticles with well-defined, tunable size and crystallinity using short high-temperature residence times. It has the potential for upscaling nanoparticle production for applications that may require large nanoparticle amounts, such as photovoltaics and magnetic resonance imaging contrast. Future work focuses on optimizing the synthesis conditions and scaling up the nanoparticle yield.
BEHA mixture provided microwave heating rates up to 60 °C min−1. Increasing the BEHA concentration promotes nanoparticle growth and the transition from the cubic to the hexagonal phase. The UCNP size can be tuned from tens to hundreds of nanometers by the BEHA concentration and the high-temperature residency time. After washes with isopropanol and acetone, the resulting nanoparticles can be dispersed in aqueous media in the physiological pH range for biological applications. This straightforward protocol produces UCNP nanoparticles with well-defined, tunable size and crystallinity using short high-temperature residence times. It has the potential for upscaling nanoparticle production for applications that may require large nanoparticle amounts, such as photovoltaics and magnetic resonance imaging contrast. Future work focuses on optimizing the synthesis conditions and scaling up the nanoparticle yield.
Materials and methods
Regents
Oleic acid, bis(2-ethylhexyl) adipate, ytterbium acetate, erbium acetate, and sodium acetate were purchased from Sigma Aldrich (Burlington, MA, USA); yttrium trifluoroacetate from GFS Chemicals (Columbus, OH, USA); sodium trifluoroacetate and di-n-butyl phthalate from Alfa Aesar (Ward Hill, MA, USA); ethyl alcohol from Koptec (King of Prussia, PA, USA); isopropanol from VWR Chemicals (Mississauga, ON, Canada).Microwave reactor setup and temperature measurement
We used a single mode 2.45 GHz reactor (Discover, CEM, Matthews NC, USA) equipped with a high-temperature PTFE-spill cup and an immersion optical fiber temperature probe, rated for a maximum of 300 °C. The fiber probe was inserted into a 5 mm inner diameter, 7-inches long, heavy-wall precision NMR sample tube (Willmad-Labglass, Vineland, NJ, USA), filled with thermally conductive grease to protect the fiber insulation from direct exposure to the reaction (Fig. 1). The temperature probe readings were validated as follows. A 125 ml round-bottom flask with 30 ml of BEHA and a glass encapsulated stir magnet was placed in the microwave cavity. The solvent was heated and held at 300 °C under stirring for 5 to 10 minutes. The microwave power was then turned off, and a calibrated immersion thermocouple probe (51II thermometer with 80PK-22 probe, Fluke, Everett, WA, USA) was used to measure the solvent temperature. The readings of the two probes were compared as the liquid was cooled to room temperature.Stock rare-earth (RE) solution
A 100 mM total rare earth (RE) in oleic acid (OA) stock solution was prepared. Twenty milliliters of oleic acid were degassed under vacuum and stirred for at least 30 minutes in a round bottom flask. Trifluoroacetate (TFA) and acetates (Ac) in the stoichiometric proportions for NaY0.802Yb0.18Er0.018F4 were then added to the flask: 773.05 mg YTFA, 151.98 mg YbAc, 14.99 mg ErAc, 205.2 mg NaTFA, and 125.19 mg NaAc. The flask was placed in the microwave reactor (see Fig. 1 for a reactor setup schematic) under a gentle argon flow for 30 minutes, at the end of which a program with settings 110 °C, 100 W, and 10 minutes was run for dissolving the precursors. At the end of the program, the mixture was rapidly cooled down to room temperature using compressed air and allowed to rest at ambient conditions for at least 2 hours before using it for UCNP synthesis. This stock RE solution was stored for up to six months in a standard 50 ml centrifuge tube.UCNP synthesis
An OA![[thin space (1/6-em)]](https://www.rsc.org/images/entities/char_2009.gif) :
:![[thin space (1/6-em)]](https://www.rsc.org/images/entities/char_2009.gif) BEHA mixture was degassed in a 100 ml round bottom flask under vacuum and magnetic stirring for at least 30 minutes. The degassed OA
BEHA mixture was degassed in a 100 ml round bottom flask under vacuum and magnetic stirring for at least 30 minutes. The degassed OA![[thin space (1/6-em)]](https://www.rsc.org/images/entities/char_2009.gif) :
:![[thin space (1/6-em)]](https://www.rsc.org/images/entities/char_2009.gif) BEHA was then mixed with the stock RE solution, with a final total volume of 30 ml, BEHA concentration of 20 to 91.7% v/v, and RE concentration of 6.7 to 8.3 mM (for details, see Table 1). The flask was placed in the microwave reactor and degassed under gentle argon flow for 15 minutes. The reactor was set to fixed power mode, 300 W, 300 °C, and 5 to 60 minutes. With these settings, 300 W of constant microwave power was applied until the mixture reached 300 °C. The power was then automatically regulated to maintain the reaction at 300 °C for the prescribed residence time, herein called high temperature (HT) step. Finally, the reaction was rapidly cooled down to room temperature with compressed air. The resulting dispersion was transferred from the round bottom flask into two 50 ml polytetrafluoroethylene (PTFE) high-speed centrifugation tubes. Two milliliters of ultrapure water were added to each tube, plus isopropanol to fill the tubes up. The content of the tubes was mixed by vortex agitation and centrifuged at a relative centrifugal force (RCF) of 40
BEHA was then mixed with the stock RE solution, with a final total volume of 30 ml, BEHA concentration of 20 to 91.7% v/v, and RE concentration of 6.7 to 8.3 mM (for details, see Table 1). The flask was placed in the microwave reactor and degassed under gentle argon flow for 15 minutes. The reactor was set to fixed power mode, 300 W, 300 °C, and 5 to 60 minutes. With these settings, 300 W of constant microwave power was applied until the mixture reached 300 °C. The power was then automatically regulated to maintain the reaction at 300 °C for the prescribed residence time, herein called high temperature (HT) step. Finally, the reaction was rapidly cooled down to room temperature with compressed air. The resulting dispersion was transferred from the round bottom flask into two 50 ml polytetrafluoroethylene (PTFE) high-speed centrifugation tubes. Two milliliters of ultrapure water were added to each tube, plus isopropanol to fill the tubes up. The content of the tubes was mixed by vortex agitation and centrifuged at a relative centrifugal force (RCF) of 40![[thin space (1/6-em)]](https://www.rsc.org/images/entities/char_2009.gif) 000g for 40 minutes. The resulting pellets were combined into a 2 ml centrifuge tube and washed three times with isopropanol by resuspension and centrifugation. UCNPs were finally dispersed and stored in 2 ml of isopropanol.
000g for 40 minutes. The resulting pellets were combined into a 2 ml centrifuge tube and washed three times with isopropanol by resuspension and centrifugation. UCNPs were finally dispersed and stored in 2 ml of isopropanol.
Electron microscopy
High angle annular dark field-scanning transmission electron microscopy (HAADF-STEM) images were recorded using a JEOL-ARM operated at 200 kV. Bright-filed-TEM (BF-TEM) images were recorded with the Philips CM-200 at 200 kV. Both image types were used to obtain the nanoparticles' size distribution, shape, and crystallinity. JEOL was equipped with an Oxford Ultim Max TLE spectrometer with a 100 mm2 active area for energy-dispersive X-ray spectroscopy (EDS) spectra collection. UCNPs were dispersed in isopropanol and applied to a 400-mesh copper ultra-thin carbon grid (EMS, Hatfield, PA, USA).X-ray diffraction (XRD)
A few drops of nanoparticle dispersion in isopropanol were dried on a zero-background silicon holder. Patterns were measured using a powder diffractometer (Aeris, Malvern Panalytical, Malvern, United Kingdom). The crystalline phase was identified by comparing the measured patterns with standard reference diffraction patterns.Attenuated reflection Fourier transform infrared (ATR-FTIR) spectroscopy
UCNP samples were washed by suspension in a 1![[thin space (1/6-em)]](https://www.rsc.org/images/entities/char_2009.gif) :
:![[thin space (1/6-em)]](https://www.rsc.org/images/entities/char_2009.gif) 1 isopropanol
1 isopropanol![[thin space (1/6-em)]](https://www.rsc.org/images/entities/char_2009.gif) :
:![[thin space (1/6-em)]](https://www.rsc.org/images/entities/char_2009.gif) acetone mixture followed by centrifugation. The pellet was dried at 65 °C for 2 hours. ATR-FTIR spectra from liquid OA and BEHA and dry UCNPs were collected under vacuum using an FTIR spectrometer (IFS 66v/S Bruker, Billerica, MA).
acetone mixture followed by centrifugation. The pellet was dried at 65 °C for 2 hours. ATR-FTIR spectra from liquid OA and BEHA and dry UCNPs were collected under vacuum using an FTIR spectrometer (IFS 66v/S Bruker, Billerica, MA).
Luminescence
UCNP dispersions in ethanol were loaded in a 1 × 1 mm square borosilicate precision capillary (VitroCom, Mountain Lakes, NJ) and illuminated using an in-house built epi-luminescence microscope (Cerna, Thorlabs, Newton, NJ). The microscope was equipped with a multimode, 900 mW, 975 nm optical fiber-coupled laser diode (QFLD-970-1000M, QPhotonics, Ann Arbor, MI) and a 15× reflective objective (Thorlabs) and an optical spectrometer (QEpro, Ocean Optics). The dispersions absorbance at 975 nm was measured with a UV-Vis-NIR spectrometer (Lambda950, PerkinElmer, Waltham, MA, USA) and used to normalize the luminescence spectra.Hydrodynamic diameter and zeta potential
UCNPs S83-8.3-60 minutes were dispersed in 1 mM aqueous potassium fluoride with their pH adjusted to 11.2, 6.4, 4.0, and 2.2 using sodium hydroxide and hydrochloric acid. Hydrodynamic diameter and zeta potential were measured using dynamic light scattering and laser Doppler velocimetry with a Malvern Zetasizer Nano series instrument (Malvern, United Kingdom) and applying the instrument's general-purpose analysis mode.Thermal analysis
UCNPs S65-8.3-60 minutes were dried overnight in an oven at 60 °C. Thermogravimetric analysis (TGA) and differential scanning calorimetry (DSC) were performed with a Labsys Evo 1500 instrument (Setaram, Calouire, France) in He environment, using a temperature range of 30–500 °C and a heating rate of 20 °C min−1.Conflicts of interest
A patent application for continuous synthesis of upconverting nanoparticles has been filed: U.S. Patent Application No. 63/013,857 (20210332294).Acknowledgements
We acknowledge the use of facilities within the Eyring Materials Center at Arizona State University, supported in part by NNCI-ECCS-2025490.References
- F. Auzel, J. Lumin., 2020, 223, 116900 CrossRef CAS.
- B. S. Richards, D. Hudry, D. Busko, A. Turshatov and I. A. Howard, Chem. Rev., 2021, 121, 9165–9195 CrossRef CAS PubMed.
- A. A. Ansari and M. Sillanpää, Renewable Sustainable Energy Rev., 2021, 151, 111631 CrossRef CAS.
- X. T. Le and Y. S. Youn, Arch. Pharmacal Res., 2020, 43, 134–152 CrossRef CAS.
- S. Y. Lee, R. Lee, E. Kim, S. Lee and Y. I. Park, Front. Bioeng. Biotechnol., 2020, 8, 275 CrossRef PubMed.
- U. Kostiv, J. Kučka, V. Lobaz, N. Kotov, O. Janoušková, M. Šlouf, B. Krajnik, A. Podhorodecki, P. Francová and L. Šefc, Sci. Rep., 2020, 10, 1–14 CrossRef.
- C. Liu, H. Shao, D. Li, X. Sui, N. Liu, S. U. Rahman, X. Li and P. R. Arany, Photodiagn. Photodyn. Ther., 2021, 102485 CrossRef CAS PubMed.
- M. Challenor, P. Gong, D. Lorenser, M. J. House, R. C. Woodward, T. S. Pierre, M. Fitzgerald, S. A. Dunlop, D. D. Sampson and K. S. Iyer, Dalton Trans., 2014, 43, 16780–16787 RSC.
- S. Hu, S. Wu, C. Li, R. Chen, E. Forsberg and S. He, Sens. Actuators, B, 2020, 305, 127517 CrossRef CAS.
- X. Wu, S. Zhan, J. Han and Y. Liu, Nano Lett., 2020, 21, 272–278 CrossRef PubMed.
- J. R. Casar, C. A. McLellan, C. Siefe and J. A. Dionne, ACS Photonics, 2021, 8, 3–17 CrossRef CAS.
- V. Agarwal, D. Ho, D. Ho, Y. Galabura, F. Yasin, P. Gong, W. Ye, R. Singh, A. Munshi and M. Saunders, ACS Appl. Mater. Interfaces, 2016, 8, 4934–4939 CrossRef CAS PubMed.
- A. A. Ansari, A. K. Parchur, N. D. Thorat and G. Chen, Coord. Chem. Rev., 2021, 440, 213971 CrossRef CAS.
- B. Chen and F. Wang, Inorg. Chem. Front., 2020, 7, 1067–1081 RSC.
- Y. Jiao, C. Ling, J.-X. Wang, H. Amanico, J. Saczek, H. Wang, S. Sridhar, B. B. Xu, S. Wang and D. Wang, Part. Part. Syst. Charact., 2020, 37, 2000129 CrossRef CAS.
- G. Liang, H. Wang, H. Shi, H. Wang, M. Zhu, A. Jing, J. Li and G. Li, J. Nanobiotechnol., 2020, 18, 154 CrossRef PubMed.
- J. van Embden, A. S. Chesman and J. J. Jasieniak, Chem. Mater., 2015, 27, 2246–2285 CrossRef CAS.
- D. R. Baer, Front. Chem., 2018, 6, 145 CrossRef PubMed.
- A. K. Soni, R. Joshi and R. S. Ningthoujam, in Handbook on Synthesis Strategies for Advanced Materials, Springer, 2021, pp. 383–434 Search PubMed.
- H. Tao, T. Wu, M. Aldeghi, T. C. Wu, A. Aspuru-Guzik and E. Kumacheva, Nat. Rev. Mater., 2021, 6, 701–716 CrossRef.
- S. Wilhelm, M. Kaiser, C. Würth, J. Heiland, C. Carrillo-Carrion, V. Muhr, O. S. Wolfbeis, W. J. Parak, U. Resch-Genger and T. Hirsch, Nanoscale, 2015, 7, 1403–1410 RSC.
- S. Wilhelm, ACS Nano, 2017, 11, 10644–10653 CrossRef CAS PubMed.
- V. K. LaMer and R. H. Dinegar, J. Am. Chem. Soc., 1950, 72, 4847–4854 CrossRef CAS.
- K. J. Rao, B. Vaidhyanathan, M. Ganguli and P. A. Ramakrishnan, Chem. Mater., 1999, 11, 882–895 CrossRef CAS.
- B. Amouroux, C. m. Roux, J.-D. Marty, M. Pasturel, A. Bouchet, M. Sliwa, O. Leroux, F. Gauffre and C. Coudret, Inorg. Chem., 2019, 58, 5082–5088 CrossRef CAS PubMed.
- Q. Saleem, M. Torabfam, T. Fidan, H. Kurt, M. Yuce, N. Clarke and M. K. Bayazit, ACS Sustainable Chem. Eng., 2021, 9, 9988–10015 CrossRef CAS.
- O. Długosz and M. Banach, React. Chem. Eng., 2020, 5, 1619–1641 RSC.
- S. Dąbrowska, T. Chudoba, J. Wojnarowicz and W. Łojkowski, Crystals, 2018, 8, 379 CrossRef.
- H.-Q. Wang and T. Nann, ACS Nano, 2009, 3, 3804–3808 CrossRef CAS PubMed.
- C. Chen, L.-D. Sun, Z.-X. Li, L.-L. Li, J. Zhang, Y.-W. Zhang and C.-H. Yan, Langmuir, 2010, 26, 8797–8803 CrossRef CAS PubMed.
- N. Niu, F. He, S. Gai, C. Li, X. Zhang, S. Huang and P. Yang, J. Mater. Chem., 2012, 22, 21613–21623 RSC.
- L. Tong, X. Li, R. Hua, X. Li, H. Zheng, J. Sun, J. Zhang, L. Cheng and B. Chen, J. Lumin., 2015, 167, 386–390 CrossRef CAS.
- S. Som, S. Das, C.-Y. Yang and C.-H. Lu, Opt. Lett., 2016, 41, 464–467 CrossRef CAS PubMed.
- S. Ullah, C. Hazra, E. P. Ferreira-Neto, T. C. Silva, U. P. Rodrigues-Filho and S. J. Ribeiro, CrystEngComm, 2017, 19, 3465–3475 RSC.
- K. L. Reddy, N. Prabhakar, R. Arppe, J. M. Rosenholm and V. Krishnan, J. Mater. Sci., 2017, 52, 5738–5750 CrossRef CAS.
- M. Quintanilla, F. Ren, D. Ma and F. Vetrone, ACS Photonics, 2014, 1, 662–669 CrossRef CAS.
- F. Li, C. Li, X. Liu, Y. Chen, T. Bai, L. Wang, Z. Shi and S. Feng, Chem.–Eur. J., 2012, 18, 11641–11646 CrossRef CAS PubMed.
- D. Wang, L. Ren, X. Zhou, X.-z. Wang, J. Zhou, Y. Han and N. Kang, Nanotechnology, 2012, 23, 225705 CrossRef PubMed.
- I. Halimi, E. M. Rodrigues, S. L. Maurizio, H.-Q. T. Sun, M. Grewal, E. M. Boase, N. Liu, R. Marin and E. Hemmer, J. Mater. Chem. C, 2019, 7, 15364–15374 RSC.
- H.-Q. Wang, R. D. Tilley and T. Nann, CrystEngComm, 2010, 12, 1993–1996 RSC.
- H. Wang and T. Nann, Nanoscale Res. Lett., 2011, 6, 1–5 Search PubMed.
- F. Li, C. Li, X. Liu, T. Bai, W. Dong, X. Zhang, Z. Shi and S. Feng, Dalton Trans., 2013, 42, 2015–2022 RSC.
- C. Chen, C. Li, L. Zhao, X. Liu, T. Bai, H. Huang, Z. Shi and S. Feng, Inorg. Chem. Commun., 2015, 62, 11–14 CrossRef CAS.
- C. S. Lim, A. Aleksandrovsky, M. Molokeev, A. Oreshonkov and V. Atuchin, J. Solid State Chem., 2015, 228, 160–166 CrossRef CAS.
- J. Zhao, Y.-J. Zhu, J. Wu and F. Chen, J. Colloid Interface Sci., 2015, 440, 39–45 CrossRef CAS PubMed.
- Z. Yuan, C. Shen, Y. Zhu, A. Bai, J. Wang, Y. Liu and Y. Lyu, Ceram. Int., 2016, 42, 1513–1520 CrossRef CAS.
- N. Panov, R. Marin and E. Hemmer, Inorg. Chem., 2018, 57, 14920–14929 CrossRef CAS PubMed.
- K. Martina, G. Cravotto and R. S. Varma, J. Org. Chem., 2021, 86, 13857–13872 CrossRef CAS PubMed.
- C. O. Kappe, Chem. Soc. Rev., 2013, 42, 4977–4990 RSC.
- S. Horikoshi, N. Serpone and I. ebrary, Microwaves in nanoparticle synthesis: fundamentals and applications, Wiley-VCH, Weinheim, 1 edn, 2013 Search PubMed.
- M. Nüchter, B. Ondruschka, W. Bonrath and A. Gum, Green Chem., 2004, 6, 128–141 RSC.
- P. Priecel and J. A. Lopez-Sanchez, ACS Sustainable Chem. Eng., 2019, 7, 3–21 CrossRef CAS.
- J. C. Hubinger, J. Cosmet. Sci., 2010, 61, 457–465 Search PubMed.
- G. Wypych, Handbook of plasticizers, ChemTec Publishing, 2004 Search PubMed.
- M. Z. Uddin, M. Watanabe, H. Shirai and T. Hirai, J. Polym. Sci., Part B: Polym. Phys., 2003, 41, 2119–2127 CrossRef CAS.
- M. A. Elliot, A. R. Jones and L. B. Lockhart, Anal. Chem., 1947, 19, 10–15 CrossRef.
- Y. Wang, T. D. Wig, J. Tang and L. M. Hallberg, J. Food Eng., 2003, 57, 257–268 CrossRef.
- J. A. Gerbec, D. Magana, A. Washington and G. F. Strouse, J. Am. Chem. Soc., 2005, 127, 15791–15800 CrossRef CAS PubMed.
- S. Prasanna and R. J. Doerksen, Curr. Med. Chem., 2009, 16, 21–41 CrossRef CAS PubMed.
- C. O. Kappe, A. Stadler and D. Dallinger, Microwaves in organic and medicinal chemistry, John Wiley & Sons, 2012 Search PubMed.
- X. Qian, Y. Xiang, H. Shang, B. Cheng, S. Zhan and J. Li, Friction, 2016, 4, 29–38 CrossRef CAS.
- S. Kim, J. Chen, T. Cheng, A. Gindulyte, J. He, S. He, Q. Li, B. A. Shoemaker, P. A. Thiessen, B. Yu, L. Zaslavsky, J. Zhang and E. E. Bolton, Nucleic Acids Res., 2020, 49, D1388–D1395 CrossRef PubMed.
- J. Crossley, J. Chem. Phys., 1973, 58, 5315–5318 CrossRef CAS.
- P. C. Fannin, C. N. Marin, I. Malaescu and N. Stefu, J. Phys.: Condens. Matter, 2007, 19, 036104 CrossRef.
- S. K. Nayak and S. S. N. Murthy, J. Chem. Phys., 1993, 99, 1607–1613 CrossRef CAS.
- M. Subramanian and K. Sathis, Int. J. Sci. Res. Educ., 2016, 4(1), 4810–4817 Search PubMed.
- J. V. Timonen, E. T. Seppälä, O. Ikkala and R. H. Ras, Angew. Chem., 2011, 123, 2128–2132 CrossRef.
- S. Niu, Y. Zhou, H. Yu, C. Lu and K. Han, Energy Convers. Manage., 2017, 149, 495–504 CrossRef CAS.
- M. Gaumet, A. Vargas, R. Gurny and F. Delie, Eur. J. Pharm. Biopharm., 2008, 69, 1–9 CrossRef CAS PubMed.
- J. Hölsä, T. Laihinen, T. Laamanen, M. Lastusaari, L. Pihlgren, L. C. V. Rodrigues and T. Soukka, Phys. B, 2014, 439, 20–23 CrossRef.
- D. Mendez-Gonzalez, S. Melle, O. G. Calderón, M. Laurenti, E. Cabrera-Granado, A. Egatz-Gómez, E. López-Cabarcos, J. Rubio-Retama and E. Díaz, Nanoscale, 2019, 11, 13832–13844 RSC.
- K. I. Hadjiivanov, D. A. Panayotov, M. Y. Mihaylov, E. Z. Ivanova, K. K. Chakarova, S. M. Andonova and N. L. Drenchev, Chem. Rev., 2021, 121, 1286–1424 CrossRef CAS PubMed.
- J. Fu, L. He, W. Xu, J. Zhuang, X. Yang, X. Zhang, M. Wu and Y. Yin, Chem. Commun., 2016, 52, 128–131 RSC.
- S. E. Doris, J. J. Lynch, C. Li, A. W. Wills, J. J. Urban and B. A. Helms, J. Am. Chem. Soc., 2014, 136, 15702–15710 CrossRef CAS PubMed.
- E. Palo, H. Zhang, M. Lastusaari and M. Salomäki, ACS Appl. Nano Mater., 2020, 3, 6892–6898 CrossRef CAS.
- C. N. Lunardi, A. J. Gomes, F. S. Rocha, J. De Tommaso and G. S. Patience, Can. J. Chem. Eng., 2021, 99, 627–639 CrossRef CAS.
- N. Bogdan, F. Vetrone, G. A. Ozin and J. A. Capobianco, Nano Lett., 2011, 11, 835–840 CrossRef CAS PubMed.
- F. Liu, Q. Zhao, H. You and Z. Wang, Nanoscale, 2013, 5, 1047–1053 RSC.
Footnote |
| † Electronic supplementary information (ESI) available. See https://doi.org/10.1039/d2ra03262g |
| This journal is © The Royal Society of Chemistry 2022 |

