 Open Access Article
Research on the on-line determination of formaldehyde gas by the gas–liquid phase chemiluminescence method†
Wenyuan TANab,
Qi Chenc,
Rong Wang *a,
Zhuqing Wanga,
Huan Zhanga and
Yuran Wua
aCollege of Chemical Engineering, Sichuan University of Science and Engineering, Zigong 643000, China. E-mail: zgrtvu2008@163.com
bKey Laboratories of Fine Chemicals and Surfactants in Sichuan Provincial Universities, Zigong 643000, China
cSchool of Chemistry and Environmental Engineering, Sichuan University of Science and Engineering, Zigong 643000, China
First published on 24th August 2022
Abstract
Based on the gas–liquid phase chemiluminescence tester independently developed by our laboratory, a highly sensitive, fast and accurate on-line detection method of formaldehyde gas in ambient atmosphere is established. The chemiluminescence system and the trace formaldehyde gas in the air directly undergo an interface heterogeneous chemiluminescence reaction to obtain a strong chemiluminescence signal. Through the measurement of the chemiluminescence signal intensity, a highly sensitive, real-time and on-line method for the determination of formaldehyde in the air was established. Factors influencing the experimental results such as gallic acid, potassium dichromate, reaction medium concentration, surfactant type and concentration, pump speed, tube length, and interfering gas were discussed based on the single factor and orthogonal analysis results. Finally, the optimal detection conditions were collected, and the detection results were compared with the national standard phenol reagent method. The results show that when the concentration of the standard formaldehyde gas is in the range of 0–0.582 μg L−1, the linear equation of this method is y = 208x + 29.667, the linear coefficient is R2 = 0.997, and the minimum detection concentration of formaldehyde is 2.327 × 10⁻³ μg L−1. Under the same external conditions, the comparison and analysis using the national standard phenol reagent method proved that this method has the advantages of fast detection speed, low detection limit, good sensitivity, and accurate results, which can be used for real-time and online determination of trace formaldehyde in ambient air.
1 Introduction
With the rapid development of the social economy and industry, the use of formaldehyde (HCHO) as an important chemical organic raw material is steadily increasing. Formaldehyde is an irritant and toxic gas that is harmful to human health due to its mutagenicity and carcinogenicity.1 The World Health Organization (WTO) and the U.S. Environmental Protection Agency (EPA) have long listed it as a class of carcinogens.2 In an outdoor environment, formaldehyde will rapidly photodegrade under light exposure to generate hydroperoxyl radicals (˙HO2), and then react with nitric oxide (NO) to form active hydroxyl radicals (˙OH), which ultimately leads to ozone (O3), peroxyacetyl nitrate (PAN) and other photochemical pollution gas generation.3 In an indoor environment, due to the large number of decorative materials containing formaldehyde and the slow air flow, the indoor concentration of formaldehyde is much higher than that in an outdoor environment. Formaldehyde can cause irritation and allergic reactions after being inhaled by the human body. A high concentration of formaldehyde has adverse effects on various organs and may even cause death.4–6 Therefore, the detection of formaldehyde content is crucial in the field of environmental monitoring and human health.Several detection methods of formaldehyde were reported7–9 and they are generally divided into traditional analysis methods and modern analysis methods. Traditional analytical methods were developed in the 1990s, which mainly include spectrophotometry, chromatography, and chemiluminescence analysis.10–12 Modern analytical methods are new analytical methods developed in the recent decade, which include the electrochemical method,13 catalytic kinetic spectrophotometry (CKS),14 sensor method,15–17 gas–liquid chemiluminescence analysis (GLC)18 and fluorescent probe (FP) method.8 The gas–liquid heterogeneous chemiluminescence analysis (GLHC) is a new high-sensitivity detection method developed on the basis of chemiluminescence analysis. The reaction reagent directly reacts with formaldehyde gas, while the sampling and absorption process are not needed so that formaldehyde can be detected directly and quickly without an external light source. Moreover, this method can also avoid the interference of stray light, humidity and other external factors. Compared with the flow injection chemiluminescence (IC) analysis, GLHC analysis has significant advantages.
Based on the chemiluminescence analyzer of gas–liquid heterogeneous interface independently developed in the laboratory, a highly sensitive, fast and accurate on-line analysis and detection method of the formaldehyde gas in ambient atmosphere is established in this study. Alkaline conditions were employed for comparison with the classical gallic acid-hydrogen peroxide system19 and luminol-hydrogen peroxide chemiluminescence system.20 Potassium dichromate was selected as the oxidant to achieve more stable luminescence and less interference. The system provides a new idea for the on-line detection of formaldehyde gas by chemiluminescence.
2 Materials and methods
2.1 Apparatus and reagents
A gas–liquid phase chemiluminescence tester (self-made in the laboratory, 1000 V for negative high voltage of photocell) and a Lambda 35 ultraviolet visible spectrophotometer (PerkinElmer, USA) and MCS-2SLMP-D/5 M laminar flow mass flow controller (Alicat, USA) were used in this experiment. Formaldehyde standard gas (HCHO, 20 μg L−1, No. l63801091, filled with nitrogen, Wuhan New Reid Special Gas, CHINA), gallic acid (C7H6O5,99%, Aladdin, USA), potassium dichromate (K2Cr2O7,99.8%, Aladdin, USA), ammonium ferric sulfate, anhydrous ethanol (NH4Fe(SO4)2, C2H6O, AR, Chengdu Kelong Chemical Reagent, CHINA), phenol reagent (C8H9N3S·HCl·H2O, AR, Tianjin Guangfu Fine Chemical, CHINA), sodium hydroxide, sulfuric acid, formaldehyde (NaOH, H2SO4, HCHO, AR, Chongqing Chuandong Chemical, CHINA), Tween 20, Tween 80, ethylene glycol, Brij58, and TritonX-100 (C26H50O10, C24H44O6, (CH2OH)2, C56H114O21, C18H28O5, AR, Sigma, USA) were used as reagents.2.2 CL assay for the detection of HCHO
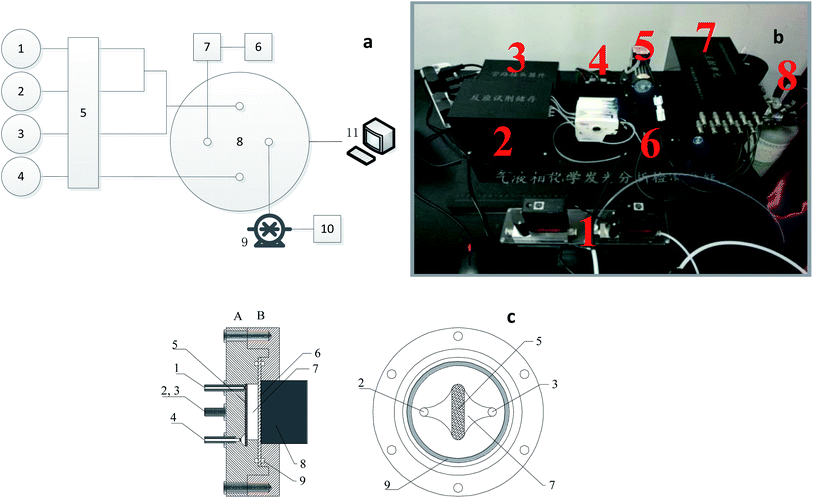
The working principal diagram of the gas–liquid phase chemiluminescence tester is shown in Fig. 1. The reaction reagents (No. 1–3) and formaldehyde sample gas (No. 6) were pumped into the reactor (No. 8) through the peristaltic pump (No. 5) and vacuum pump (No. 9), respectively. The sample gas flow was controlled by a mass flowmeter (No. 7). The reaction reagent and the formaldehyde sample gas gave rise to a chemiluminescence reaction in the reactor, and a small amount of current was generated by an optical signal after being received by the photocell. It was received and processed by an industrial computer (No. 11) after the circuit was amplified. The obtained electrical signal was related to the intensity of the luminescence. Within a certain concentration range, the luminescence signal showed a linear relationship with the formaldehyde content in the sample gas. The reagent and waste gas after the reaction was removed in time and collected in the waste liquid bottle (No. 4) and waste gas absorption bottle (No. 10).A schematic diagram of the reactor is shown in Fig. 1c. An oval reaction zone (No. 5) in the middle of the reactor was paved with a layer of hydrophilic polymer materials. After the liquid reagent was pumped into the reaction zone, a uniform liquid film was formed. The gas sample into the reactor was used to keep the laminar flow state and to fully contact with the liquid membrane. The CL reaction occurred at the gas–liquid heterogeneous interface, and a luminescence signal was generated.
3 Results and discussion
3.1 Optimization of the chemiluminescence reagent system
In order to obtain a high detection sensitivity, the luminescent reagent system needs to be optimized. Each luminescent reagent and the formaldehyde standard gas at a certain concentration were pumped into the reactor at the same time for the chemiluminescence reaction and signal measurement. The variation curve of the luminescence intensity with the reagent concentration was recorded, and the optimal reagent concentration and luminescence intensity at this concentration were determined. The instrument parameters of the gas–liquid phase chemiluminescence tester set when optimizing the reagent system were: photocell negative high voltage of 1000 V, peristaltic pump speed of 2 (at the flow rate of 40 μL min−1), vacuum pump flow rate of 2 L min−1, formaldehyde gas (entering the reactor) concentration was 2.3 μg L−1, and data filtering of 0.4.3.2 System parameter selection
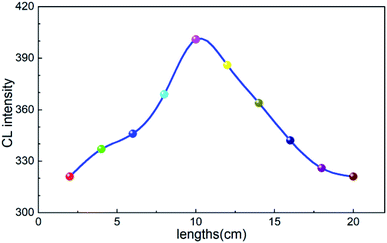
In order to obtain a stronger chemiluminescence signal, the effects of the liquid inlet speed and reagent mixing tube length on the intensity of the chemiluminescence signal were investigated under the condition of optimizing the luminescent reagent system. The reagent feeding speed was controlled by the peristaltic pump. The luminous instrument was equipped with two pump speeds. When the pump speed was the first gear (20 μL min−1), the chemiluminescence intensity of the system was 257, and when the pump speed was the second gear (40 μL min−1), the chemiluminescence intensity of the system was 399. The results showed that when the pump speed was 40 μL min−1, the luminous intensity was high and the chemiluminescence intensity was stable and has a large signal-to-noise ratio.Each reaction reagent was mixed before entering the reactor, and the length of the tube after mixing affected the mixing degree and reaction degree of the reagent before entering the reactor. The chemiluminescence intensity of the system was tested when the length of the pipeline from the mixing node to the reactor was 2, 4, 6, 8, 10, 12, 14, 16, 18 and 20 cm, and the optimal tube length was determined. As shown in Fig. 3, the luminous intensity of the system gradually increases first and then decreases with the increase in the tube length, but the luminous intensity reaches the maximum after 10 cm. Therefore, the optimal reagent mixing tube length was determined to be 10 cm.
3.3 Interference test
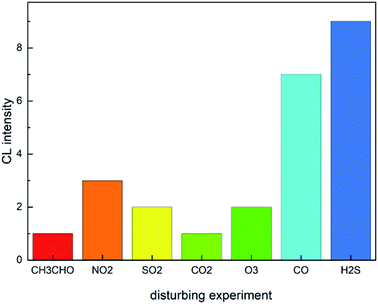
Under the optimized experimental conditions, 10 μg L−1 mixture of acetaldehyde, nitrogen dioxide, sulfur dioxide, ozone, hydrogen sulfide and carbon monoxide diluted with zero air was pumped into the system for chemiluminescence measurement, and the luminous intensity was recorded. As shown in Fig. 4, After each interfering gas was introduced, the luminous intensity of the system showed no evident change and was negligible. Therefore, the interference gas of 10 μg L−1 acetaldehyde, nitrogen dioxide, sulfur dioxide, ozone, hydrogen sulfide and carbon monoxide have no impact on the system detection.3.4 Comparison between the phenol reagent method and instrument method
The phenol reagent method was a classical analytical method for the detection of formaldehyde in air,22 which has the advantages of having a low detection limit, high sensitivity and good precision. However, it takes a long time to analyze, requires skilled testers and cannot test online. The phenol reagent method was compared with the instrument method, and the measured data were compared and analyzed. The detection limit was calculated as follows: D = 3Sb/S, wherein D is the detection limit, μg L−1; Sb is the standard deviation of blank signal, %; S is the equation sensitivity (the slope of the standard curve).Comparing the test results of the phenol reagent method and the instrument method showed that the linear relationship of both the two methods was better, but the detection limit of the instrument method was lower. Through the above experiments, it was found that four formaldehyde samples were detected by the two methods, and the results are shown in Table 1. The experimental results showed that the measured results of 0.3 μg L−1 and 0.5 μg L−1 standard gas by the instrument method and phenol reagent method were basically consistent but for indoor and outdoor air samples in the laboratory, phenol reagent method was not detected. While the instrument method detects specific values and the operation of the instrument method was simpler than the phenol reagent method, there was no need to absorb the formaldehyde gas and the test time was shorter.
| Test methods | Indoor air | Outdoor air | 0.30 μg L−1 HCHO | 0.50 μg L−1 HCHO |
|---|---|---|---|---|
| Phenol reagent method | 0.061 μg L−1 | ND | 0.291 μg L−1 | 0.488 μg L−1 |
| Instrument method | 0.059 μg L−1 | 0.011 μg L−1 | 0.290 μg L−1 | 0.480 μg L−1 |
3.5 Chemiluminescence reaction mechanism
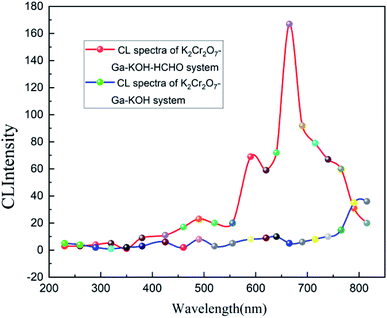
The gas–liquid chemiluminescence reaction system is obviously complex. As an element with variable valencies, chromium can enter Haber–Weiss-type reactions leading to the generation of hydroxyl radicals (˙OH).24 The reaction of Cr(VI with different reductants gives rise to Cr(V) complexes. The hydroxyl radical generation by Cr(VI) reduction has been demonstrated in a variety of model systems.25 As a reducing agent, Ga is oxidized by Cr(VI) in the CL reaction. In order to explore the possible chemiluminescence mechanism, the luminescence wavelength of the reaction system was measured and studied by the BPCL-GP21Q-TGC ultra-weak chemiluminescence measuring instrument, and the chemiluminescence spectrum of K2Cr2O7-GA-KOH-HCHO was drawn.As shown in Fig. 5, the luminescence signal was low when there was no formaldehyde in the reagent system. When formaldehyde was added, the strongest light was emitted by the chemiluminescence system at a wavelength of 665 nm. It was speculated that the luminescent body of the reaction was singlet oxygen (1O2).26 1O2 is very active and can easily form a bimolecular singlet oxygen in the excited state (1O2)2*. CL occurs when the (1O2)2* generated during the reaction transitions back to the ground state. It is speculated that the energy generated during the reaction between HCHO and ˙OH is transferred to the excited bimolecular singlet oxygen,27 and then transitions back to the ground state to produce CL. The light wavelength released after returning to the ground state is about 603–703 nm. The specific reaction mechanism remains to be explored. The CL emission in the Ga–K2Cr2O7–KOH system is very weak and thus, the HCHO content plays the main role in enhancing the CL intensity of this system. The possible sequence of reactions occurring during the CL signal generation was as follows.
| Cr2O72− + Ga + OH− → Cr(V) + 1O2 + OH | (1) |
| 1O2 + 1O2 → (1O2)2* | (2) |
| HCHO + ˙OH2 → (1O2)2* − E | (3) |
| (1O2)2* − E → 2O2 + hν (λ = 603–703 nm) | (4) |
4 Conclusions
In this study, a formaldehyde-gallic acid-potassium dichromate chemiluminescence system under alkaline conditions was studied and a new method for the continuous determination of gaseous formaldehyde based on a gas–liquid chemiluminescence detection system was established. This method was based on the chemiluminescence reaction of the formaldehyde gas directly with gallic acid and potassium dichromate solution under alkaline conditions at the gas–liquid interface. The optimal concentration of each reagent and other reaction conditions were discussed, and compared with the phenol reagent method. The results showed that the chemiluminescence method has the advantages of providing accurate results, simple operation, low detection limit (as low as 0.003 μg L−1), and nitrogen dioxide, sulfur dioxide, ozone and other gases have no obvious interference with the system. The method can be extended to the quantitative detection of other trace gases in ambient air.In order to further optimize the formaldehyde gallic acid potassium dichromate chemiluminescence system, the material of the reaction interface can be optimized to improve the signal intensity. The liquid forms a liquid film on the surface of the reaction interface to increase the contact area of atmospheric liquid and reduce the detection limit. So far, the non-woven fabric used in this study is the best choice for the reaction interface. In addition, optimizing the sample gas path can increase the flow stability of the sample gas and reduce the freedom of system noise, so as to improve the optical stability of the gas–liquid chemiluminescence detection system. With the improvement of accuracy, the gas–liquid chemiluminescence detection system can not only be applied to the real-time detection of indoor formaldehyde but also to measure the spatial distribution of atmospheric HCHO concentration by carrying equipment.
Conflicts of interest
There are no conflicts to declare.Acknowledgements
This study was supported by the Key Laboratories of Fine Chemicals and Surfactants in Sichuan Provincial Universities Foundation of China (Grant No. 2018JXY06), Zi Gong city High-tech Industrial Development Zone Pilot project Foundation of China(Grant No. 2049) and Sichuan Science and Technology Program (Grant No.2020YFS0347).References
- D. Nielsen, T. Larsen and P. Wolkoff, Re-evaluation of the WHO (2010) formaldehyde indoor air quality guideline for cancer risk assessment, Arch. Toxicol., 2016, 91(1), 35–61 CrossRef PubMed.
- H. Lui, H. Steven Sai Hang and K. Louie, et al., Seasonal behavior of carbonyls and source characterization of formaldehyde (HCHO) in ambient air, Atmos. Environ., 2017, 152, 51–60 CrossRef.
- G. Jing, H. Yang and L. Xianxian, et al., Combined exposure to formaldehyde and PM2.5: Hematopoietic toxicity and molecular mechanism in mice, Environ. Int., 2020, 144, 106050 CrossRef PubMed.
- L. Tian, F. Chen and Q. Zhou, et al., Unignorable toxicity of formaldehyde on electroactive bacteria in bioelectrochemical systems, Environ. Res., 2020, 183, 109143 CrossRef PubMed.
- G. Linan, L. Haoxin and X. Yang, et al., Leakage behavior of toxic substances of naphthalene sulfonate-formaldehyde condensation from cement based materials, J. Environ. Manage., 2020, 255, 109934 CrossRef PubMed.
- Y. Zhao, C. Magaña and H. Cui, et al. Formaldehyde-induced hematopoietic stem and progenitor cell toxicity in mouse lung and nose, Arch. Toxicol., 2021, 95, 693–701 CrossRef CAS PubMed.
- R. Giesen, T. Schripp and D. Markewitz, et al., Comparison of Methods for the Determination of Formaldehyde in Air, Anal. Lett., 2016, 49(10), 1613–1621 CrossRef CAS.
- X. Liu, L. Ning and L. Meng, et al., Recent progress in fluorescent probes for detection of carbonyl species: Formaldehyde, carbon monoxide and phosgene, Coord. Chem. Rev., 2020, 404, 213109 CrossRef CAS.
- X. Zhang, X. Shen and Y. Wang, The Research Progress of Detection Method of Formaldehyde in Food, 2017, pp. 513–517 Search PubMed.
- S. L. Fan, L. X. Zhao and J. M. Lin, Research and application of chemiluminescence analysis in environmental analytical chemistry, Environ. Chem., 2007,(01), 92–105 CAS.
- Z. P. Ji, J. Wang, J. Han and X. Y. Hu, Determination of formaldehyde content by flow injection chemiluminescence method, Chin. J. Anal. Lab., 2011, 30(08), 23–26 CAS.
- P. Shuangqi, L. Quansong and L. Yue, et al., Mechanistic Investigation on Chemiluminescent Formaldehyde Probes, Chem.–Eur. J., 2021, 27, 5712–5720 CrossRef PubMed.
- X. Huiting, X. Chen and Y. Cao, et al., Electrochemical determination of formaldehyde via reduced AuNPs@PPy composites modified electrode, Microchem. J., 2020, 104846 Search PubMed.
- M. Ganjikhah, S. Shariati and E. Bozorgzadeh, Preconcentration and spectrophotometric determination of trace amount of formaldehyde using hollow fiber liquid-phase microextraction based on derivatization by Hantzsch reaction, J. Iran. Chem. Soc., 2016, 14(4), 763–769 CrossRef.
- L. Wang, J. Guo and D. Long, et al., Integrated sensing layer of bacterial cellulose and polyethyleneimine to achieve high sensitivity of ST-cut quartz surface acoustic wave formaldehyde gas sensor, J. Hazard. Mater., 2020, 388, 121743 CrossRef PubMed.
- d. Broek, K. Cerrejon and E. Pratsinis, et al., Selective formaldehyde detection at ppb in indoor air with a portable sensor, J. Hazard. Mater., 2020, 123052 CrossRef PubMed.
- H. Che, L. Yong and X. Tian, et al., A versatile logic detector and fluorescent film based on Eu-based MOF for swift detection of formaldehyde in solutions and gas phase, J. Hazard. Mater., 2020, 124624 Search PubMed.
- Z. Q. Wang, Y. Zheng, B. Yang, X. D. Gong and T. Sun, Ozone on-line determination based on chemiluminescence principle of gas-liquid surface, Anal. Instrum., 2016,(03), 6–10 Search PubMed.
- K. W. Zhou and Z. Xu, Determination of trace formaldehyde in air by static injection chemiluminescence method, J. Beijing Union Univ., 2008, 22(1), 68–70 CrossRef CAS PubMed.
- X. D. Shao and Z. H. Song, Rapid determination of formaldehyde in air by flow injection chemiluminescence , Spectrosc. Lab., 2006(05), 1113–1116 Search PubMed.
- C. D. Chen, L. j. Li, H. Cheng, Z. Cai, S. G. Li and L. Zhong, Determination of acetaminophen tablets by chemiluminescence with cerium and acetaminophen enhanced by surfactant, Anal. Lab., 2008,(S1), 15–18 CAS.
- GB/T 18204.2-2014, Hygienic inspection methods in public places – Part 2: Chemical contaminants. National Standards of the People's Republic of China.
- K. Motyka, P. Mikuškaa and Z. Večeř, Continuous chemiluminescence determination of formaldehyde in air based on Trautz-Schorigin reaction, Anal. Chim. Acta, 2006, 2(562), 236–244 CrossRef.
- V. Lushchak, O. I. Kubrak and M. Z. Nykorak, et al., The effect of potassium dichromate on free radical processes in goldfish: possible protective role of glutathione, Aquat. Toxicol., 2008, 87(2), 108–114 CrossRef PubMed.
- M. B. Kadiiska, Q. H. Xiang and R. P. Mason, In vivo free radical generation by chromium (VI): an electron spin resonance spin-trapping investigation, Chem. Res. Toxicol., 1994, 7(6), 800–805 Search PubMed.
- C. Lu, G. Song and J. Lin, Reactive oxygen species and their chemiluminescence-detection methods, TrAC, Trends Anal. Chem., 2006, 25(10), 985–995 CrossRef CAS.
- D. Slawinska and J. Slawinski, Chemiluminescent flow method for determination of formaldehyde, Anal. Chem., 1975, 47(13), 2101–2109 CrossRef CAS.
Footnote |
| † Electronic supplementary information (ESI) available. See https://doi.org/10.1039/d2ra03175b |
| This journal is © The Royal Society of Chemistry 2022 |

