 Open Access Article
Optimized antibody immobilization on natural silica-based nanostructures for the selective detection of E. coli†
Diaz Ayu Widyasariab,
Anis Kristiania,
Ahmad Randy c,
Robeth V. Manurungde,
Rizna Triana Dewic,
Agustina Sus Andreaniad,
Brian Yuliarto
 bd and
S. N. Aisyiyah Jenie
 *ad
*ad
aResearch Centre for Chemistry, National Research and Innovation Agency (BRIN), Kawasan PUSPIPTEK, Building 452, Serpong, Tangerang Selatan 15314, Banten, Indonesia. E-mail: siti043@brin.go.id
bDepartment of Physics Engineering, Research Centre for Nanosciences and Nanotechnology, Institut Teknologi Bandung (ITB), Jl. Ganesha 10, Bandung 40312, Jawa Barat, Indonesia
cResearch Centre for Raw Material for Medicine and Traditional Medicine, National Research and Innovation Agency (BRIN), Kawasan PUSPIPTEK, Serpong, Tangerang Selatan 15314, Banten, Indonesia
dBRIN and ITB Collaboration Research Center for Biosensor and Biodevices, Jl. Ganesha 10, Bandung 40132, Jawa Barat, Indonesia
eResearch Centre for Telecommunications, National Research and Innovation Agency (BRIN), Komplek LIPI Gd. 20, Jl. Cisitu Lama, Dago, Kecamatan Coblong, Bandung 40135, Jawa Barat, Indonesia
First published on 3rd August 2022
Abstract
This study reports for the first time the surface modification of fluorescent nanoparticles derived from geothermal silica precipitate with Escherichia coli (E. coli) antibody. The immobilization of biomolecules on the inorganic surface has been carried out using two different pathways, namely the silanization and hydrosilylation reactions. The former applied (3-aminopropyl)triethoxysilane (APTES) as the crosslinker, while the latter used N-hydroxysuccinimide coupled with N-ethyl-N′-(3-dimethyl aminopropyl) carbodiimide hydrochloride (EDC/NHS). Fourier transform infrared (FTIR) spectroscopy, field emission scanning electron microscopy with energy dispersive X-ray spectroscopy (FESEM-EDX), and fluorescence spectroscopy were used to confirm the chemical, physical, and optical properties of the surface-modified fluorescent silica nanoparticles (FSNPs). Based on the results of the FTIR, fluorescence spectroscopy and stability tests, the modified FSNPs with EDC/NHS with a ratio of 4![[thin space (1/6-em)]](https://www.rsc.org/images/entities/char_2009.gif) :
:![[thin space (1/6-em)]](https://www.rsc.org/images/entities/char_2009.gif) 1 were proven to provide the optimum results for further conjugation with antibodies, affording the FSNP-Ab2 sample. The FSNP-Ab2 sample was further tested as a nanoplatform for the fluorescence-quenching detection of E. coli, which provided a linear range of 102 to 107 CFU mL−1 for E. coli with a limit of detection (LoD) of 1.6 × 10² CFU mL−1. The selectivity of the biosensor was observed to be excellent for E. coli compared to that for P. aeruginosa and S. typhimurium, with reductions in the maximum fluorescence intensity at 588 nm of 89.22%, 26.23%, and 54.06%, respectively. The inorganic nanostructure–biomolecule conjugation with optimized coupling agents showed promising analytical performance as a selective nanoplatform for detecting E. coli bacteria.
1 were proven to provide the optimum results for further conjugation with antibodies, affording the FSNP-Ab2 sample. The FSNP-Ab2 sample was further tested as a nanoplatform for the fluorescence-quenching detection of E. coli, which provided a linear range of 102 to 107 CFU mL−1 for E. coli with a limit of detection (LoD) of 1.6 × 10² CFU mL−1. The selectivity of the biosensor was observed to be excellent for E. coli compared to that for P. aeruginosa and S. typhimurium, with reductions in the maximum fluorescence intensity at 588 nm of 89.22%, 26.23%, and 54.06%, respectively. The inorganic nanostructure–biomolecule conjugation with optimized coupling agents showed promising analytical performance as a selective nanoplatform for detecting E. coli bacteria.
Introduction
Fluorescent silica nanoparticles (FSNPs) are desirable because of their abundant potential use in diagnosis and detection. This nanostructure has been applied in describing tumors,1 probing ligand–receptor interactions,2,3 deoxyribonucleic acid (DNA) microarrays,4 immunofluorescence techniques,5 analog fluorescent detection,6 network imaging,7 cell imaging,8 and pathogen detection.9–11 The fluorescent nanostructure provides excellent performance for optical-based detection since it possesses improved photostability and fluorescence lifetime compared to fluorogenic organic compounds such as rhodamine B12. Silica generated from the precipitate of geothermal power plants has been used as one of the precursors in the development of fluorescent silica nanoparticles. As reported in our previous work, FSNPs were synthesized from amorphous silica precipitate by the sol–gel method, followed by incorporating an organic dye, which is conducted at low temperature.13 This process gives added value to the amorphous silica as it is converted into cost-efficient and environmentally friendly advanced nanomaterials. Nature-based nanomaterials serve as perfect substitutes compared to those derived from commercial precursors.Biosensors (e.g., DNA sensors and antibody-based biosensors) have been considered an alternative to cope with the problems of conventional assay methods,14–18 providing advantageous properties such as rapid response time, high sensitivity and selectivity in various environments. FSNPs modified with the appropriate receptor have been widely developed as nanoplatforms for biosensors.19,20 The surface chemistry of the silica surface can be easily fine-tuned prior to the immobilization of biomolecules, generating biosensors with enhanced selectivity. Hence, the presence of various functional groups such as amino, carboxyl, thiol, and methacrylate on the silica surface is mandatory. In addition, surface modification is required to reduce the oxidative hydrolysis of FSNPs by water, as sensing experiments are mostly carried out in aqueous solutions.21
Silanization and hydrosilylation reactions are widely used for silica surface modification prior to the conjugation of biomolecules. Silanization allows for surface functionalization through the covalent bond between the silanol groups on the surface and a coupling agent. This reaction significantly reduces the oxidative hydrolysis of the FSNPs, thereby increasing their stability in aqueous solutions.12 Silane coupling agents (e.g., APTES) are commonly used to provide a stable bond between the surfaces of FSNPs and organic molecules or biomolecules. The silanization reaction on the surface of FSNPs is carried out at room temperature and lasts from a few minutes to hours.22,23 The amino-silane APTES is used to prepare a silane layer on a silanol surface to immobilize biomolecules with a linker such as glutaraldehyde (GTA) to generate aldehyde functional groups.11,24 The aldehyde group at one end of GTA reacts with the amine group from the silane layer on the nanostructure surface. In contrast, the other aldehyde group of GTA reacts with the amine group of biomolecules such as antibodies.25
A previous study used APTES as a silane agent to produce alumina monoliths.26 The sol-gel method was used in this work by optimizing the silanization parameters such as temperature, pH, humidity (% RH), initial precursor concentration, and the number of coatings to obtain a monolith with the most preferred characteristics. The resulting alumina monolith was used for protein separation. Alias et al. (2018) also investigated the effect of APTES silanization on the surface roughness of silicon-on-insulator (SOI) wafers.27 Their work aimed to explore the surface roughness due to the good hydrophilic effect of APTES on SOI wafers. Gold nanoparticles (AuNPs) attached to the surface of SOI wafers were used to confirm the presence of APTES.
The surface modifications of FSNPs by silanization are promising for modifying antibodies on the surface for further bacterial detection applications.15,28 Chen et al. (2015) reported a rapid E. coli detection method based on fluorescent nanoparticles using flow cytometry.10 Silica nanoparticles (SNPs) were modified with fluorescein isothiocyanate (FITC) dye and APTES and subsequently polymerized with carboxyethylsilanetriol sodium salt. The modified SNPs were functionalized with rabbit E. coli O157:H7 antibody to recognize E. coli O157:H7 selectively. This method detected E. coli O157:H7 in buffer and bacterial mixture. E. coli O157:H7 detection was also carried out by Song et al. (2021) by developing carbon dot-encapsulated silica nanospheres (CSNs) using a facile one-pot synthetic method.9 The CSN surface was also modified using APTES, and the limit of detection (LoD) of E. coli O157:H7 was 2.4 CFU mL−1.
Hydrosilylation is a reaction involving the attachment of an alkene or alkyne to an inorganic surface, referring to the addition of a silicon–hydrogen bond across a carbon–carbon double bond and forming both valid hydrogen–carbon and silicon–carbon bonds.29 This reaction is carried out via the thermal, catalytic, or photochemical reaction of alkene or alkyne chains with a hydride-terminated silicon surface.30 To avoid the formation of silicon oxide during the monolayer formation, the hydroxylation reaction must be performed in an inert atmosphere with completely deoxygenated and dried reagents. The hydrosilylation reaction generally involves a subsequent reaction with NHS coupled with EDC.31
Khaldi et al. (2017) immobilized the acetylcholinesterase (AChE) enzyme on the surface of porous silicon (pSi) using EDC/NHS.30 The pSi surface was activated with EDC/NHS and then reacted with the amino group of the lysine residue of AChE by amide bonds. FTIR spectroscopy confirmed the efficiency of the pSi surface after modification with EDC/NHS. Enzyme immobilization was also studied by Lasmi et al. (2018) on pSi surfaces.32 The tyrosinase enzyme was used to detect the presence of phenol. pSi was reacted with undecylenic acid via hydrosilylation to obtain pSi-COOH, which was subsequently activated by EDC/NHS to form succinimidyl esters (pSi-COOSuc). Furthermore, this compound reacts with the amine group of the lysine residue in tyrosinase, and an amidase reaction occurs.
The surface modification of the nanostructured surface through the hydrosilylation reaction provides a different approach for bacterial detection. Carrillo-Carrion et al. (2011)28 synthesized CdSe/ZnS QD (Colis-QD) nanoparticles, which fluoresced brightly and were used as E. coli-sensitive sensors. The surface modifications of carboxylic-capped QDs with colistin through an amide bond were performed using EDC, NHS, and Colis-QDs. Under the optimum conditions, this method resulted in a LoD of 28 E. coli cells per mL with an analysis time of less than 15 minutes.
Studies on the selectivity towards E. coli using antibody modified nanoplatforms have been carried out previously. Song et al. (2021) fabricated carbon dot-encapsulated silica nanospheres9 to measure the disturbance intensity associated with seven foodborne pathogen varieties, including L. monocytogenes, S. enteritidis, S. aureus, S. paratyphi B, S. typhimurium, and C. albicans, each present at a concentration of 103 CFU mL−1. Only the E. coli O157:H7 sample produced strong and significant fluorescence intensity using the same capture antibodies. Meanwhile, Thakur et al. (2018) reported the fabrication of a thermally reduced graphene oxide-based field-effect transistor (rGO FET) passivated with an ultrathin layer of Al2O3 for the real-time detection of E. coli bacteria and used gold nanoparticles (AuNPs) as the anchoring sites.33 The E. coli antibody anchored on the surface of AuNPs selectively captured E. coli cells. This study employed mixed bacteria such as S. typhimurium and S. pneumonia with E. coli. The presence of bacteria other than E. coli did not influence the signal; hence, the sensor is specific to E. coli.
This study aims to modify fluorescent silica nanoparticles (FSNPs) derived from geothermal power plant precipitate with E. coli antibodies through two pathways: the silanization and hydrosilylation reaction using the crosslinkers APTES/GTA (Scheme 1) and EDC/NHS (Scheme 2), respectively. The chemical, physical and optical properties of the modified nanoparticles were compared and optimized. Subsequently, the modified FSNPs were conjugated with E. coli antibodies and further applied for the selective detection of E. coli bacteria. The methodology is elaborated in the ESI.†
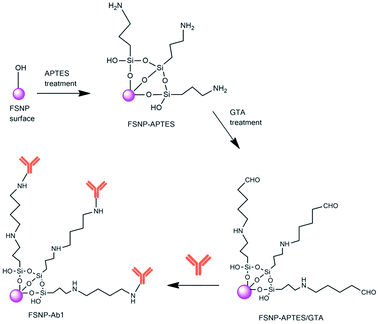 | ||
| Scheme 1 Reaction mechanism of the FSNPs with antibodies via silanization with APTES and GTA (FSNP-Ab1). | ||
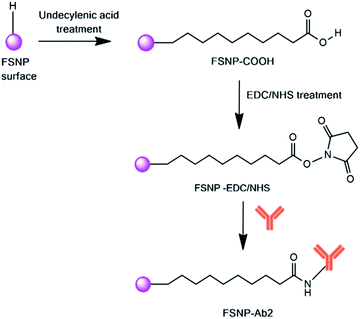 | ||
| Scheme 2 Reaction mechanism of the FSNPs modified with antibodies via hydrosilylation with undecylenic acid and EDC/NHS. | ||
Results and discussion
Optical and morphological properties of fluorescent silica nanoparticles (FSNPs)
The synthesis of FSNPs follows the synthesis of silica nanoparticles (SiNPs) with the addition of a fluorescent substance, i.e., rhodamine B (RB), by the sol–gel method.21 The silica precursor used in this study was derived from amorphous geothermal silica, and the FSNPs were obtained using the sol–gel synthetic method, as previously reported.13 The maximum fluorescence intensity of the FSNPs was measured at an excitation wavelength of 545 nm in a wavelength range of 550–750 nm. The optical properties of the FSNPs were compared with those of unmodified silica (SiNPs) and RB with the same concentration of 5 × 10⁻⁵ M. The maximum intensities of the FSNPs and RB at 588 nm were observed at 635.9 and 101 a.u., respectively (Fig. 1a). The results show that the FSNPs have a 6-fold higher emission than RB. The results of the surface area analysis using the BET calculation method show that the FSNPs were mesoporous with an average size of 43.84 nm, a surface area of 136.84 m2 g−1, a pore volume of 1.23 cm3 g−1, and a pore size of 36.10 nm (ESI, Fig. S1†). The XRD pattern of the FSNPs showed a SiO2 amorphous peak at 2θ = 22° and a SiO2 cristobalite peak at 2θ = 45°. The SiO2 amorphous peak indicated the presence of an organic compound bound to silica oxide, namely RB (ESI, Fig. S2†).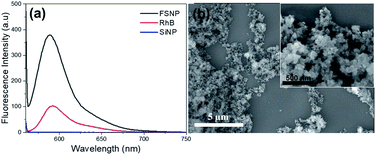 | ||
| Fig. 1 Fluorescence spectra of the FSNPs (black), RB (red), SiNPs (blue) (a); and FESEM micrograph of the FSNPs (b). | ||
Fig. 1b shows a FESEM image of the FSNPs in this study. The synthesized FSNPs were spherical and had a narrow size distribution below 100 nm, confirming the results from the BET calculation. Similarly, several studies also obtained silica nanoparticles with a size range of 50–200 nm.11,34,35 The EDX results (ESI, Fig. S3†) confirm strong signal features of elemental silica (84.3 wt%). The silica nanoparticles displayed an optical absorption band peak at approximately 1.8 keV. The EDX results reveal the presence of oxygen (10.4 wt%), carbon (5.3 wt%), and nitrogen (0.1 wt%), confirming the elements from RB.
Surface passivation of the FSNPs with crosslinking agents
The surface modification of FSNPs in this study was optimized by comparing two different surface reactions, as previously mentioned in the methodology (ESI†). The silanization and hydrosilylation reactions were applied with the appropriate crosslinkers to further anchor the E. coli antibody onto the surface of the silica nanostructures.The FTIR results for the modified FSNPs via silanization reaction are shown in Fig. 2. The black spectrum corresponds to the FSNPs, where absorption at 468 cm−1 derived from the siloxane group, Si–O–Si, is observed. This confirms that silica was formed in the sample. The absorption peak at 800 cm−1 was assigned to the Si–O asymmetric vibration of siloxane, while the absorption at 1631 cm−1 indicated the presence of O–H vibrations from the silanol group. The FSNP-APTES spectrum (blue spectrum) showed absorption in the area of 2800–2890 cm−1, indicating CH2 bonds, and an area of 1400–1700 cm−1 assigned to the NH2 bond, both confirming that aminosilane was modified onto the surface of the nanoparticles. The peak at 1154 cm−1 was assigned to the APTES polymerization. The FSNP-APTES-GTA spectrum (red spectrum) showed a specific peak in the range of 1200–1500 cm−1, indicating the presence of the C–N, C–O, and C–C groups of glutaraldehyde, related to the formation of amide bonds between APTES and glutaraldehyde.22,36
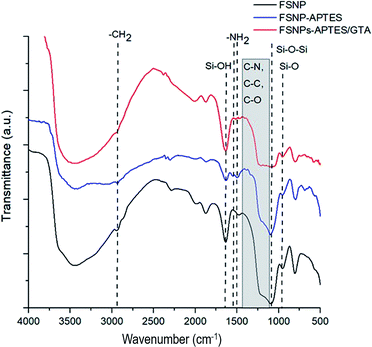 | ||
| Fig. 2 FTIR spectra of the fluorescent silica nanoparticles, FSNPs (black), FSNPs after silanization, FSNP-APTES (blue), and silanized FSNPs after reaction with glutaraldehyde, FSNP-APTES-GTA (red). | ||
Fig. 3 shows the FTIR spectrum of the FSNPs modified through the hydrosilylation reaction. The black spectrum exhibits bands at 2100 cm−1, which is attributed to the Si–H stretching mode of the FSNPs. The successful reaction with undecylenic acid to graft the carboxylic acid functional group on the silica surface was indicated by a peak at 1712 cm−1 in the FSNP-COOH spectrum (blue spectrum) associated with the presence of the C![[double bond, length as m-dash]](https://www.rsc.org/images/entities/char_e001.gif) O stretching bond of carboxylic acid. In addition, the peaks at 2854 and 2927 cm−1 indicated the presence of the C–H stretching group derived from undecylenic acid. The peak at 3669 cm−1 revealed the existence of oxygen-related bonding. After the reaction with EDC and NHS, the same peak remained visible despite the decreasing intensity of the N–O peaks at 1108 cm−1 shown in the FSNP-EDC/NHS spectrum (red spectrum). This indicated that the carboxylic acid group had reacted with the EDC and NHS crosslinkers.31,37
O stretching bond of carboxylic acid. In addition, the peaks at 2854 and 2927 cm−1 indicated the presence of the C–H stretching group derived from undecylenic acid. The peak at 3669 cm−1 revealed the existence of oxygen-related bonding. After the reaction with EDC and NHS, the same peak remained visible despite the decreasing intensity of the N–O peaks at 1108 cm−1 shown in the FSNP-EDC/NHS spectrum (red spectrum). This indicated that the carboxylic acid group had reacted with the EDC and NHS crosslinkers.31,37
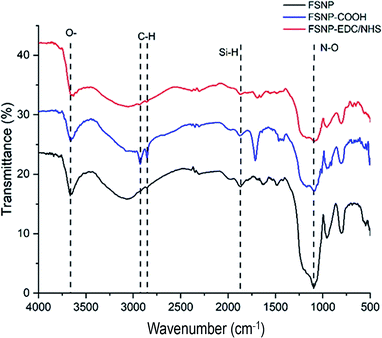 | ||
| Fig. 3 FTIR spectra of the fluorescent silica nanoparticles, FSNPs (black), FSNPs after hydrosilylation, FSNP-COOH (blue), and FSNPs after reaction with crosslinkers, FSNP-EDC/NHS (red). | ||
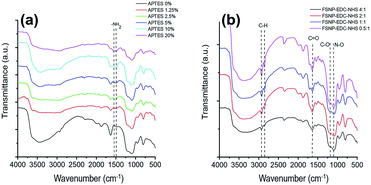
We further optimized the concentration of the crosslinkers on the surface of the FSNPs by varying the concentrations of APTES and EDC/NHS in both reactions. The FTIR spectra for FSNP-APTES at different concentrations in the range of 1400–1700 cm−1 assigned to the NH2 bond were compared. Fig. 4a shows that APTES at a concentration of 10% w/v had the sharpest NH2 transmittance peak compared to the other concentration variations. Thus, APTES 10% w/v was used to immobilize E. coli antibodies in the subsequent reaction.
For the optimization of EDC/NHS on the silica surface, it was expected that the N–O peaks from succinimidyl ester at 1108 cm−1 disappeared as the ratio increased (Fig. 4b). An absorption peak appeared at 1200 cm−1, attributed to the C–O of EDC/NHS. The absorption peaks at 2854 and 2927 cm−1 attributed to the C–H bond and the peak at 1712 cm−1 assigned to C![[double bond, length as m-dash]](https://www.rsc.org/images/entities/char_e001.gif) O were still observed.
O were still observed.
The fluorescence intensity at 588 nm of the FSNP-APTES and FSNP-EDC/NHS samples at different concentrations was then examined prior to reaction with the E. coli antibody. The fluorescence spectra of both samples are shown in Fig. 5. After modification with APTES, the FSNP-APTES sample obtained the highest intensity when modified with an APTES concentration of 10% w/v (Fig. 5a). The fluorescence intensity decreased when the APTES concentration was increased over 10% w/v. Hence, this result corroborates the optimized FTIR results of the FSNP-APTES samples above.
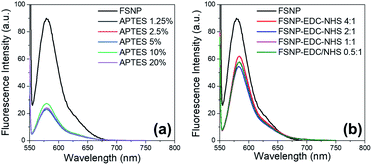 | ||
| Fig. 5 Fluorescence spectra of the FSNPs with the modification of APTES (a) and EDC/NHS (b) at various concentrations. | ||
As shown in Fig. 5b, the fluorescence intensity of the FSNPs slightly changed after functionalization with EDC/NHS from 90.03 a.u. to 62.06 a.u., meaning that the EDC/NHS crosslinker addition maintained the optical properties of the FSNPs. From Fig. 5, it can be seen that the fluorescence intensity of the FSNPs functionalized with EDC/NHS was preferable to that functionalized with APTES. Moreover, the results of the fluorescence spectrophotometry analysis show that EDC/NHS with a ratio of 4![[thin space (1/6-em)]](https://www.rsc.org/images/entities/char_2009.gif) :
:![[thin space (1/6-em)]](https://www.rsc.org/images/entities/char_2009.gif) 1 had the highest fluorescence intensity compared to the other ratios, which justifies the FTIR results of FSNP-EDC/NHS in Fig. 4.
1 had the highest fluorescence intensity compared to the other ratios, which justifies the FTIR results of FSNP-EDC/NHS in Fig. 4.
The fluorescence stability of the modified nanostructured silica was further observed before being applied as a fluorescence-based biosensor. The fluorescence stability experiment was carried out at room temperature, and the fluorescence intensity at 588 nm was measured for 120 minutes with an increment of 15 minutes. The fluorescence intensity of FSNP-APTES with a concentration of 10% w/v showed a slight change after 120 minutes (Fig. 6a). The results of the fluorescence intensity were compared to those of APTES with ratios of 1.25, 2.5, 5 and 20% w/v (ESI, Fig. S4†). The fluorescence intensity at 588 nm of FSNP-APTES decreased after 60–75 minutes; hence, less photostability occurred on the samples.
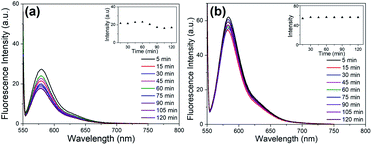 | ||
Fig. 6 Fluorescence spectra of FSNP-APTES (10%) (a) and FSNP-EDC/NHS (4![[thin space (1/6-em)]](https://www.rsc.org/images/entities/char_2009.gif) : :![[thin space (1/6-em)]](https://www.rsc.org/images/entities/char_2009.gif) 1) (b) over 120 minutes with an increment of 15 minutes. The inset shows the fluorescence intensity at 588 nm over 120 minutes. 1) (b) over 120 minutes with an increment of 15 minutes. The inset shows the fluorescence intensity at 588 nm over 120 minutes. | ||
In contrast, the fluorescence intensity at 588 nm of FSNP-EDC/NHS was observed to be stable at all ratios (ESI, Fig. S4†). EDC/NHS with a ratio of 4![[thin space (1/6-em)]](https://www.rsc.org/images/entities/char_2009.gif) :
:![[thin space (1/6-em)]](https://www.rsc.org/images/entities/char_2009.gif) 1 showed the best stability result compared to the other ratios after 120 minutes, as shown in Fig. 6b. This indicates that EDC/NHS with a ratio variation was preferable to APTES as a crosslinker in terms of fluorescence stability.
1 showed the best stability result compared to the other ratios after 120 minutes, as shown in Fig. 6b. This indicates that EDC/NHS with a ratio variation was preferable to APTES as a crosslinker in terms of fluorescence stability.
Immobilization of antibodies
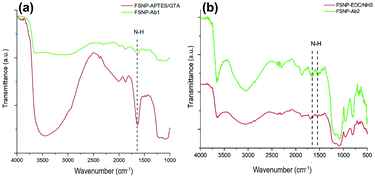
Having successfully modified the FSNPs with two different crosslinkers, the FSNP-APTES and FSNP-EDC/NHS samples were subsequently immobilized with E. coli antibodies following Schemes 1 and 2, respectively. The purpose of antibody attachment on the nanoparticle surface was to increase the selectivity and sensitivity of E. coli detection.35 As shown in Scheme 1, the aldehyde group on the FSNP-APTES/GTA sample reacted with the amine group of the antibody and formed FSNP-Ab1. Fig. 7a shows the FTIR spectra of FSNP-APTES before and after immobilization with the E. coli antibody. The FSNP-Ab1 spectrum (green spectrum) shows peaks assigned to the amide group in the range of 1630–1697 cm−1, indicating that the antibody was covalently bound to the FSNP-APTES/GTA surface.In contrast to silanization, the hydrosilylation reaction with the assistance of undecylenic acid produced a carboxylic acid group on the FSNP surface (FSNP-COOH), as shown in Scheme 2. With the EDC/NHS activation, the succinimidyl ester was reacted with the amine group on the E. coli antibody to form FSNP-Ab2. The formed conjugate had a stable amide bond, releasing NHS as a by-product. Fig. 7b shows the spectra of FSNP-EDC/NHS before and after conjugation with the antibody. The immobilization was successful, as shown in the FSNP-Ab2 spectrum (green spectrum), which showed the presence of an amide (N–H) covalent bond with absorption peaks at 1600 cm−1 and 1550 cm−1.38
Application of FSNP-Ab2 for E. coli detection
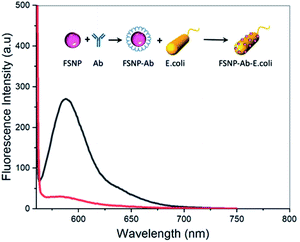
Based on the results of surface modification, intrinsic properties, and photostability tests of the modified FSNPs, the FSNP-Ab2 sample was applied as a biosensing nanoplatform to detect E. coli. The detection mechanism of FSNP-Ab2 in the presence of E. coli bacteria follows that of our previous work.21 Optical detection was observed due to the fluorescence-quenching effect of the fluorescent nanoparticles, which is later stated as the fluorescence intensity loss percentage or % Iloss. The maximum fluorescence intensity of FSNP-Ab2 at 588 nm was initially 269 a.u. (Fig. 10, red spectrum). Upon incubation with E. coli for 15 minutes, the fluorescent intensity of the nanoparticles decreased with a % Iloss of 89.22%, indicating that the nanoparticles had indeed detected the presence of E. coli in the buffer solution (Fig. 8, red spectrum).The morphology of the FSNPs upon surface modification and detection of E. coli is shown in Fig. 9. The FESEM image of FSNP-Ab2 shows that the conjugation with the antibody did not change the size and shape of the FSNPs, ranging below 100 nm (Fig. 9a). The EDX results of FSNP-Ab2 confirmed the presence of silica (81.9 wt%) as well as oxygen (11.3 wt%), carbon (6.9 wt%), and nitrogen as a result of the immobilized antibody on the nanoparticle surface (ESI, Fig. S7†). After incubation with E. coli bacteria for 15 minutes, the FESEM results show that there were antibody-conjugated FSNPs covering the bacteria (Fig. 9b inset). Furthermore, the EDX results confirm the presence of E. coli as indicated by the increased proportions of carbon and oxygen of 40 and 30.6 wt%, respectively (ESI, Fig. S7†). These results are comparable to the work by Chitra and Annadurai (2003), which showed the SEM results of E. coli covered with antibody-conjugated silica NPs bound to the bacterial cell.11 The cell wall of E. coli consists of an outer membrane mostly composed of phospholipids, proteins, fatty polysaccharides and a reticular peptidoglycan layer, allowing for the amphoteric properties of E. coli. This amphoteric attribute causes E. coli to have a negatively charged wall in alkaline or neutral solutions; hence, the bacteria absorb fluorescent molecules such as rhodamine 6G on their surface due to the electrostatic force between the E. coli and the organic dye.37 As Gram-negative bacteria, E. coli produce lipopolysaccharides (LPS) on their surface,39 which will bind to specific antibodies through hydrogen bonds and van der Waals interactions.35,40 The E. coli antibodies anchored on the nanoparticle surface specifically recognized the LPS in E. coli. Hence, hydrogen bond and van der Waals interactions occurred between the surface of the FSNP-Ab2 and the cell wall of E. coli. The FESEM results in Fig. 9b corroborate the nanoparticle's attachment to the bacteria. This interaction caused a decrease in the fluorescence intensity of FSNP-Ab2, as shown in Fig. 8. This fluorescence-quenching mechanism is proposed as the basic principle of E. coli detection using FSNP-Ab2 nanoparticles.
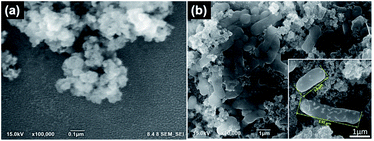 | ||
| Fig. 9 FESEM micrographs of FSNP-Ab2 (a) and E. coli after incubation with FSNP-Ab2 (b, and the inset). | ||
Analytical performance of FSNP-Ab2 as a biosensing platform
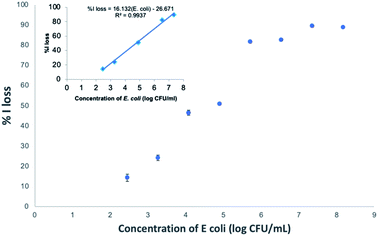
To evaluate the analytical performance of FSNP-Ab2 as a biosensing platform for the detection of E. coli, the sensitivity and selectivity of the antibody-conjugated fluorescent nanoparticles were studied. The former parameter was obtained by exposing the modified FSNPs to E. coli at various concentrations. The latter was observed by comparing the performance of FSNP-Ab2 towards E. coli and other Gram-negative bacteria.The sensitivity test of FSNP-Ab2 was tested in PBS by observing the decrease in the fluorescence intensity of the nanoparticles in the presence of bacteria. The incubation of FSNP-Ab2 with E. coli was conducted for 15 minutes, and the concentration of E. coli in PBS was varied in the range of 102 to 109 CFU mL−1. Fig. 10 shows a linear correlation in the range of 102 to 107 CFU mL−1 (% Iloss = 16.132![[thin space (1/6-em)]](https://www.rsc.org/images/entities/char_2009.gif) log (E. coli) − 26.671; (R2 = 0.9937)). The limit of detection (LoD) was obtained at 1.5 × 10² CFU mL−1, calculated with the equation yb + 3Stdb, with yb representing the average fluorescence intensity loss measured for the blank control and Stdb representing the associated standard deviation.41 Compared to previous reports, the LoD for the E. coli detection obtained from this work was lower than that using a gold nanocluster functionalized with lysosomes, which obtained an LoD of 2 × 10⁴ CFU mL−1.38 Table 1 compares the linear ranges and LoDs of several methods for E. coli detection.
log (E. coli) − 26.671; (R2 = 0.9937)). The limit of detection (LoD) was obtained at 1.5 × 10² CFU mL−1, calculated with the equation yb + 3Stdb, with yb representing the average fluorescence intensity loss measured for the blank control and Stdb representing the associated standard deviation.41 Compared to previous reports, the LoD for the E. coli detection obtained from this work was lower than that using a gold nanocluster functionalized with lysosomes, which obtained an LoD of 2 × 10⁴ CFU mL−1.38 Table 1 compares the linear ranges and LoDs of several methods for E. coli detection.
| Method | Receptor | Linear range (CFU mL−1) | LoD (CFU mL−1) | Selectivity of the biosensing platform towards other bacteria | Ref. |
|---|---|---|---|---|---|
| Organic dye coated with antibody | Monoclonal antibodies specific to E. coli | 10–104 | 5 | S. typhimurium and L. monocytogenes | 43 |
| UCNPs coated with aptamer | E. coli aptamer | 58–58 × 106 | 10 | Not mentioned | 44 |
| Immunomagnetic | Anti-E. coli antibodies | Not mentioned | 2.4 × 10⁴ | Salmonella enterica serovar Typhimurium and staphylococcal enterotoxin B (SEB) | 45 |
| CSN-based immunosorbents assays | Anti-E. coli antibodies | 0–104 | 2.4 | L. monocytogenes, S. enteritidis, S. aureus, S. paratyphi B, S. typhimurium, and C. albicans | 9 |
| G-FETs sensors | Anti-E. coli antibodies | 5 × 10³ to 5 × 10⁵ | 5 × 10³ | Not mentioned | 46 |
| Anti-E. coli/AuNPs/Al2O3/rGO/FET sensor device | Anti-E. coli antibodies | 103 to 109 | 103 | S. typhimurium and S. pneumoniae | 33 |
| Fluorescence of R6G-dyeing | Not mentioned | 2–88 | 2 | B. subtilis and S. aureus | 37 |
| Fluorescence of SNP-RB | None | 10–105 | 8 | Dead E. coli, Pseudomonas sp., B. subtilis, and S. aureus | 21 |
| Fluorescence of FSNP-Ab2 | E. coli antibody | 102 to 107 | 1.6 × 10² | P. aeruginosa and S. typhimurium | This paper |
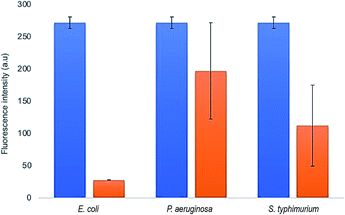
The selectivity of FSNP-Ab2 towards E. coli was tested by comparing the decrease in the fluorescence intensity of the nanoparticles in the presence of two other Gram-negative bacteria, P. aeruginosa and S. typhimurium. The concentrations of all bacteria were adjusted to 107 CFU mL−1, and the incubation with FSNP-Ab2 was performed for 15 minutes. The three-time rinsing treatment by centrifugation was expected to remove free bacteria that did not bind to FSNP-Ab2. The immobilization of E. coli antibodies on the nanoparticle surface instigated an increased selectivity during the detection test. This was indicated by the decrease in the fluorescence intensity of FSNP-Ab2 in the presence of E. coli, which is greater than that with P. aeruginosa and S. typhimurium by 3 and 2 times, respectively, as shown in Fig. 11. The significant decrease in fluorescence due to the presence of antibodies was noteworthy when compared to our previous work without antibodies.21
The immobilization of receptors such as antibodies on nanostructures has been proven to increase selectivity. Typically, antibodies have a high affinity for a particular sequence of amino acids, i.e., specific epitopes.42 The antibody on FSNP-Ab2 is specifically bound to the unique antigenic site of E. coli bacteria,39 resulting in a significant % Iloss compared to other Gram-negative bacteria. The result in this work is comparable to that of Cho et al. (2014), which also presented a simple fluorometric immunological method on magnetic beads functionalized with antibodies that were used for the detection of E. coli.43 In that study, the selectivity of E. coli detection was compared with that for Salmonella typhimurium and Streptococcus pneumoniae, and the results were only specific for E. coli without cross reactivity. Saad et al. (2020) synthesized gold nanoparticles (AuNPs) modified with carbon dots (CDs) for E. coli O157:H7 detection.47 In that work, the selectivity for E. coli O157:H7 was tested and compared to that for Salmonella enteritidis and Listeria monocytogenes. As a result, there was a change in the fluorescence intensity towards E. coli O157:H7, Salmonella enteritidis and Listeria monocytogenes by 93.49 ± 1.15%, 80.95 ± 5.69%, and 84.16 ± 3.38%, respectively. The selectivity of this work was found to be slightly higher compared to that of Saad et al. (2020); hence, the FSNP-Ab2 in this work offers excellent selectivity for detecting E. coli. The results provide a proof-of-concept for E. coli detection on antibody-modified nature-based nanoparticles through fluorescence-quenching. The detection was conducted in buffer solution containing E. coli and other Gram-negative bacteria. The selective detection employing antibody-modified FSNPs using stable coupling agents shows advantages over other sensing nanoplatforms, as shown in Table 1.
Conclusions
The immobilization of antibodies on the fluorescent silica nanoparticle surface through two different reactions, i.e., silanization and hydrosilylation using the crosslinkers APTES/GTA and EDC/NHS, respectively, has been successfully carried out. The crosslinkers were varied, and the FTIR results confirmed that APTES 10% (w/v) and an EDC/NHS ratio of 4![[thin space (1/6-em)]](https://www.rsc.org/images/entities/char_2009.gif) :
:![[thin space (1/6-em)]](https://www.rsc.org/images/entities/char_2009.gif) 1 were the optimal concentrations in each reaction. Based on the results of FTIR, fluorescence spectroscopy, and photostability experiments after modification with the antibody, the FSNP-Ab2 sample with immobilization through hydrosilylation was selected as the biosensing platform for detecting E. coli bacteria. The interaction of FSNP-Ab2 in the presence of E. coli bacteria was confirmed by the decrease in fluorescence intensity and later corroborated by the FESEM-EDX results. The FSNP-Ab2 sample was proven to perform as an E. coli biosensor with a linear range of 102 to 107 CFU mL−1 and a LoD of 1.6 × 10² CFU mL−1. The biosensor also showed enhanced selectivity towards E. coli compared to P. aeruginosa and S. typhimurium, with a greater decrease in fluorescence intensity of 3 and 2 times, respectively. The antibody-modified nature-based silica nanoparticles through the hydrosilylation reaction demonstrated here are expected to find applications in point-of-care diagnostics for the detection of E. coli bacteria. Further validation of their performance in real samples, such as food and environmental samples and other complex matrices, is essential for the proper application of such devices.
1 were the optimal concentrations in each reaction. Based on the results of FTIR, fluorescence spectroscopy, and photostability experiments after modification with the antibody, the FSNP-Ab2 sample with immobilization through hydrosilylation was selected as the biosensing platform for detecting E. coli bacteria. The interaction of FSNP-Ab2 in the presence of E. coli bacteria was confirmed by the decrease in fluorescence intensity and later corroborated by the FESEM-EDX results. The FSNP-Ab2 sample was proven to perform as an E. coli biosensor with a linear range of 102 to 107 CFU mL−1 and a LoD of 1.6 × 10² CFU mL−1. The biosensor also showed enhanced selectivity towards E. coli compared to P. aeruginosa and S. typhimurium, with a greater decrease in fluorescence intensity of 3 and 2 times, respectively. The antibody-modified nature-based silica nanoparticles through the hydrosilylation reaction demonstrated here are expected to find applications in point-of-care diagnostics for the detection of E. coli bacteria. Further validation of their performance in real samples, such as food and environmental samples and other complex matrices, is essential for the proper application of such devices.
Author contributions
DAW: data curation, investigation, formal analysis, project administration; AK: data curation, investigation, formal analysis, methodology; AR: formal analysis, investigation, methodology, supervision, validation; RVM: investigation, methodology, validation, writing-review & editing; RTD: investigation, methodology, validation, supervision; ASA: investigation, formal analysis, supervision, writing-original draft; BY: validation, supervision, funding acquisition; SNAJ: conceptualization, formal analysis, funding acquisition, investigation, methodology, supervision, validation, writing-review & editing. SNAJ and ASA are the main contributors for this manuscript.Conflicts of interest
There are no conflicts to declare.Acknowledgements
The authors would like to acknowledge funding from the JFS SEA-EU/LPDP NAPARBA Project Grant No. SEAEUROPEJFS19ST-117 and the BRIN-ITB Collaboration Research Centre for Biosensors and Biodevices Grant No. 01/PKR/PPK-DFRI/2022; 220/1T1.B07/KS.00/2022. The authors would also like to thank the Mineral Processing Research Group of Chemical Engineering Department, Universitas Gadjah Mada, and acknowledge the facilities, scientific and technical support from Advanced Characterization Laboratories Serpong, National Research and Innovation Agency (BRIN) through E-Layanan Sains, Badan Riset dan Inovasi Nasional.References
- J. R. Lakowicz, Protein fluorescence, in Principles of fluorescence spectroscopy, 2013, Springer, USA, pp. 529–569 Search PubMed.
- Q. Y. Wang and Y. J. Kang, Nanoscale Res. Lett., 2016, 11(1), 1–9 CrossRef CAS PubMed.
- Z. Hu, J. Tan, Z. Lai, R. Zheng, J. Zhong, Y. Wang, X. Li, N. Yang, J. Li, W. Yang, Y. Huang, Y. Zhao and X. Lu, Nanoscale Res. Lett., 2017, 12(1), 1–8 CrossRef CAS PubMed.
- X. Zhou and J. Zhou, Anal. Chem., 2004, 76(18), 5302–5312 CrossRef CAS PubMed.
- W. Lian, S. A. Litherland, H. Badrane, W. Tan, D. Wu, H. V. Baker, P. A. Gulig, D. V. Lim and S. Jin, Anal. Biochem., 2004, 334(1), 135–144 CrossRef CAS PubMed.
- L. M. Rossi, L. Shi, F. H. Quina and Z. Rosenzweig, Langmuir, 2005, 21(10), 4277–4280 CrossRef CAS PubMed.
- S. Santra, H. Yang, D. Dutta, J. T. Stanley, P. H. Holloway, W. Tan, B. M. Moudgil and R. A. Mericle, Chem. Commun., 2004,(24), 2810–2811 RSC.
- I. Sokolov and S. Naik, Small, 2008, 4(7), 934–939 CrossRef CAS PubMed.
- Y. Song, G. P. Ostermeyer, D. Du and Y. Lin, Sens. Actuators, B, 2021, 349, 130730 CrossRef CAS.
- Z.-Z. Chen, L. Cai, M.-Y. Chen, Y. Lin, D.-W. Pang and H.-W. Tang, Sens. Actuators, B, 2015, 66, 95–102 CAS.
- K. Chitra and G. Annadurai, J. Nanotechnol., 2013, 2013, 509628 Search PubMed.
- S. N. A. Jenie, S. E. Plush and N. H. Voelcker, Pharm. Res., 2016, 33(10), 2314–2336 CrossRef CAS PubMed.
- A. S. N. Jenie, F. S. H. Krismastuti, Y. P. Ningrum, A. Kristiani, M. D. Yuniati, W. Astuti and H. T. B. M. Petrus, Mater. Express, 2020, 10(2), 258–266 CrossRef.
- H. Kirla, L. Hughes and D. J. Henry, Colloids Surf., B, 2020, 188, 110751 CrossRef CAS PubMed.
- O. Lazcka, F. J. D. Campo and F. X. Muñoz, Biosens. Bioelectron., 2007, 22(7), 1205–1217 CrossRef CAS PubMed.
- C.-C. Su, T.-Z. Wu, L.-K. Chen, H.-H. Yang and D.-F. Tai, Anal. Chim. Acta, 2003, 479(2), 117–123 CrossRef CAS.
- P. B. Luppa, L. J. Sokoll and D. W. Chan, Clin. Chim. Acta, 2001, 314(1–2), 1–26 CrossRef CAS.
- T. S. Hauck, S. Giri, Y. Gao and W. C. W. Chan, Adv. Drug Delivery Rev., 2010, 62(4–5), 438–448 CrossRef CAS PubMed.
- M. T. Hurley, Z. Wang, A. Mahle, D. Rabin, Q. Liu, D. S. English, M. R. Zachariah, D. Stein and P. DeShong, Adv. Funct. Mater., 2013, 23(26), 3335–3343 CrossRef CAS.
- M. Li, J. W. Y. Lam, F. Mahtab, S. Chen, W. Zhang, Y. Hong, J. Xiong, Q. Zheng and B. Z. Tang, J. Mater. Chem. B, 2013, 1(5), 676–684 RSC.
- S. N. A. Jenie, Y. Kusumastuti, F. S. H. Krismastuti, Y. M. Untoro, R. T. Dewi, L. Z. Udin and N. Artanti, Sensors, 2021, 21(3), 881 CrossRef CAS PubMed.
- P. Rokicka-Konieczna, A. Wanag, A. Sienkiewicz, E. Kusiak-Nejman and A. W. Morawski, Catal. Commun., 2020, 134, 105862 CrossRef CAS.
- N. Aissaoui, L. Bergaoui, J. Landoulsi, J.-F. Lambert and S. Boujday, Langmuir, 2012, 28(1), 656–665 CrossRef CAS PubMed.
- N. A. Lapin and Y. J. Chabal, J. Phys. Chem. B, 2009, 113(25), 8776–8783 CrossRef CAS PubMed.
- R. M. Pasternack, S. Rivillon Amy and Y. J. Chabal, Langmuir, 2008, 24(22), 12963–12971 CrossRef CAS PubMed.
- N. Nayak, R. Huertas, J. G. Crespo and C. A. M. Portugal, Sep. Purif. Technol., 2019, 229, 115674 CrossRef CAS.
- N. N. Alias, K. A. Yaacob and C. K. Yew, Mater. Today: Proc., 2019, 17, 700–706 CAS.
- C. Carrillo-Carrión, B. M. Simonet and M. Valcárcel, Biosens. Bioelectron., 2011, 26(11), 4368–4374 CrossRef PubMed.
- T. Hayashi and K. Yamasaki, in 10.18 – C–E Bond Formation through Asymmetric Hydrosilylation of Alkenes. Comprehensive Organometallic Chemistry III, ed. D. M. P. Mingos and R. H. Crabtree, Elsevier, Oxford, 2007, pp. 815–838 Search PubMed.
- K. Khaldi, S. Sam, A. Lounas, C. Yaddaden and N.-E. Gabouze, Appl. Surf. Sci., 2017, 421, 148–154 CrossRef CAS.
- R. Boukherroub, J. T. C. Wojtyk, D. D. M. Wayner and D. J. Lockwood, J. Electrochem. Soc., 2002, 149(2), H59–H63 CrossRef CAS.
- K. Lasmi, H. Derder, A. Kermad, S. Sam, H. Boukhalfa-Abib, S. Belhousse, F. Z. Tighilt, K. Hamdani and N. Gabouze, Appl. Surf. Sci., 2018, 446, 3–9 CrossRef CAS.
- B. Thakur, G. Zhou, J. Chang, H. Pu, B. Jin, X. Sui, X. Yuan, C.-H. Yang, M. Magruder and J. Chen, Biosens. Bioelectron., 2018, 110, 16–22 CrossRef CAS PubMed.
- P. D. K. P. Ananda, A. Tillekaratne, C. Hettiarachchi and N. Lalichchandran, Appl. Surf. Sci. Adv., 2021, 6, 100159 CrossRef.
- X. Zhao, L. R. Hilliard, S. J. Mechery, Y. Wang, R. P. Bagwe, S. Jin and W. Tan, Proc. Natl. Acad. Sci. U.S.A., 2004, 101(42), 15027–15032 CrossRef CAS PubMed.
- N. S. K. Gunda, M. Singh, L. Norman, K. Kaur and S. K. Mitra, Appl. Surf. Sci., 2014, 305, 522–530 CrossRef CAS.
- Y. Wang, C. Jiang, G. Wen, X. Zhang, Y. Luo, A. Qin, A. Liang and Z. Jiang, Luminescence, 2016, 31(4), 972–977 CrossRef CAS PubMed.
- Y. L. Liu, W. L. Fu, C. M. Li, C. Z. Huang and Y. F. Li, Anal. Chim. Acta, 2015, 861, 55–61 CrossRef CAS PubMed.
- B. Bertani and N. Ruiz, EcoSal Plus, 2018, 8(1) DOI:10.1128/ecosalplus.ESP-0001-2018.
- E. Rostova, C. Ben Adiba, G. Dietler and S. K. Sekatskii, Biosensors, 2016, 6(4), 52 CrossRef PubMed.
- F. S. H. Krismastuti, S. Pace and N. H. Voelcker, Adv. Funct. Mater., 2014, 24(23), 3639–3650 CrossRef CAS.
- V. Kumra Ahnlide, T. de Neergaard, M. Sundwall, T. Ambjörnsson and P. Nordenfelt, Front. Immunol., 2021, 12, 1–12 Search PubMed.
- I.-H. Cho, L. Mauer and J. Irudayaraj, Biosens. Bioelectron., 2014, 57, 143–148 CrossRef CAS PubMed.
- H. Li, W. Ahmad, Y. Rong, Q. Chen, M. Zuo, Q. Ouyang and Z. Guo, Food Control, 2020, 107, 106761 CrossRef CAS.
- J. R. Branen, M. J. Hass, E. R. Douthit, W. C. Maki and A. L. Branen, J. Food Prot., 2007, 70(4), 841–850 CrossRef CAS PubMed.
- G. Wu, M. Meyyappan and K. W. C. Lai, Graphene field-effect transistors-based biosensors for Escherichia coli detection, in 2016 IEEE 16th International Conference on Nanotechnology, IEEE-NANO, 2016 Search PubMed.
- S. M. Saad, J. Abdullah, S. Abd Rashid, Y. W. Fen, F. Salam and L. H. Yih, Measurement, 2020, 160, 107845 CrossRef.
Footnote |
| † Electronic supplementary information (ESI) available. See https://doi.org/10.1039/d2ra03143d |
| This journal is © The Royal Society of Chemistry 2022 |

