 Open Access Article
Density-adjusted liquid-phase microextraction with smartphone digital image colorimetry to determine parathion-methyl in water, fruit juice, vinegar, and fermented liquor†
Xinyuan Bia,
Haijuan Jiangbc,
Xingle Guobc,
Min Wangbc,
Yu Niua,
Liyan Jia*bc and
Xu Jing *bc
*bc
aAgricultural Economics and Management College, Shanxi Agricultural University, Taiyuan, Shanxi 030006, China
bCollege of Food Science and Engineering, Shanxi Agricultural University, Taigu, Shanxi 030801, China. E-mail: liyangjia1979@163.com; x.jing@vip.163.com
cGraduate Education Innovation Center on Baijiu Bioengineering in Shanxi Province, Taigu, Shanxi 030801, China
First published on 21st June 2022
Abstract
To achieve rapid and convenient on-site pretreatment and determination of parathion-methyl, a density-adjusted liquid-phase microextraction with smartphone digital image colorimetry was established to detect parathion-methyl in food samples. In this study, the environmentally friendly biomass-derived solvent guaiacol was used as the extractant. Salt and water, as density regulators, realized the two movements (floating–sinking) of the extractant and full contact between the extractant and the sample solution to establish an environmentally friendly, fast, and efficient pretreatment method. Under strong alkaline conditions, parathion-methyl generated a yellow product; then, a smartphone was used to obtain the image of the yellow product for intensity analysis. Parathion-methyl has a good linear relationship in the range of 0.01–1 mg L−1, and the limits of detection and quantification are 0.003 and 0.01 mg L−1, respectively. This method has been successfully applied to the determination of parathion-methyl in spiked water, fruit juice, vinegar, and fermented liquor with a recovery of 91.6–106.5% and a relative standard deviation of 0.6–6.0%. The established density-adjusted liquid phase microextraction with smartphone digital image colorimetry is rapid, convenient, and environmentally friendly for the determination of parathion-methyl in food samples.
1. Introduction
Organophosphate pesticides have been widely applied in agricultural production since their discovery.1 Parathion-methyl is a widely used organophosphate pesticide2 that is related to acute toxicity through inhibiting the enzyme acetylcholinesterase in the nervous system.3 Parathion-methyl is also classified as a toxicity category I (extremely toxic) insecticide by the WHO and U.S. EPA with a median lethal dose (LD50) value of <5 mg kg−1.4,5 The excessive and inappropriate use of parathion-methyl causes the accumulation of pesticides in food products. Therefore, it is challenging and urgent to control parathion-methyl residues. The fast and convenient determination method of parathion-methyl in foods should be exploited to ensure food safety.Liquid phase microextraction (LPME) is an emerging sample preparation technique with the advantages of versatility, adaptability, and low solvent usage.6 However, the extraction solvents used in LPME are usually volatile and flammable and may pose threats to human health. Another disadvantage of LPME is the use of dispersants and auxiliary extraction equipment (microwave,7 ultrasound,8 vortex,9 and stirring). The disadvantages of the use of acetone,10 acetonitrile,11 and methanol12 as dispersants are known to be hazardous to operators and the environment.13 The disadvantage of the use of microwave, ultrasound, vortex, and stirring as auxiliary equipment are known to be inconvenient and unsuitable for on-site detection. Therefore, it is worth paying attention to replacing traditional toxic organic solvents with environmentally friendly alternative solvents and establishing LPME without dispersants and auxiliary equipment.
Ionic liquids and deep eutectic solvents are considered environmentally friendly organic extraction solvents14 compared with carbon tetrachloride, toluene, and hexane in LPME.15,16 However, they require time-consuming synthesis and are easily destroyed during the LPME process. Biomass-derived solvents are liquids obtained from renewable resources,17 which bear the key advantages of being derived from renewable resources.18 They have the advantages of low toxicity, availability, renewability, biodegradability, and reasonable prices.17 Therefore, it is environmentally friendly to use biomass-derived solvents instead of toxic organic solvents.
Methanol, acetonitrile, and acetone are often used as dispersants, which are combined with microwave, ultrasonic, vortex, and stirring equipment to achieve full contact between the extractant and the samples and assist extraction. Emerging extraction methods use the principle of relative movement to achieve full contact between the extractant and the samples, which achieves environmentally friendly, fast, and efficient extraction without the use of dispersants and auxiliary equipment.
If an extractant with a similar density to the sample is designed, the movement of the extractant and full contact of the extractant with the sample solution can be achieved by adjusting the density of the extractant or sample. The biomass-derived solvent guaiacol has similar density to water, so guaiacol can be considered a good choice. There are two main methods for density adjustment: to adjust the density of the extractant and to adjust the density of the sample. The density of the extractant can be changed by adding heavy or light solvents that are miscible with the extractant, but it will increase the volume of organic solvents and decrease the sensitivity of the method. Meanwhile, the density of the sample can be easily adjusted only by adding common salts and water to realize the two movements (floating–sinking) of the extractant and LPME. Therefore, the proposed density-adjusted LPME method is fast and efficient compared to the traditional LPME method.
Current detection methods of parathion-methyl mainly involve gas chromatography,19 high-performance liquid chromatography,20 mass spectrometry,21 and electrochemical methods.22 However, expensive equipment, long analysis times, and well-trained operators are required. Colorimetry has the advantages of simple operation, fast quantification, etc.23 Under strong alkaline conditions, parathion-methyl produces a yellow substance, which is suitable for colorimetry. Emerging digital image colorimetry involves two steps: image acquisition and color readout.24 In recent years, digital image colorimetry has gained attention due to its low cost in rapid real-time quantitative determination. Digital image colorimetry has been used to determine pesticides,25 veterinary drugs,24 and heavy metals.26 Digital image colorimetry can be performed by transferring the captured images into the computer for further analysis by software (e.g., Image J).27 Alternatively, it can be performed by in-built or open-source applications in smartphones (e.g., Color Grab, Photometrix etc.) to directly pick the color data.28 Because smartphone cameras can distinguish small changes in colors with small measurement errors and more accurate results, smartphone are considered an excellent image acquisition tool.29 Smartphone digital image colorimetry (SDIC) often utilizes RGB color space (red, green, and blue), where any color can be divided into the three basic colors and read out by smartphone software.28 It is convenient, fast, low cost, portable, and suitable for on-site analysis30 and has a wide range of application prospects in food analysis.
The purpose of the established method is to realize fast, convenient, and environmentally friendly on-site pretreatment and visual determination of parathion-methyl in food samples. The density-adjusted LPME method was first established and combined with SDIC to quantitatively analyze parathion-methyl in spiked water, fruit juice, vinegar, and fermented liquor.
2. Experimental
2.1 Reagents and materials
Parathion-methyl (98.2%) was obtained from ANPEL-TRACE Standard Technical Services Co., Ltd. (Shanghai, China). Guaiacol, methanol, KCl, NaCl, Na2SO4, NaNO3, trimethylhexylammonium bromide (C9H22NBr), and NaOH were obtained from Aladdin Industrial Co., Ltd. (Shanghai, China). Water, cherry juice, vinegar, and fermented liquor were purchased from local markets (Jinzhong, Shanxi).2.2. Apparatus
The Xiaomi 10S smartphone was purchased from Xiaomi Technologies Co., Ltd. (Beijing, China). A free application Color Grab (Loomatix, version 3.6.1, 2017), which was available for Android systems, was used to convert the images to RGB values.2.3 Microextraction and detection procedure
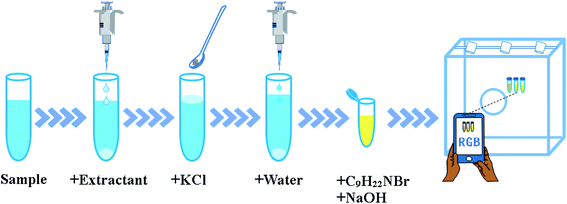
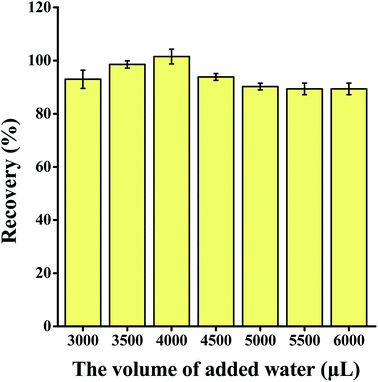
The extraction and detection procedure are shown in Fig. 1. Then, 150 μL of colorless extraction solvent guaiacol was added into 5 mL of the sample solution in a 10 mL centrifuge tube. After 1500 mg of KCl was added, guaiacol floated from the bottom to the top of the sample solution. After 4000 μL of water was added, the extractant sunk to the bottom of the centrifuge tube again.The extractant was collected into another 1.5 mL centrifuge tube, which contained 100 μL of C9H22NBr (10 mol L−1) and 100 μL of sodium hydroxide solution (10 mol L−1) to generate yellow product in situ (Fig. S1†). The yellow organic phase was placed in the middle of an opaque white box (30 cm × 30 cm × 30 cm). The top of the box was surrounded by LED light panels to provide an isotropic lighting. Moreover, a small hole (diameter, 5 cm) was formed in the centre of the top to allow photography. The change in colour was captured by Xiaomi 10S smartphone with 108 Megapixel, then the red (R), green (G), and blue (B) channel values of the middle pixel region were read in RGB mode with Color Grab application. The RGB intensity (I) was calculated by the formula: I = 1/B.
2.4. Calculation of extraction recovery
The recovery was calculated to evaluate the proposed method as follows.CFound is the total concentration of parathion-methyl after the addition of a known amount of parathion-methyl to the sample; CReal is the original concentration of parathion-methyl in the sample; CAdded is the concentration of parathion-methyl added to the real samples.
3. Results and discussion
3.1 Optimization of extraction conditions
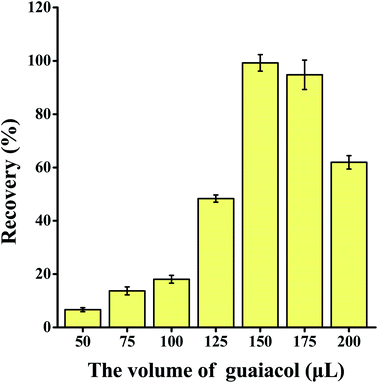
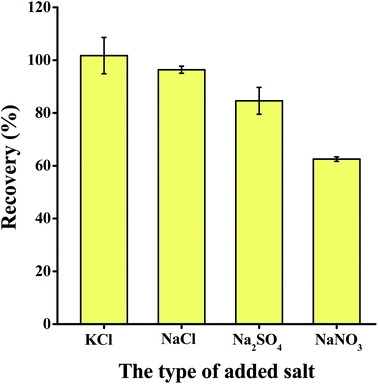
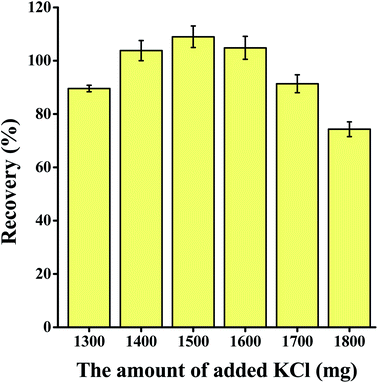
The volume of the extractant, type and volume of salt added, volume of water added, and sample volume were optimized to ascertain the best extraction parameters to use. Each experiment was repeated three times.3.2 Method validation
To validate the performance of the proposed method, the linear range (LR), correlation coefficients (R), limits of detection (LOD), limits of quantification (LOQ), and intraday and interday relative standard deviation (RSDs) of the established method were evaluated, and the results are shown in Table 1 under the optimal extraction conditions (Table 1).| Sample | Regression equation A = (a ± SDa)c + (b ± SDb) | Enrichment factor | Extraction efficiency (%) | R2 | LOD (mg L−1) | LOQ (mg L−1) | Intra-day RSD (%) (n = 3) | Inter-day RSD (%) (n = 3) |
|---|---|---|---|---|---|---|---|---|
| a A, intensity; c, parathion-methyl concentration in real samples (mg L−1); a, slope; b, intercept; SDa and SDb, standard deviations of slope and intercept, respectively. | ||||||||
| Water | A = (0.002612 ± 0.000231)c + (0.005537 ± 0.000578) | 47 | 94.9 | 0.995 | 0.003 | 0.01 | 1.0 | 1.4 |
| Fruit juice | A = (0.002285 ± 0.000165)c + (0.011845 ± 0.000462) | 47 | 93.1 | 0.993 | 0.003 | 0.01 | 1.7 | 2.5 |
| Vinegar | A = (0.000620 ± 0.000080)c + (0.007099 ± 0.000121) | 50 | 100.4 | 0.993 | 0.003 | 0.01 | 0.9 | 2.4 |
| Fermented liquor | A = (0.000390 ± 0.000041)c + (0.007555 ± 0.000076) | 49 | 97.6 | 0.992 | 0.003 | 0.01 | 1.4 | 2.4 |
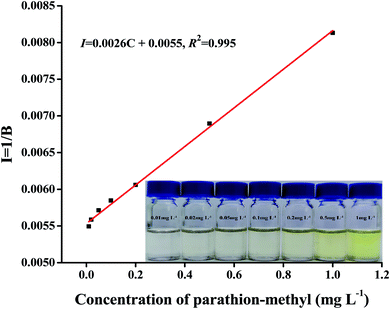
In this experiment, parathion-methyl had good linearity in the linear range of 0.01–1 mg L−1, with RGB intensity (I) as the ordinate and concentration as the abscissa (Fig. 6). The slope of water, fruit juice, vinegar, and fermented wine are 0.002612, 0.002285, 0.000620, and 0.000390, respectively. The intercept of water, fruit juice, vinegar, and fermented wine are 0.005537, 0.011845, 0.007099, and 0.007555, respectively. The enrichment factor of water, fruit juice, vinegar, and fermented wine is 47, 47, 50, and 49, respectively. The R2 values were 0.998, 0.993, 0.993, and 0.992. The limits of detection and quantification were determined to be 0.003 mg L−1 and 0.01 mg L−1 based on signal-to-noise ratios of 3 and 10, respectively. The intraday and interday RSDs were 0.9–1.7% and 1.4–2.5%, respectively.
3.3 Anti-interference test
To validate the anti-interference performance of the proposed method, the specificity of the proposed method was investigated by preparing and analyzing samples spiked with different insecticides (parathion-methyl, bifenthrin, deltamethrin, clothianidin, dinotefuran, thiacloprid, acetamiprid, fipronil). The result showed that other insecticides did not cause interference with the determination of parathion-methyl (Fig. S3†).3.4 Applicability
The analytical applicability of the developed method to food samples (water, fruit juice, vinegar, and fermented liquor) was evaluated. The parathion-methyl in the real samples was below detectable levels. Thus, to verify the accuracy and precision of the method, different known concentrations of parathion-methyl were spiked in real samples. The analysis results in Table 2 show that the spiked recovery in real samples was 91.6–106.5%, and the RSDs were 0.6–6.0%. Therefore, the proposed method has good reproducibility and precision. This experiment was validated using the GB23200.113 method. The proposed method was accurate and reliable, and was deemed trustworthy for the detection and monitoring the level of parathion-methyl concentration in food samples.| Matrix | Added (mg L−1) | Proposed method | Reference method | ||||
|---|---|---|---|---|---|---|---|
| Found (mg L−1) | Recovery (%) | RSD (n = 3, %) | Found (mg L−1) | Recovery (%) | RSD (n = 3, %) | ||
| Water | 0.01 | 0.009 | 96.8 | 1.2 | 0.009 | 92.4 | 3.0 |
| 0.1 | 0.095 | 94.9 | 2.0 | 0.104 | 104.3 | 2.0 | |
| 1 | 0.929 | 92.9 | 3.2 | 1.059 | 105.9 | 2.3 | |
| Fruit juice | 0.01 | 0.009 | 91.6 | 3.7 | 0.008 | 81.9 | 2.2 |
| 0.1 | 0.094 | 93.5 | 3.2 | 0.104 | 103.7 | 1.1 | |
| 1 | 0.942 | 94.2 | 6.0 | 1.047 | 104.7 | 0.4 | |
| Vinegar | 0.01 | 0.011 | 106.5 | 1.7 | 0.009 | 85.4 | 1.7 |
| 0.1 | 0.101 | 100.6 | 3.1 | 0.093 | 92.9 | 0.8 | |
| 1 | 0.940 | 94.0 | 1.5 | 0.962 | 96.2 | 0.5 | |
| Fermented liquor | 0.01 | 0.009 | 98.4 | 2.7 | 0.009 | 94.2 | 2.2 |
| 0.1 | 0.101 | 100.5 | 0.6 | 0.097 | 96.8 | 1.2 | |
| 1 | 0.940 | 94.0 | 3.6 | 0.975 | 97.5 | 0.8 | |
3.5 Comparison with other methods
The method, solvent, extraction equipment, auxiliary extraction time, LOD, recovery, and instrument were compared to other determination methods of parathion-methyl19,20,34–36 (Table 3). The proposed method uses a small volume of environmentally friendly extraction solvent. No extraction equipment is involved, which makes the method faster and more convenient. A favorable LOD and recovery were achieved without chromatography or mass spectrometry. The proposed method is fast, convenient, and environmentally friendly.| Method | Solvent (μL) | Extraction equipment | Auxiliary extraction time (min) | LOD (μg L−1) | Recovery (%) | Instrument | Ref. |
|---|---|---|---|---|---|---|---|
| DLSE | Dichloromethane (5000) | Stirrer, ultrasonic bath | 25 | 0.025 | 94–99 | GC-MS | 19 |
| VA-DLLME | Chloroform (290), acetone (280) | Vortexer | 0.5 | 0.67 | 95–119 | LC-MS/MS | 20 |
| VLLME-SID | Hexane (15), 1-dodecanol (15) | Vortexer | 1 | 0.3 | 80–104 | HPLC-DAD | 34 |
| VALLME | 1-Bromobutane (80) | Vortexer | 2 | 0.38 | 90–104 | HPLC-UV | 35 |
| UTILDLPME | [C4MIM]PF6 (75) | Ultrasonic bath | 3 | 0.01 | 96–103 | RPLC-UV | 36 |
| Density-adjusted LPME | Guaiacol (150) | — | — | 3 | 92–107 | SDIC | Current study |
4. Conclusions
In this study, density-adjusted LPME with the SDIC method was established to quickly determine parathion-methyl in food samples. In the pretreatment process, the biomass-derived solvent guaiacol was used as the green extractant, and salt and water were used as the density regulators to exclude the use of toxic dispersants and auxiliary equipment. In the detection process, parathion-methyl generated a yellow product under strongly alkaline conditions; then, a smartphone was used to obtain the image of the yellow organic phase for quantitative analysis. This method is fast, convenient, and environmentally friendly and has been successfully used to determine parathion-methyl in spiked water, fruit juice, vinegar, and fermented liquor. Therefore, this method can be applied to rapidly determine and screen parathion-methyl on-site in different food samples.Author contributions
Xinyuan Bi: investigation, writing – original draft. Haijuan Jiang: investigation, writing – original draft. Xingle Guo: validation, formal analysis. Min Wang: investigation, data curation. Yu Niu: writing – review & editing. Liyan Jia: project administration, supervision. Xu Jing: conceptualization, writing – review & editing.Conflicts of interest
There are no conflicts to declare.Acknowledgements
This study was supported by Scientific and Technological Innovation Programs of Higher Education Institutions in Shanxi [grant number 2021L163]; Shanxi Province Key R&D Plan [grant number 201903D211006]; Scientific and Technologial Key R&D Plan in Jinzhong [grant number Y202007]; and Transformation of Scientific and Technological Achievements Programs of Higher Education Institutions in Shanxi.References
- B. C. Liu, Z. J. Peng, S. H. Wu, T. S. He and P. Qiu, Spectrochim. Acta, Part A, 2021, 247, 119146 CrossRef CAS PubMed.
- Y. H. Yi, W. Zeng and G. B. Zhu, Talanta, 2021, 222, 121703 CrossRef CAS PubMed.
- P. A. R. de Sousa, A. L. Squissato, R. A. A. Munoz, L. M. Coelho, E. I. de Melo and R. A. B. da Silva, Anal. Methods, 2020, 12, 5801–5814 RSC.
- B. H. Wang, X. Lian and B. Yan, Talanta, 2020, 214, 120856 CrossRef CAS PubMed.
- P. Kukkar, D. Kukkar, S. A. Younis, G. Singh, P. Singh, S. Basu and K. H. Kim, Microchem. J., 2021, 166, 106242 CrossRef CAS.
- J. M. Kokosa, Sustain. Chem. Pharm., 2021, 22, 100478 CrossRef CAS.
- M. Z. Hu, L. J. Wu, Y. Song, Z. C. Li, Q. Ma, H. Q. Zhang and Z. M. Wang, Anal. Methods, 2015, 7, 9114–9120 RSC.
- N. Altunay and K. P. Katin, J. Mol. Liq., 2020, 310, 113192 CrossRef CAS.
- F. Yu, C. Liu, Y. H. Guo and Y. L. Yang, Spectrosc. Lett., 2014, 47, 761–770 CrossRef CAS.
- X. Chen, D. Tie, A. N. Li, S. Hu, X. P. Bi and X. H. Bai, J. Sep. Sci., 2020, 43, 4067–4076 CrossRef CAS PubMed.
- Z. L. Zhou, W. Ni, Z. W. Ji, S. P. Liu, X. Han, X. T. Li and J. Mao, Food Anal. Methods, 2020, 13, 591–600 CrossRef.
- H. Zhang, A. F. Xue, H. Chen and S. Q. Li, Spectrosc. Spect. Anal., 2018, 38, 3264–3268 CAS.
- D. R. Joshi and N. Adhikari, J. Pharm. Res. Int., 2019, 28, 1–18 Search PubMed.
- L. Y. Jia, X. Huang, W. F. Zhao, H. H. Wang and X. Jing, Food Chem., 2020, 317, 126424 CrossRef CAS PubMed.
- A. P. Santos, M. D. A. Korn and V. A. Lemos, Environ. Monit. Assess., 2017, 189, 1–16 CrossRef CAS PubMed.
- Y. Y. Yan, X. Chen, S. Hu and X. H. Bai, J. Chromatogr. A, 2014, 1368, 1–17 CrossRef CAS PubMed.
- A. Gevorgyan, K. H. Hopmann and A. Bayer, ChemSusChem, 2020, 13, 2080–2088 CrossRef CAS PubMed.
- R. Amini, J. Khandaghi and M. R. A. Mogaddam, Food Anal. Methods, 2018, 11, 3267–3275 CrossRef.
- S. Jullakan, O. Bunkoed and S. Pinsrithong, Microchim. Acta, 2020, 187, 1–10 CrossRef PubMed.
- V. A. Muckoya, P. N. Nomngongo and J. C. Ngila, Int. J. Environ. Sci. Technol., 2020, 17, 2325–2336 CrossRef CAS.
- B. R. Luo, S. Qian, Z. W. Xie, H. Yao, J. Xiong and H. Zhao, Chin. J. Chromatogr., 2015, 33, 740–745 CrossRef CAS PubMed.
- M. P. Sooraj and B. Mathew, Food Anal. Methods, 2019, 12, 1028–1039 CrossRef.
- N. V. Saranchina, Y. G. Slizhov, Y. M. Vodova, N. S. Murzakasymova, A. M. Ilyina, N. A. Gavrilenko and M. A. Gavrilenko, Talanta, 2021, 226, 122103 CrossRef CAS PubMed.
- B. X. Lin, Y. Yu, Y. J. Cao, M. L. Guo, D. B. Zhu, J. X. Dai and M. S. Zheng, Biosens. Bioelectron., 2018, 100, 482–489 CrossRef CAS PubMed.
- X. Jing, H. H. Wang, X. Huang, Z. J. Chen, J. L. Zhu and X. W. Wang, Food Chem., 2021, 337, 127971 CrossRef CAS PubMed.
- A. Choodum, V. Jirapattanasophon, C. Boonkanon, T. Taweekarn and W. Wongniramaikul, Anal. Sci., 2020, 36, 577–582 CrossRef CAS PubMed.
- J. A. Barreto, R. D. de Assis, L. B. Santos, R. J. Cassella and V. A. Lemos, Microchem. J., 2020, 157, 105064 CrossRef CAS.
- R. Jain, R. R. Jha, A. Kumari and I. Khatri, Microchem. J., 2021, 162, 105870 CrossRef CAS.
- J. Caleb, U. Alshana and N. Ertas, Food Chem., 2021, 336, 127708 CrossRef CAS PubMed.
- J. Caleb and U. Alshana, Sustain. Chem. Pharm., 2021, 21, 100424 CrossRef CAS.
- L. Z. Qiao, R. T. Sun, C. M. Yu, Y. Tao and Y. Yan, Microchem. J., 2021, 170, 106686 CrossRef CAS.
- L. Schettino, J. L. Benede, A. Chisvert and A. Salvador, Microchem. J., 2020, 159, 105402 CrossRef CAS.
- H. H. Wang, Y. Wang, X. Jing, Z. J. Chen and X. W. Wang, Int. J. Environ. Anal. Chem., 2020 DOI:10.1080/03067319.2020.1819992.
- K. Seebunrueng, Y. Santaladchaiyakit and S. Srijaranai, Talanta, 2015, 132, 769–774 CrossRef CAS PubMed.
- G. L. Peng, Q. He, D. Mmereki, G. M. Zhou, W. L. Pan, L. Gu, L. L. Fan, X. H. Tang, J. H. Chen and Y. F. Mao, J. Sep. Sci., 2015, 38, 3487–3493 CrossRef CAS PubMed.
- H. M. Albishri, N. A. M. Aldawsari and D. Abd El-Hady, Electrophoresis, 2016, 37, 2462–2469 CrossRef CAS PubMed.
Footnote |
| † Electronic supplementary information (ESI) available. See https://doi.org/10.1039/d2ra02760g |
| This journal is © The Royal Society of Chemistry 2022 |

