 Open Access Article
Tracing the geographic origin of velvet antlers in China via stable isotope analyses †
Haiping Zhao‡
 a,
Guokun Zhang‡
 bc,
Dongxu Wangb,
Zhen Liuac,
Rui Chend,
Wei Zhangc and
Chunyi Li
 *b
*b
aCollege of Animal Science and Technology, Qingdao Agricultural University, Qingdao, China 266109
bInstitute of Antler Science and Product Technology, Changchun Sci-Tech University, Changchun, China 130600. E-mail: lichunyi1959@163.com; Tel: +8617790067914
cInstitute of Special Animals and Plant Sciences, Chinese Academy of Agricultural Sciences, Changchun, China 130112
dBasic Medical College in Changchun University of Chinese Medicine, Changchun, China
First published on 13th June 2022
Abstract
Multielement (H, C, N, O) stable isotope ratio analysis was used to discriminate the geographical origin of velvet antlers (VAs) of deer from ten provinces in China. Ratios of 2H/1H, 13C/12C, 15N/14N, and 18O/16O in the VA samples were measured using isotope ratio mass spectrometry. The results showed that there were highly significant differences in the mean isotopic values and in four isotopic ratios between VA samples from the ten provinces. The most significant difference among the four isotope ratios was in δ2H ratio of VA samples; regions with a more humid climate and higher average ambient temperatures had higher δ2H ratios than those with dry climates and lower temperatures. These results demonstrate that the multiple stable isotopic ratio approach is a powerful tool to help trace the geographical origin of VAs, and could be adopted by government officials to help protect consumer interests from improper labeling in VA markets.
Introduction
Velvet antlers (VAs) have been used as a precious Traditional Chinese Medicine (TCM) and/or dietary supplement in China and Southeast Asian countries for over a thousand of years.1 Recent research has found that VAs can enhance immunity and strengthen bones, and also exhibit activity as an anti-cancer, anti-inflammatory, anti-fatigue and anti-aging agent.1–5 These effects, undoubtedly, are functions of the chemical composition of the VA.6 Based on the theory of TCM, the pharmacological efficacy of a medicinal herb produced from different geographic locations may vary considerably, as the composition of herbs are largely dependent on the provenance.7 Only the medicinal herbs discovered in the original places are considered to be authentic, a phenomenon known as “Geoherbalism”. The authentic medicinal herbs are considered superior and are regarded as having the best medicinal value. For example, VA from Chinese sika deer and wapiti are listed in Chinese Pharmacopeia as a TCM; in sika deer, only VAs produced from the Changbai Mountain region are treated as authentic and consumers are willing to pay a premium price. Geoherbal origin has been used illegally by some traders who have labeled their VAs as “Changbai Mountain origin”, or as “Jilin Province origin” (Jilin includes some of the sika deer hometowns) for gaining more profit, although being soured from elsewhere in China. Consequently, the interests of VA consumers and authentic VA producers have been harmed. To protect consumers' rights and create a clean and fair VA market, there is an urgent need to develop a technique to be able to discriminate effectively the geographic origin of VA in commercial markets.In this regard, Wen et al.7 used metabolomic analysis to discriminate geographic origin of VA. However, to achieve reliable results based on the metabolomic approach cannot be used independently as pre-identification of deer species using genomics is necessary; in addition, a large number of VA samples (over 30 from each geographic location) are required.8 Therefore, this approach is complex, time-consuming and expensive. The authors noted that the metabolomic approach was inadequate for differentiation of all samples at once. Fortunately, analytical techniques for authentication for agriculture products, either plant-derivative or animal-derivative, have advanced dramatically; isotope ratio mass spectrometry (IRMS) is an example which has been found to be superior for tracing geographical origin of TCMs and agricultural products compared with other currently available methods.9,10
IRMS has not been applied thus far to distinguish provenance of VA. In general, carbon (C) and nitrogen (N) isotopic compositions of animal-derived products are related to production systems (mainly origin of their diets), and may not be related specifically to geographic origin. They can, however, be useful as an indirect indication of geographical origin if used in combination with other stable isotopes such as hydrogen (H) and oxygen (O).9 The latter two are especially useful for discriminating geographic origin of agricultural products linked to regional climatic conditions as they are strongly latitude-dependent.11,12 Therefore, to achieve unambiguous results in our study, these four stable isotopes (δ13C, δ15N, δ2H, δ18O) were used. Our results demonstrate convincingly that IRMS could be used reliably to discriminate provenance of the VA from different geographic locations in China. Therefore, our work has laid the foundation for establishment of a national traceability database for VA.
Results and discussion
Hydrogen isotopes
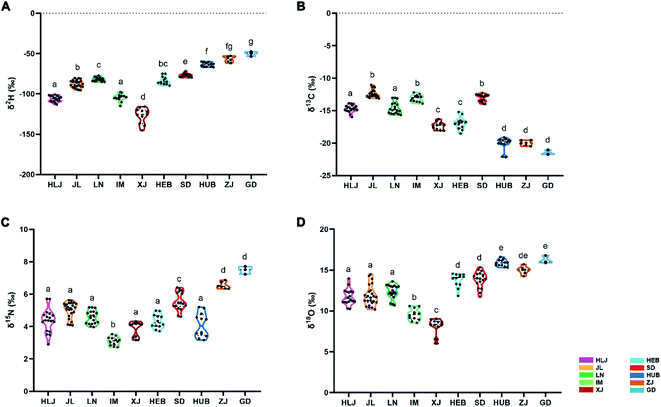
δ2H values of the VA samples varied considerably across the ten provinces ranging from −126.98 to −50.25‰ (Table 1 and Fig. 2A). VA samples from Guangdong and Zhejiang had the highest δ2H mean values (−50.25 and −56.77‰, respectively) followed by Shandong (−76.90‰) and Hubei (−63.56‰); VA from Heilongjiang, Jilin, Liaoning, Inner Mongolia and Hebei were midway (−106.29 to −81.94‰); and those from Xinjiang were the lowest (−126.98‰). These results suggest that δ2H values may provide a reliable indicator for distinguishing VA from Xinjiang and Shandong, as these were statistically different from the others.| Origin | n | δ2Hb (‰) | δ13Cb (‰) | δ15Nb (‰) | δ18Ob (‰) |
|---|---|---|---|---|---|
| a Mean ± SD.b Within columns, means assigned different letters differ significantly (P < 0.05). | |||||
| Heilongjiang (HLJ) | 18 | −106.29 ± 3.51a | −14.69 ± 0.54a | 4.37 ± 0.70a | 11.72 ± 0.94a |
| Jilin (JL) | 24 | −87.79 ± 4.54b | −12.39 ± 0.59b | 5.02 ± 0.48a | 11.85 ± 1.21a |
| Liaoning (LN) | 18 | −81.94 ± 2.26c | −14.61 ± 0.87a | 4.57 ± 0.40a | 12.34 ± 0.84a |
| Inner Mongolia (IM) | 12 | −104.55 ± 4.50a | −13.10 ± 0.52b | 3.10 ± 0.25b | 9.55 ± 0.67b |
| Xinjiang (XJ) | 11 | −126.98 ± 9.16d | −17.33 ± 0.54c | 3.85 ± 0.45a | 8.14 ± 0.93c |
| Hebei (HEB) | 12 | −83.42 ± 4.81bc | −16.95 ± 0.91c | 4.33 ± 0.42a | 13.78 ± 0.81d |
| Shandong (SD) | 18 | −76.90 ± 2.06e | −13.07 ± 0.54b | 5.55 ± 0.54c | 13.85 ± 0.95d |
| Hubei (HUB) | 12 | −63.56 ± 2.46f | −20.11 ± 0.95d | 4.10 ± 0.71a | 15.88 ± 0.38e |
| Zhejiang (ZJ) | 6 | −56.77 ± 3.36 fg | −19.98 ± 0.36d | 6.54 ± 0.20d | 14.98 ± 0.45de |
| Guangdong (GD) | 3 | −50.25 ± 2.41g | −21.51 ± 0.32d | 7.48 ± 0.20d | 16.23 ± 0.39e |
It is known that hydrogen in animal tissues reflects the 2H/1H ratios of the feed and the water that animal ingested, which in turn are influenced by the average 2H/1H ratio of precipitation in a region.10,13 Our results showed that the differences in δ2H were most significant in the VA samples from across the ten provinces (Fig. S1†). VA samples in the lower latitude provinces (e.g. Guangdong) had significantly higher δ2H values than those from higher latitude provinces (e.g. Xinjiang). One reason could be the level of water precipitation. Guangdong and Zhejiang had much higher precipitation (1843 mm and 1640 mm respectively), than Xinjiang (186.0 m) (China Meteorological Administration, http://www.cma.gov.cn/). Moreover, the δ2H values in rainwater from Guangdong and Zhejiang were higher than those in Xinjiang.
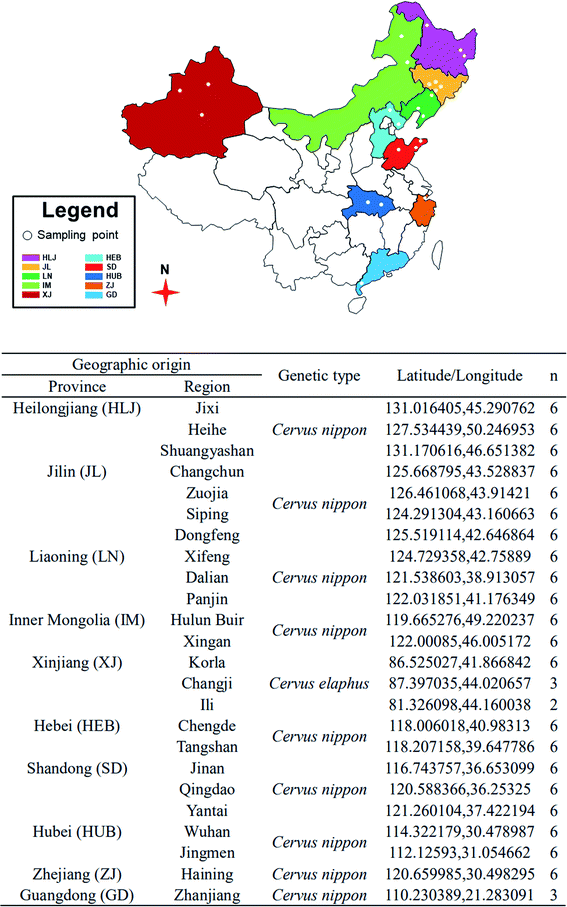
Another factor that could influence δ2H values is latitude.9 Thus, provinces with higher latitudes and a colder climate (e.g. Xinjiang, Inner Mongolia, Heilongjiang) had significantly lower δ2H values in the VA than those provinces with lower latitude and a warmer climate (Guangdong, Zhejiang, Hubei, Shandong). However, it is difficult to explain why the δ2H values of Liaoning were higher than those of Hebei based on the latitude theory; although these are neighboring provinces, Liaoning has the higher latitude (Refer to Fig. 1). This discrepancy could be due to the type of the animal feeds, as the feed in Liaoning includes more C4 crops (e.g. corn, sorghum) than those of Hebei (C3 crops more dominant) (Agricultural statistics of China, http://www.moa.gov.cn/). It is known that C4 plant species contain higher amounts of organically bound 2H than C3 plant species,14 and this may well be the reason that the VA from Liaoning had higher δ2H values than that of Hebei.
Carbon isotopes
δ13C values varied considerably across the provinces ranging from −21.51 to −12.39‰ (Table 1 and Fig. 2B). VA samples from Jilin, Inner Mongolia, and Shandong had the highest δ12C mean values (−12.39, −13.10, and 13.07‰, respectively), followed by Heilongjiang, Liaoning, Xinjiang, and Hebei (−17.33 to −14.61‰), whereas those from Hubei, Zhejiang, Guangdong were the lowest (−20.11, −19.98, and −21.51‰, respectively).It is reported that δ13C value in animal tissue is highly dependent on feed composition, particularly the ratio of C3 to C4 plant species.9,15,16 Consumption of C3 plants (from −35 to −21‰) results in lower δ13C values in animal tissues than consumption of C4 plants (from −14 to −10‰).9,17–19 In the present study, we found that VA samples from the provinces where animal feed contains more C4 plants (e.g. Inner Mongolia and Jilin) had higher δ13C values than those from the provinces with the feed containing more C3 plants (e.g. Hubei, Zhejiang, Guangdong) (http://www.moa.gov.cn/). Inner Mongolia (the sampling location) and Jilin are located in the Northeast of China, where maize (C4 plant) is one of the primary crops as animal feed. In contrast, Hubei, Zhejiang, Guangdong are located in the Southern China, where rice straw (C3 plant) is one of the primary crops (http://www.moa.gov.cn/). Besides animal feed, the humidity of a region may also be important, as high humidity may result in high C isotope fractionation during plant biosynthesis,20 which may be a factor impacting the observation that VA samples from high humidity provinces, such as Guangdong and Zhejiang, were grouped into one subset. Overall, our results are in good agreement with the findings by Yan Zhao et al.11 and Osorio et al.,9 who observed that the δ13C values in beef samples were closely related to the type of cattle feed and the humidity of the region.
Nitrogen isotopes
δ15N values varied considerably across the ten provinces ranging from 3.10 to 7.48‰ (Table 1 and Fig. 2C). VA samples from Guangdong and Zhejiang had the highest mean δ15N values (7.48‰ and 6.54‰, respectively); followed by Shandong (5.55‰); from Heilongjiang, Jilin, Liaoning, Xinjiang, Hebei, and Hubei were midway (3.85 to 5.02‰), and those from Inner Mongolia were the lowest (3.10‰). These results suggest that δ15N values may provide a reliable indicator to help distinguish VA from Inner Mongolia and Shandong, as they were distinctly different from other provinces.Variation in δ15N values in animal tissues are attributed to the difference in 15N contents of the regional feedstuffs fed to the animals and regional conditions, including climate and soil conditions, agricultural practices, etc, although the use of synthetic N fertiliser may modify the feed 15N content.21,22 Therefore, high δ15N values in VA samples from Guangdong and Zhejiang could be due to the practice of heavy application of organic fertilizer, which is reported to increase 15N level in the soil and plants.22 In addition, Guangdong and Zhejiang are the seaward provinces, so fish meal or seaweed may have been used in deer feed, which is reported to contain high 14N content,23 which could lead to a significant increase in δ15N values.
Oxygen isotopes
δ18O values varied considerably across the provinces ranging from 8.14 to 16.23‰ (Table 1 and Fig. 2D). VA samples from Guangdong, Hubei, and Zhejiang had the highest mean δ18O values (16.23, 15.88 and 14.98‰, respectively); Heilongjiang, Jilin, Liaoning, Hebei, and Shandong were midway ranging from 11.72 to 13.85‰; those from Xinjiang and Inner Mongolia were the lowest (8.14 and 9.55‰, respectively). These results suggest that δ18O values may be reliable indicators to help distinguishing VA from Inner Mongolia and Xinjiang, as they were different from other provinces.It is reported that O isotope values, like H isotope, in animal tissues are influenced by climate and latitude (humidity and temperature).24 δ18O values in the VA samples from the lower latitude provinces (e.g. Guangdong, Zhejiang, and Hubei) were significantly higher than those from the higher latitude provinces (e.g. Xinjiang and Inner Mongolia), which may be the reflection the abundance of precipitation. The former is located in lower latitudes with higher precipitation, and the latter in higher latitude with lower precipitation.
| δ2H/δ15N and δ13C/δ18O |
Fig. 3A presents the relationship between the stable isotope ratios of H and N in the VA samples from the ten provinces. δ2H values of VA samples from Guangdong, Zhejiang, and Shandong differed markedly from those in the other provinces. δ15N values of VA samples from Hubei, Zhejiang, and Guangdong differed markedly from those in the rest of provinces. δ2H/δ15N values of VA samples differed slightly between the provinces except Guangdong, Zhejiang, Hubei, and Shandong provinces. Based on these results, VA samples from provinces Guangdong and Zhejiang were grouped into one subset.
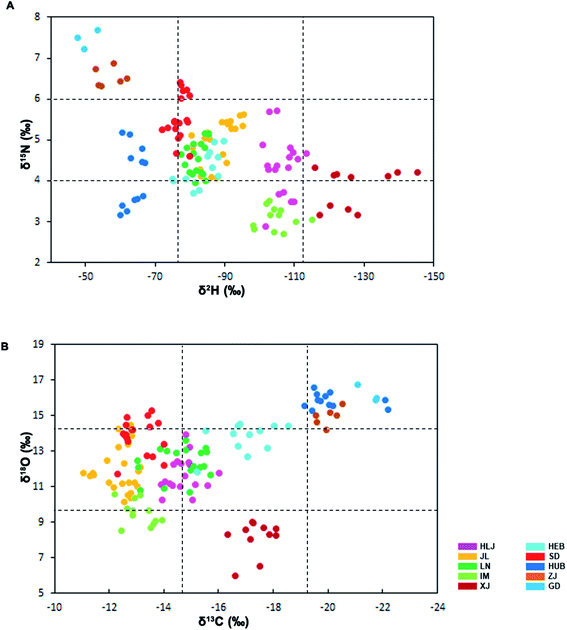 | ||
| Fig. 3 Ratios of δ2H/δ15N (A) and δ13C/δ18O values (B) in the defatted dry VA collected from the ten provinces of China; the VA from Guangdong, Zhejiang and HUB were found in one grid; those from Xinjiang were found in one grid; and those from Hebei were found in one group. There was no clear segregation for VA from the remaining provinces; abbreviations as per Fig. 2. | ||
Fig. 3B presents the relationship between the stable isotope ratios of C and O of VA samples from the ten provinces. δ13C values of VA samples from Xinjiang differed markedly from those in the other provinces; δ13C/δ18O values of VA samples from Guangdong, Zhejiang, and Hubei differed markedly from those in the rest of provinces. Based on the results from Fig. 3B, VA samples from the provinces Guangdong, Zhejiang, and Hubei were grouped into one subset; and those from Xinjiang alone grouped into another subset.
| Origin | n | δ2Hb (‰) | δ13Cb (‰) | δ15Nb (‰) | δ18Ob (‰) |
|---|---|---|---|---|---|
| a Mean ± SD.b Within columns, means assigned different letters differ significantly (P < 0.05). | |||||
| Changchun | 6 | −91.69 ± 1.89a | −12.57 ± 0.20 ab | 5.08 ± 0.38 ab | 13.62 ± 0.72a |
| Zuojia | 6 | −91.91 ± 2.16a | −12.91 ± 0.17ac | 5.50 ± 0.08a | 11.35 ± 0.53b |
| Dongfeng | 6 | −85.54 ± 1.10b | −11.78 ± 0.72b | 4.75 ± 0.48b | 11.30 ± 0.62b |
| Xifeng | 6 | −83.62 ± 1.44b | −13.97 ± 1.01c | 4.93 ± 0.34 ab | 11.92 ± 0.78b |
Principal component analysis (PCA)
The data for the four stable isotope elements in the VA samples were analyzed using PCA (Fig. 4). The first two components explained 99.43% of the total variability (PC1, 97.61%, and PC2, 1.82%). The values of δ2H and δ18O had the highest weight on PC1, and the values of δ13C and δ18O had the highest weight on PC2. The PCA results demonstrated that VA samples from the ten provinces could be separated from each other through PCA analysis.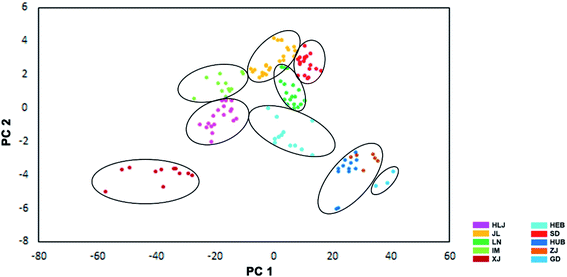 | ||
| Fig. 4 Principal Component Analysis: Distribution map of the VA collected from the ten provinces of China; there is good evidence that some of the VA could be unambiguously distinguished through PCA; abbreviations as per Fig. 2. | ||
Stable isotope ratio analysis of VA samples from the four main deer hometowns in China
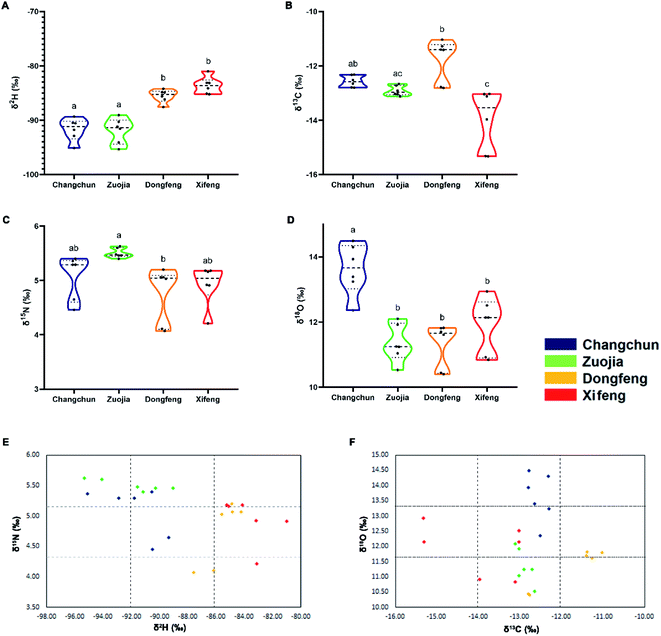
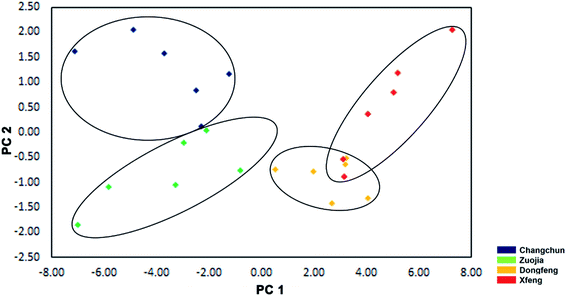
There is strong interest in the potential to define unique signatures for the deer hometowns (Changchun, Zuojia, Dongfeng and Xifeng, which are along the Changbai Mountain range. As shown in Fig. 5, the differences in both δ2H and δ18O values were greater than in those of δ13C and δ15N. The δ2H values in the VA samples from Changchun (−91.69‰) and Zuojia (−91.91‰) were lower than Dongfeng (85.54‰) and Xifeng (83.62‰); δ18O values in the VA samples from Changchun (13.62‰) were higher than the other three towns. Consequently, VA samples of Changchun and Zuojia can be distinguished from those of Dongfeng and Xifeng based on the δ2H value (above or under −90‰); Changchun distinguished from Zuojia based on the δ18O value (above or under 12‰); Dongfeng distinguished from Xifeng based on the δ13C value (above or under 13‰) (Table 2).Results from the PCA (Fig. 6) showed that the first two components explained 94.54% of the total variability (PC1, 87.78%, and PC2, 6.76%). The values of δ2H had the highest weight on PC1, the values of δ18O and δ13C had the highest weight on PC2. Overall, our approach could confidently discriminate VA from one another among these four locations, although those from Dongfeng and Xifeng had a slight overlap. Unambiguous discrimination of VA amongst the four deer hometowns is particularly important for the VA market in China, and at the same time has laid the foundation for consideration of the opportunity to establish unique signatures of VA for each deer hometown.
Application of our technique of stable isotope ratio analysis in the real VA market
Once the successful establishment of stable isotope analysis technique for tracing the origin of VAs in our lab, a businessman came to us for the identification of the origin of his VA samples. He claimed that he paid premier price for buying VAs of Luyuanchun Deer Farm, an ecological deer farm (free-range), of Heilongjiang Province from a velvet pool. He wanted us to confirm it for him using our isotope technique. When we put his VA samples (three sticks) for analysis, we also used VAs (three sticks) from Hubei Province as a control. The results clearly discriminated the VAs from the two lots by different stable isotope ratios; at the same time, the stable isotope ratios of the claimed Luyuanchun VAs confidently matched those from Heilongjiang Province (Table 3). Consequently, our technique not only solved the businessman concern, but also stood the testing in the real world.| δ2H* (‰) | δ13C* (‰) | δ15N* (‰) | δ18O* (‰) | |
|---|---|---|---|---|
| Luyuanchun Deer Industry Co., Ltd (HLJ) | −107.91 | −15.17 | 5.03 | 12.52 |
| −107.04 | −14.61 | 4.57 | 12.14 | |
| −105.55 | −15.10 | 3.78 | 10.85 | |
| HUB | −63.46 | −21.05 | 4.23 | 15.28 |
| −61.91 | −19.57 | 3.75 | 15.25 | |
| −65.53 | −20.61 | 4.12 | 15.76 |
Materials and methods
Sample collection and preparation
A total of 134 samples of VA were collected from 24 regions in ten provinces (Heilongjiang, Jilin, Liaoning, Inner Mongolia, Xinjiang, Hebei, Shandong, Hubei, Zhejiang, and Guangdong) of China (Fig. 1) in 2016. The VA were harvested 60 days after casting of the hard antler buttons, cut into slices and ground into powder, stored at −80 °C and freeze-dried before use. The dried VA powder was extracted in petroleum ether for 6 h in a Soxhlet apparatus to remove fat. The defatted dry VA powder was stored at −80 °C until analysis.Stable isotope ratio analysis
The method for stable isotope analysis has been described previously.21,25 For the measurement of the δ13C and δ15N values, Elemental Analysis-Isotopic Ratio Mass Spectrometry (EA-IRMS) was used. Briefly, the defatted VA powder was weighted (0.5 mg) in a tin foil cup, introduced into the Vario PYRO Cube Elemental Analyzer (Elementar, Germany) using an automatic sampler, and combusted into pure CO2 gas and N2 at 600 °C in the Analyzer. CO2 and N2 were then passing through an IsoPrime Diluter (Isoprime, UK), entering the IsoPrime100 Mass Spectrometer (Isoprime, UK) for the measurement. High Temperature Pyrolysis-Isotopic Ratio Mass Spectrometry (HT-IRMS) was used to determine the δ2H and δ18O values in each VA sample. For the measurement of the δ2H and δ18O values, the defatted VA powder was weighed (0.5 mg) in a silver cup (6 mm × 4 mm), which was then folded it into a small ball, stabilized for 72 h, and placed into the holders of a 120-position autosampler in order, and introduced into the Vario PYRO Cube Elemental Analyzer (Elementar, Germany) using the autosampler, combusted into CO and H2 though pyrolysis. The values of δ13H and δ15O were measured using Isoprime100 IRMS.The values of stable isotopic ratios were expressed in delta (δ) notation in parts per thousands (‰) relative to the accepted international standards. The delta values were calculated as follows:
| δ(‰) = [(Rsample/ Rreference) − 1] × 1000 |
Statistical analysis
Statistical analysis was performed using the SPSS 16.0 package for Windows. ANOVA was carried out for each stable isotope. Tukey's multiple comparison test was performed to determine significant differences between individual regions when the P value was significant in ANOVA. To reduce the dimensionality of the data set and to describe all of the variability of the system using a smaller number of variables, principal component analysis (PCA) was used. The first principal component (PC1) describes the largest contributor to the variation, and the second PC (PC2) accounts for the second highest contributor to the variation and so on.Conclusions
The origin of animal-derived agriculture products is often associated with product quality and safety; hence, product authenticity and traceability have been receiving considerable attention in recent years. The use of multi-isotope analysis to provide information on the geographical origin of the animal-derived products has been carried out in beef, pork, and lamb.11–13,15,17,19,21,22,26,27 In the present study, we successfully applied this technique to discriminate VA from the ten provinces in China. Through PCA analysis, geographic origin of VA from ten provinces of China could be distinguished from one another. Combination of the four stable isotopes (δ2H, δ18O, δ13C, and δ15N) has the potential to provide a classification tool to facilitate discrimination. Further validation, with more samples from more provinces are required to provide the basis for the establishment of the national VA traceability database.Author contributions
Conceptualization, H. Z. and C. L.; methodology, G. Z. and D. W.; investigation, Z. L.; resources, R. C. and W. Z.; data curation, H. Z. and G. Z.; writing—original draft preparation, G. Z.; writing—review and editing, C. L. All authors have read and agreed to the published version of the manuscript.Conflicts of interest
There are no conflicts to declare.Acknowledgements
This research was funded by the Technology Development Plan Project of Jilin Province (20200404004YY and 20190304006YY), the National Natural Science Foundation of China (No. U20A20403), the Strategic Priority Research Program of the Chinese Academy of Sciences (No. XDA16010105) and the Project of Livestock and Poultry Resources Development and Utilization of Jilin Province. Authors are grateful to the other researchers named Boli Guo (Institute of Agro-Products Processing Science and Technology, CAAS) and her team for the help in the data analysis to this manuscript. We also thank Xin Wang (Heilongjiang Academy of Agricultural Sciences), Quanmin Zhao (Jilin Agricultural University), and the members of our laboratory for sample collection and valuable scientific discussions. We thank Dr Peter Fennessy of AbacusBio Limited, Dunedin, New Zealand for helping review the manuscript.Notes and references
- C. Li, Anim. Prod. Sci., 2020, 60 Search PubMed.
- Y. Chunhui, C. Wenjun, W. Hui, S. Liquan, Z. Changwei, Z. Tianzhu and Z. Wenhai, Int. J. Biol. Macromol., 2017, 99, 15–20 CrossRef PubMed.
- M. J. Shao, S. R. Wang, M. J. Zhao, X. L. Lv, H. Xu, L. Li, H. Gu, J. L. Zhang, G. Li, X. N. Cui and L. Huang, Evidence-based complementary and alternative medicine, eCAM, 2012, 2012, 825056 Search PubMed.
- C. R. Kim, H. L. Jeon, S. K. Shin, H. J. Kim, C. W. Ahn, S. U. Jung, S. H. Park and M. R. Kim, J. Med. Food, 2014, 17, 226–235 CrossRef CAS PubMed.
- F. Wu, H. Li, L. Jin, X. Li, Y. Ma, J. You, S. Li and Y. Xu, J. Ethnopharmacol., 2013, 145, 403–415 CrossRef PubMed.
- Z. Sui, L. Zhang, Y. Huo and Y. Zhang, J. Pharm. Biomed. Anal., 2014, 87, 229–240 CrossRef CAS PubMed.
- H. Wen, M. Y. Lee, Y. Song, S. Moon and S. Park, J. Agric. Food Chem., 2011, 59, 6339–6345 CrossRef CAS PubMed.
- H. K. Choi, K. H. Kim, K. H. Kim, Y. S. Kim, M. W. Lee and W. K. Whang, J. Pharm. Biomed. Anal., 2006, 41, 1047–1050 CrossRef CAS PubMed.
- M. T. Osorio, A. P. Moloney, O. Schmidt and F. J. Monahan, J. Agric. Food Chem., 2011, 59, 3285–3294 CrossRef CAS PubMed.
- A. R. Lee, M. Gautam, J. Kim, W. J. Shin, M. S. Choi, Y. S. Bong, G. S. Hwang and K. S. Lee, J. Agric. Food Chem., 2011, 59, 8560–8567 CrossRef CAS PubMed.
- Y. Zhao, B. Zhang, G. Chen, A. Chen, S. Yang and Z. Ye, J. Agric. Food Chem., 2013, 61, 7055–7060 CrossRef CAS PubMed.
- R. Nakashita, Y. Suzuki, F. Akamatsu, Y. Iizumi, T. Korenaga and Y. Chikaraishi, Anal. Chim. Acta, 2008, 617, 148–152 CrossRef CAS PubMed.
- F. Camin, L. Bontempo, K. Heinrich, M. Horacek, S. D. Kelly, C. Schlicht, F. Thomas, F. J. Monahan, J. Hoogewerff and A. Rossmann, Anal. Bioanal. Chem., 2007, 389, 309–320 CrossRef CAS PubMed.
- H. W. Yeh and W. M. Wang, Proc. Natl. Sci. Counc., Repub. China, Part B: Life Sci., 2001, 25, 137–147 CAS.
- S. Sun, B. Guo and Y. Wei, Food Chem., 2016, 213, 675–681 CrossRef CAS PubMed.
- S. M. Harrison, O. Schmidt, A. P. Moloney, S. D. Kelly, A. Rossmann, A. Schellenberg, F. Camin, M. Perini, J. Hoogewerff and F. J. J. F. C. Monahan, Food Chem., 2011, 124, 291–297 CrossRef CAS.
- M. Boner and H. Förstel, Anal. Bioanal. Chem., 2004, 378, 301–310 CrossRef CAS PubMed.
- I. González-Martin, C. González-Pérez, J. Hernández Méndez, E. Marqués-Macias and F. Sanz Poveda, Meat Sci., 1999, 52, 437–441 CrossRef.
- B. Bahar, F. J. Monahan, A. P. Moloney, P. O'Kiely, C. M. Scrimgeour and O. Schmidt, Rapid Commun. Mass Spectrom., 2005, 19, 1937–1942 CrossRef CAS PubMed.
- C. L. Phillips, N. Nickerson, D. Risk, Z. E. Kayler, C. Andersen, A. Mix and B. J. Bond, Rapid Commun. Mass Spectrom., 2010, 24, 1271–1280 CrossRef CAS PubMed.
- M. T. Osorio, A. P. Moloney, O. Schmidt and F. J. Monahan, J. Agric. Food Chem., 2011, 59, 3295–3305 CrossRef CAS PubMed.
- S. W. Erasmus, M. Muller, M. van der Rijst and L. C. Hoffman, Food Chem., 2016, 192, 997–1005 CrossRef CAS PubMed.
- A. W. Hilkert, C. B. Douthitt, H. J. Schlüter and W. A. Brand, Rapid Commun. Mass Spectrom., 1999, 13, 1226–1230 CrossRef CAS PubMed.
- Y. Zhao, B. Zhang, G. Chen, A. Chen, S. Yang and Z. Ye, Food Chem., 2014, 145, 300–305 CrossRef CAS PubMed.
- X. Liu, B. Guo, Y. Wei, J. Shi and S. Sun, Food Chem., 2013, 140, 135–140 CrossRef CAS PubMed.
- Y. Zhao, S. Yang and D. Wang, J. Sci. Food Agric., 2016, 96, 3950–3955 CrossRef CAS PubMed.
- Y. M. Park, C. M. Lee, J. H. Hong, N. Jamila, N. Khan, J. H. Jung, Y. C. Jung and K. S. Kim, Meat Sci., 2018, 143, 93–103 CrossRef CAS PubMed.
Footnotes |
| † Electronic supplementary information (ESI) available: Fig. S1. See https://doi.org/10.1039/d2ra02649j |
| ‡ These authors contributed equally to this work. |
| This journal is © The Royal Society of Chemistry 2022 |

