DOI:
10.1039/D2RA02574D
(Paper)
RSC Adv., 2022,
12, 23193-23203
Real time optical detection of gold in living cells through genetically-encoded probe†
Received
22nd April 2022
, Accepted 28th July 2022
First published on 16th August 2022
Abstract
To study the efflux of gold (Au) in living cells, a genetically encoded fluorescence resonance energy transfer (FRET)-based sensor has been developed. The gold-sensing domain GolB from Salmonella typhimurium has been fused to the N- and C-termini of the FRET pair enhanced cyan fluorescent protein (ECFP) and Venus respectively. In living cells, this probe is highly selective and sensitive to gold and it can withstand changes in variable pH ranges. GolSeN-25, the most efficient sensor variant, binds gold with an affinity (Kd) of 0.3 × 10⁻⁶ M, covering gold concentrations of nM to μM, and can be used for non-invasive real-time in vivo gold measurement in living cells. A simple and sensitive FRET probe was designed for the detection of gold with high selectivity and can be applied to the analysis of real samples.
1. Introduction
Gold, a valuable precious metal, was used for coinage, jewelry, and other arts long before recorded history began. The unique physical and chemical properties of gold have led to its numerous applications in electronic materials, catalysts, medicines, sensing materials, and so on. Gold ions have been used as catalysts to activate C–C triple bonds due to their high alkynophilicity.1–3 Gold-based drugs such as solganol, sanocrysin and auranon, have been used to treat diseases such as rheumatic arthritis, asthma, tuberculosis, malaria, cancer, HIV and brain lesions.4–8 Despite these wide applications, it should be noted that gold is also highly toxic because of its binding affinity to DNA, leads to its subsequent cleavage.9,10 Gold has been linked to nephrotoxicity, which in some cases can result in glomerulonephritis and nephritic syndrome.11 Gold complexes also cause hematological abnormalities such as eosinophilia, thrombocytopenia, and in some cases aplastic anemia.12 The small size of gold nanoparticles which are widely used in anticancer therapies and diagnostic medicines have been linked to gold toxicity. This affects the endocytosis, cellular processing, and an increase in oxidative stress as a result of free radical formation in cells.13 The widespread use of gold in the food industry is easily accessible to biological bodies and concentrates through food chains, leading to protein denaturation, bleeding disorders, and bone marrow suppression. Gold ions are known to promote nucleophilic addition by activating carbon–carbon multiple bonds, especially in alkynes.14,15 Strong oxidants found in the environment and biological systems have been shown in studies to chemically oxidize metallic gold to ionic states.16,17 These ionic gold species (i.e., Au+ and Au3+) are highly reactive and potentially toxic to humans.18,19 Au+ is oxidized to Au3+ via a redox system involving myeloperoxidase and other lysosomal enzymes within gold-containing phagolysosomes. Au3+ diffuses away from its source, interacting with and denaturing nearby proteins, which could explain why autoimmunity develops in a few cases of gold therapy.12 Hence, monitoring the presence of gold ions in both living and natural locations becomes a very serious issue.15,20 The traditional analytical methods for detecting gold species rely on a variety of instrumental techniques such as flame atomic absorption spectrometry (FAAS), graphite furnace atomic absorption spectrometry (GFAAS),21–23 inductively coupled plasma atomic emission spectrometry (ICP-AES),inductively coupled plasma mass spectrometry (ICP-MS),24,25 and electrochemical assay.26 However, these traditional methods require complicated sample preparation and separation procedures before analysis, with poor quantitative reproducibility, especially for determining trace amounts of gold ions in live cells. In this regard, molecular sensors relying on FRET appear good alternatives over these sensors.
Interestingly, molecular sensors operating reversibly towards gold ion detection are scarce, most predominantly due to design and synthesis challenges.27–29 Therefore, it is highly desirable to develop effective methods for monitoring gold ions in environmental and biological samples. FRET probes are powerful tools for monitoring biologically relevant species in vitro and in vivo due to their simplicity and high sensitivity.30–34 With these considerations in mind, we report a genetically encoded FRET-based nanosensor for detecting gold ions in living cells with high resolution and non-invasively. The ligand sensing domain GolB was sandwiched between two fluorescent proteins to develop a FRET-based nanosensor to detect gold ions, allowing non-invasive optical detection of gold in real-time. The reporter elements used were enhanced cyan fluorescent protein (ECFP) and Venus. The gold-binding domain undergoes a conformational change upon binding of ligand, altering the distance between the two fluorophores giving a signal in the form of fluorescence. The nanosensor is genetically encoded and potentially non-invasive, establishing its effectiveness and can be used in cellular systems to detect gold ions with high spatiotemporal resolution. The nanosensor was successfully expressed in living cells and real-time gold monitoring was done with confocal microscopy. This probe has several distinguishing characteristics, including high sensitivity and selectivity to the gold ions, significant fluorescence enhancement, rapid response, good cell membrane permeability, and excellent live-cell imaging. These desirable attributes render the sensor suitable for detecting gold ions in living cells.
2. Experimental
2.1. Design of sensor construct
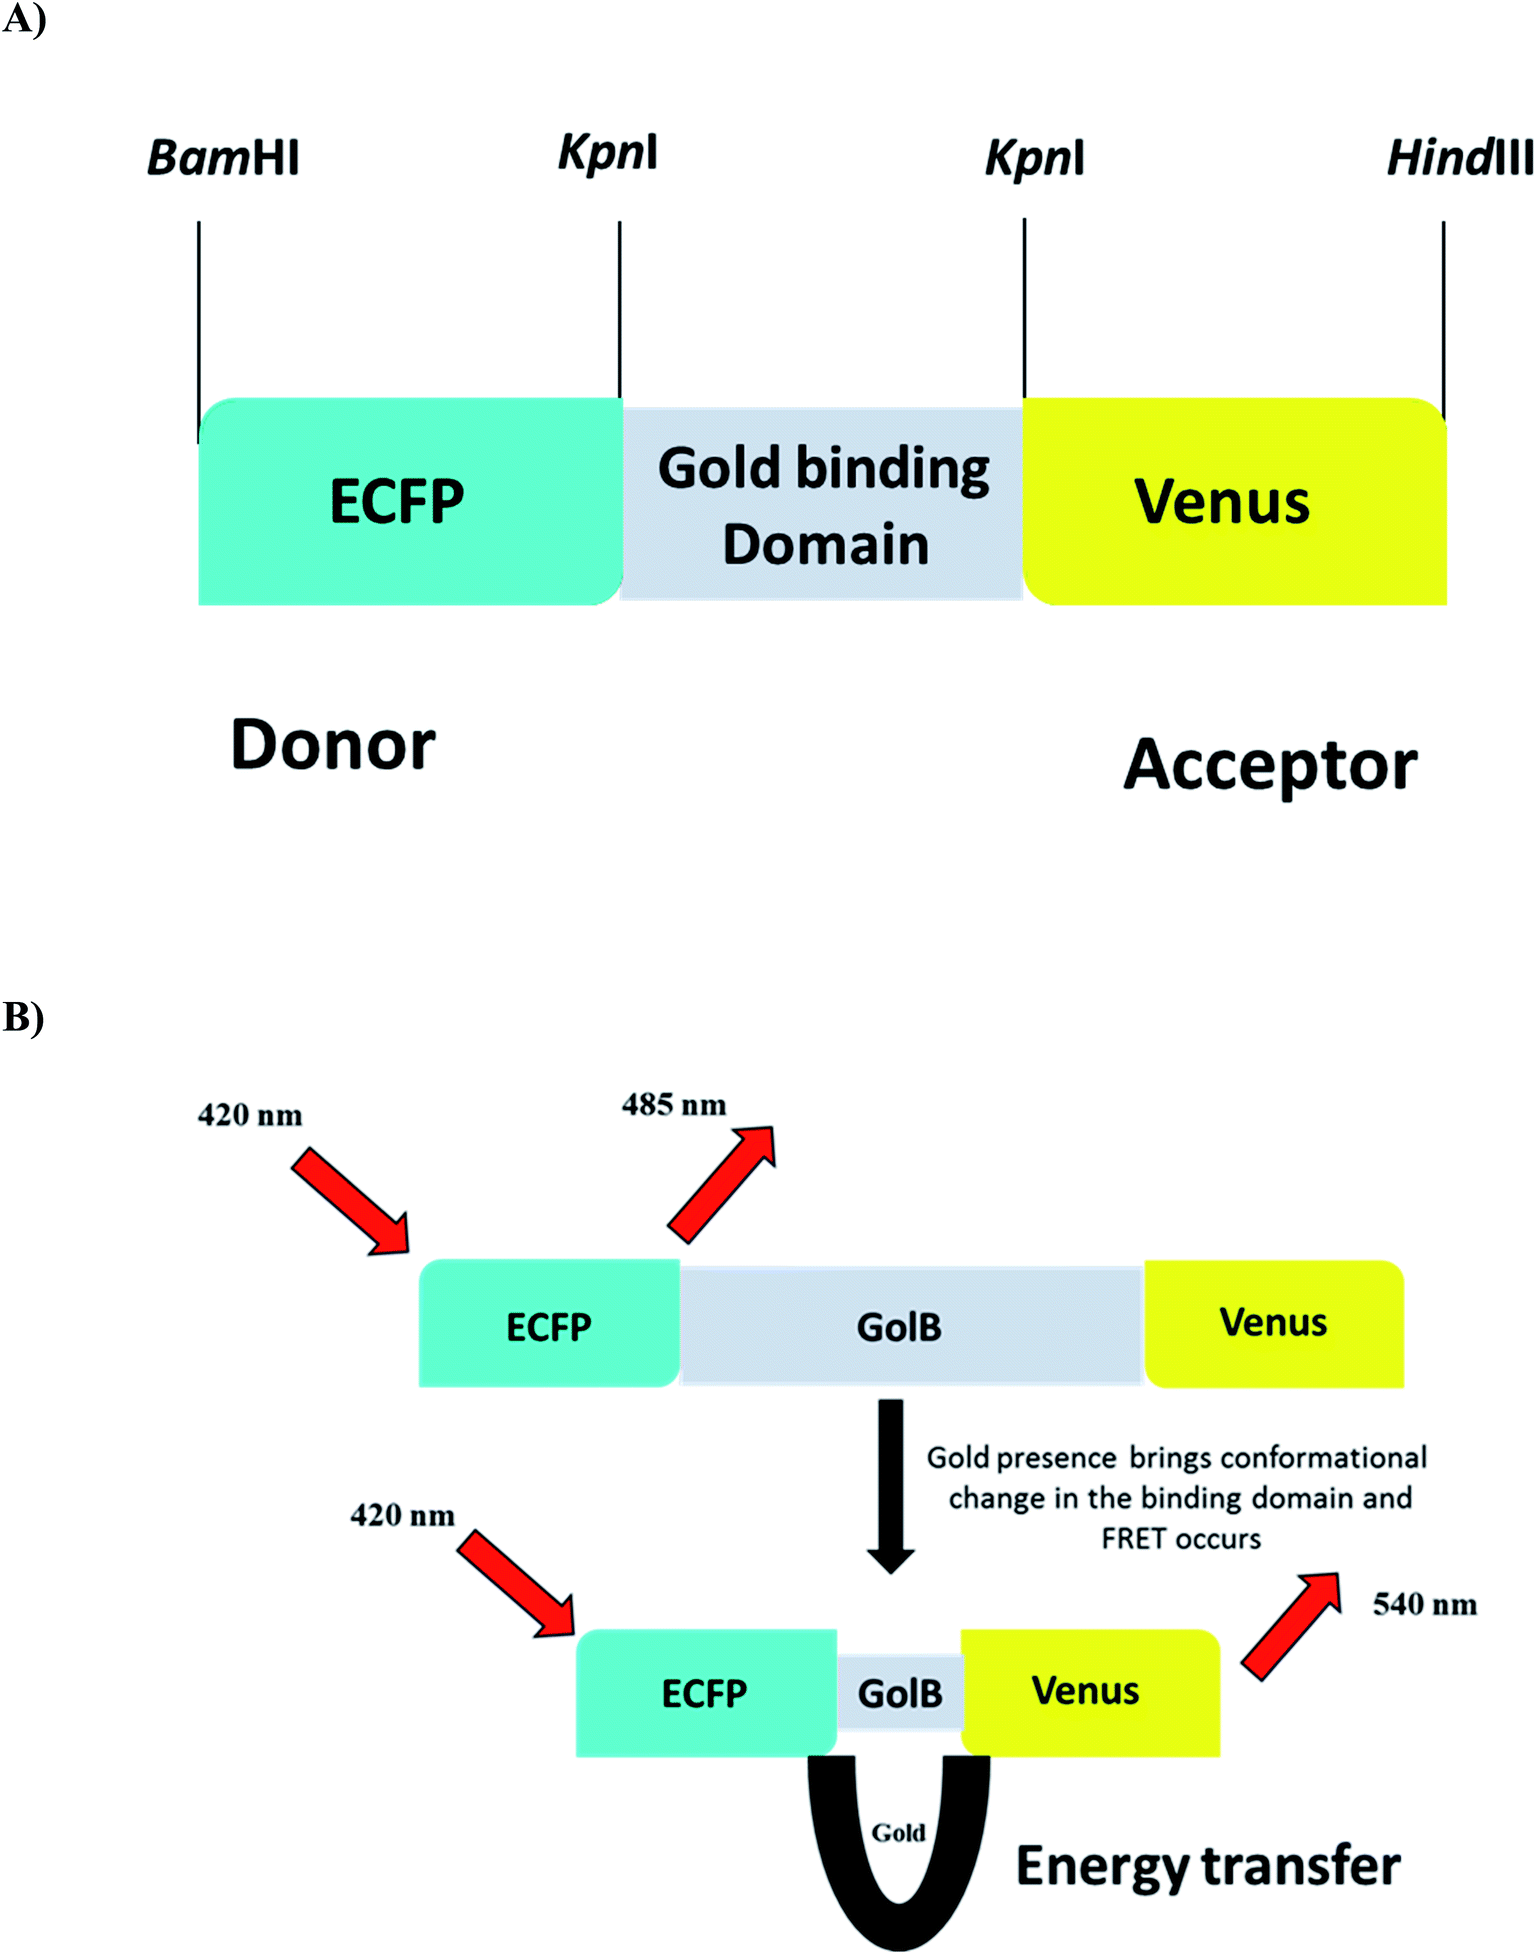
The donor fluorophore (ECFP) and acceptor fluorophore (Venus) was attached to the pRSET-B vector (Invitrogen, USA) to create a cassette. ECFP amplified with restriction sites BamHI at the 5′ end and KpnI sites at the 3′ end and the flanking bases of the recognition sequences were used. Venus was amplified using a similar strategy, with KpnI and HindIII enzyme sites at the 5′ and 3′ ends, respectively. Gold binding protein (GolB) was identified as the recognition element for developing a FRET-based gold nanosensor. The GolB (PDB ID 4Y2I) protein and crystal structure sequence were obtained from the National Centre for Biotechnology Information (NCBI) database and the Protein Data Bank, respectively. The Signal P4.1 server (CBS, Denmark) was used to identify signal peptides of 23 amino acids from the gold binding protein's N-terminus. With restriction sites KpnI on both ends, the GolB gene sequence was amplified from Salmonella typhimurium genomic DNA (ATCC, United States). By sandwiching the amplified GolB gene between ECFP and Venus, a chimeric pRSET-B–ECFP–GolB–Venus construct with an in-frame, His tag at the amino terminus was created. Full-length sequencing was used to confirm the fidelity of the pRSET-B_ECFP_GolB_Venus construct (Fig. S1†). Following the manufacturer's instructions, these sequences were transferred to the pYES-DEST52 vector (Invitrogen, USA) using gateway cloning technology and the LR Clonase II. S. cerevisiae (BY4742) (ATCC, United States) was grown in a liquid YEPD (yeast extract peptone dextrose) medium with 30 °C shaker aeration and maintained on YEPD agar with 1% yeast extract, 2% peptone, and 2% glucose. The chimeric sequence was excised from the bacterial expression vector and sub-cloned at BamHI and HindIII sites in the mammalian expression vector pcDNA3.1 (−) (Invitrogen, USA), yielding pcDNA_ECFP–GolSeN-25_Venus for expression in the human embryonic kidney (HEK)-293T (ATCC, United States) cell lines.
2.2. Expression and purification of recombinant protein
The construct pRSET-B–ECFP–GolB–Venus was transformed in E. coli Rosetta by heat shock method to express the sensor in bacterial cells. Inoculating a single transformed colony in LB (Luria–Bertani) broth at 20 °C until the OD600 reached 0.4 was used to achieve the expression. The cells were induced with 1 mM IPTG (isopropyl-D-1-thiogalactopyranoside) (Himedia, India) and grown at 18 °C on a rotary shaker with adequate aeration in the dark to avoid photobleaching of the two fluorophores for 16 hours. After centrifugation at 6500 × g for 20 minutes, the bacterial cells were resuspended in 20 mM Tris–Cl, pH 8.0, and lysed with a sonicator (Sonics, USA) to release the sensor protein, which was collected by centrifugation at 6500 × g for 30 minutes. Using His-tag affinity chromatography, the sensor protein was purified with Ni–NTA (nickel–nitrilotriacetic acid) (Himedia) beads. A buffer of 20 mM Tris–Cl and 10 mM imidazole, pH 8.0, was used to equilibrate the Ni–NTA resin. Protein binding was performed for 30 minutes at 4 °C; the column was washed with a wash buffer of 20 mM Tris–Cl and 20 mM imidazole, pH 8.0. The sensor protein was eluted by using the buffer of 20 mM Tris–Cl and 250 mM imidazole, pH 8.0, and kept overnight at 4 °C to ensure proper folding. A 10% sodium dodecyl sulfate-polyacrylamide gel electrophoresis (SDS-PAGE) was used to confirm the chimeric protein purity. GolSeN was the name given to the purified sensor protein (goldsensor).
2.3. In vitro characterization of GolSen
Excitation of ECFP at 420 nm on a monochromator microplate reader (Synergy H1, Biotek, USA) was used to obtain the fluorescence emission spectrum of the purified sensor protein, with emission fluorescence intensity measured between 460 nm and 600 nm. The sensor protein's stability was assessed by diluting it in 20 mM of each of three buffers: 3-(N-morpholino)propanesulfonic acid (MOPS), Tris buffer saline (TBS), and PBS with a pH range of 5.0–8.0 and measuring the changes in FRET ratio. Furthermore, the stability of the GolSeN in the 20 mM MOPS buffer was tested in the absence and presence of 5 μM gold (HAuCl4) ions. Once the protein's stability was confirmed, it was diluted 20 times in a 20 mM MOPS buffer to characterize the purified protein further. By mixing 180 μL of diluted protein with 20 μL of corresponding metal ions, the specificity of GolSeN to metal ions such as silver, copper, mercury, nickel, phosphorous, sulphur and chlorine was investigated. The FRET ratio was checked using a 96-well microplate monochromator reader with a 420 nm excitation filter and two emission filters of 485 nm and 540 nm for ECFP and Venus. Readings were taken in triplicate with each metal ion at concentrations of 10 nM, 100 nM, 200 nM, 1 μM and 5 μM. Furthermore, the change in emission intensity ratio 540/485 nm was determined to conduct competitive experiments by adding intracellular biological species to the sensor protein in the presence of 5 μM gold ions. The effect of biologically relevant metal ions like Ca2+, Mg2+, Na+, and K+ on the detection specificity of the nanosensor was also investigated. The fluorescence intensity ratio was measured with the addition of 5 μM gold ions.
2.4. Site-directed mutagenesis and ligand-binding isotherm
The affinity of GolSeN to gold in the nanomolar to micromolar concentration range was used to generate a ligand saturation curve. After obtaining the saturation curve, the affinity constant (Kd) was calculated by fitting the curve in the binding isotherm:
| S = (r − rapo)/(rsat − rapo) = [L]/(Kd + [L]) |
where, S is saturation; [L] is ligand concentration; r is ratio; rapo is ratio in the absence of ligand and, rsat is ratio at saturation with the ligand (GraphPad Prism 7 software).
All of the readings were taken in triplicate on a monochromator reader with a 96-well microplate. To improve the detection range of GolSeN for gold, affinity mutants were created. The Quick-Change site-directed mutagenesis kit (Agilent, USA) introduced point mutations. At positions 15, 22, and 25 of the GolB protein arginine was replaced with aspartic acid, serine was replaced with leucine and alanine was replaced with tryptophan. To confirm mutations, Sanger sequencing was performed through outsourcing. GolSeN-15, GolSeN-22, and GolSeN-25 were the names of the mutants. The purpose of these variants was to improve the sensor protein's binding to gold. When compared to wild-type (WT) protein, GolSeN-25 improves gold detection. As previously mentioned, the mutants were purified and characterized. In vivo, cellular assays were also carried out using the GolSeN-25 variant.
2.5. In vivo characterization of GolSeN-25 in bacterial cells
Time-dependent in vivo evaluation of the sensor in live bacterial cells was performed after transforming GolSeN-25 in E. coli-Rosetta. At 20 °C, a single colony from the transformed plate was inoculated in 100 mL LB broth until an OD600 of 0.4 was achieved. Cells were incubated in the dark at 18 °C for 30 hours with IPTG (1 mM). To separate the media, the cells were harvested and suspended in a 20 mM MOPS buffer at pH 7.2. In addition, 180 μL of bacterial cell suspension was mixed with 1 μM gold in triplicates in a 96-well microplate for 45 minutes, with the FRET ratio measured every 5 minutes. After fixing the expressed bacterial cells on a glass slide with medical adhesive, a confocal microscope (Leica, Wetzlar, Germany) with a TCS-SPE confocal head, a 63 objective piece with 1.53 NA, and a coupled camera were used to check the expression and take images of GolSeN-25.
2.6. Detection and monitoring of gold in eukaryotic cell
The uptake of gold into yeast cells was studied by transforming S. cerevisiae with GolSeN-25. The transformed colony was inoculated in liquid YEPD broth for the sensor protein expression and grown in synthetic defined (SD) medium for 4 days with 2% sucrose and 3% galactose. The yeast cells were then incubated with 5 μm gold, and the 540/485 nm ratio was monitored for 8 minutes using the LAS-AF software of the confocal microscope, with the wavelength of excitation set to 420 nm and two sets of emission filters, 485 nm for the donor ECFP and 540 nm for the acceptor Venus. Confocal images were obtained after fixing the yeast cells on a poly L-lysine coated glass slide. The dual emission intensity ratio was calculated by selecting the region of interest (ROI) and subtracting the background fluorescence. HEK-293T cells were transfected with GolSeN-25 using the calcium phosphate method to express the sensor in mammalian cells. The cells were grown in 6-well plates and cultured at 37 °C in Dulbecco's Modified Eagle's Medium (DMEM) (Sigma-Aldrich, USA) with 10% fetal calf serum and 50 g mL−1 ampicillin. The cells were cultured for another 48 hours following transfection in a CO2 humidifier chamber to express the sensor. The HEK-293-T cells were then washed with PBS buffer (pH 7.5), and ratiometric cell imaging was performed on a confocal microscope using 1.53 NA.
2.7. Toxicological studies
In a humidified CO2 chamber with 5% CO2 at 37 °C, the HEK-293T cell culture was maintained in DMEM supplemented with 10% heat-inactivated FBS and 1% antibiotic–antimycotic cocktail. To determine the level of toxicity of gold, the MTT (3-(4,5-dimethylthiazol-2-yl)-2,5-diphenyl-2H-tetrazolium bromide) assay was used. In a 96-well culture plate, 9000–10![[thin space (1/6-em)]](https://www.rsc.org/images/entities/char_2009.gif) 000 cells were plated per well. The cells were incubated at 37 °C for 24 hours in a CO2 incubator. The old media was removed after the cells reached 80% confluency, and the cells were treated with increasing concentrations of gold for 12 hours. The experiment has been repeated a total of three times. After incubation, the cells were washed and incubated for 45 hours at 37 °C in a CO2 incubator with 100 μL of incomplete DMEM media and 10 μL of MTT solution. To solubilize the remaining black formazan crystals on the rocker shaker, the supernatant media of cells were replaced with 150–200 L of dimethyl sulfoxide. When the formazan is dissolved, it turns a purple-blue color. The absorbance of the resultant solution was measured using a microplate ELISA reader (Bio-Rad) at a wavelength of 570 nm after 30 minutes. Finally, the viability of the cells was determined, and a graph was drawn against gold ion concentrations.
000 cells were plated per well. The cells were incubated at 37 °C for 24 hours in a CO2 incubator. The old media was removed after the cells reached 80% confluency, and the cells were treated with increasing concentrations of gold for 12 hours. The experiment has been repeated a total of three times. After incubation, the cells were washed and incubated for 45 hours at 37 °C in a CO2 incubator with 100 μL of incomplete DMEM media and 10 μL of MTT solution. To solubilize the remaining black formazan crystals on the rocker shaker, the supernatant media of cells were replaced with 150–200 L of dimethyl sulfoxide. When the formazan is dissolved, it turns a purple-blue color. The absorbance of the resultant solution was measured using a microplate ELISA reader (Bio-Rad) at a wavelength of 570 nm after 30 minutes. Finally, the viability of the cells was determined, and a graph was drawn against gold ion concentrations.
3. Results and discussion
3.1. Construction of the nanosensor
The biocompatibility and appropriation of gold for use in medicine are excellent. Gold is easily accessible to biological bodies and concentrates through food chains due to its widespread use in the food industry, resulting in protein denaturation and toxicity in humans and animals. Monitoring the presence of gold species in living cells become a severe problem. Due to simplicity and high sensitivity, fluorescent probes are effective tools for monitoring biologically relevant species in vitro and in vivo.20 FRET-based genetically encoded nanosensors are an effective approach and a powerful tool for real-time monitoring of spatially and temporally distributed metal ions in cellular and subcellular site. With these considerations in mind, a cassette was created by sequentially cloning the fluorescent proteins ECFP and Venus into the bacterial expression vector pRSET-B. In addition, the gene GolB was inserted into the cassette prepared. This highly efficient nanosensor for gold detection was characterized both in vitro and in vivo to understand the homeostasis of this metal ion in real-time. The linear arrangement of the restriction sites used to build the nanosensor is shown in (Fig. 1A and B) as a schematic representation of nanosensor construction for gold monitoring. The fidelity of the final sensor was confirmed using Sanger sequencing, as shown in Fig. S1.† Fluorescent probes such as molecular organic dyes and quantum dots detect cell activity, expression levels and flux rates in live cells.35 The cellular toxicity of these probes in biological applications and the difficulty of incorporating dye-based sensors into live cells are significant drawbacks. Due to these constraints, the focus has shifted in recent years to use genetically encoded fluorescent probes.31
 |
| | Fig. 1 (A) Construct of GolSeN (B) depicting the energy transmission in the presence and absence of gold. | |
3.2. Expression and purification of the recombinant protein
The chimeric FRET sensor was transformed into E. coli-Rosetta for recombinant protein expression. The cells were grown at 20 °C until the OD reached 0.4, then induced with 1 mM IPTG at 18 °C on a rotary shaker for the next 30 hours. Due to the photosensitivity of the fluorescent proteins, the flasks were covered after induction to create dark conditions. Because the fusion protein has an N-terminal 6× tag, affinity chromatography was used to purify the sensor protein. The size of the sensor protein (58.62 kDa) was confirmed by SDS-PAGE (Fig. S2†).
3.3. Spectral profile of the GolSeN
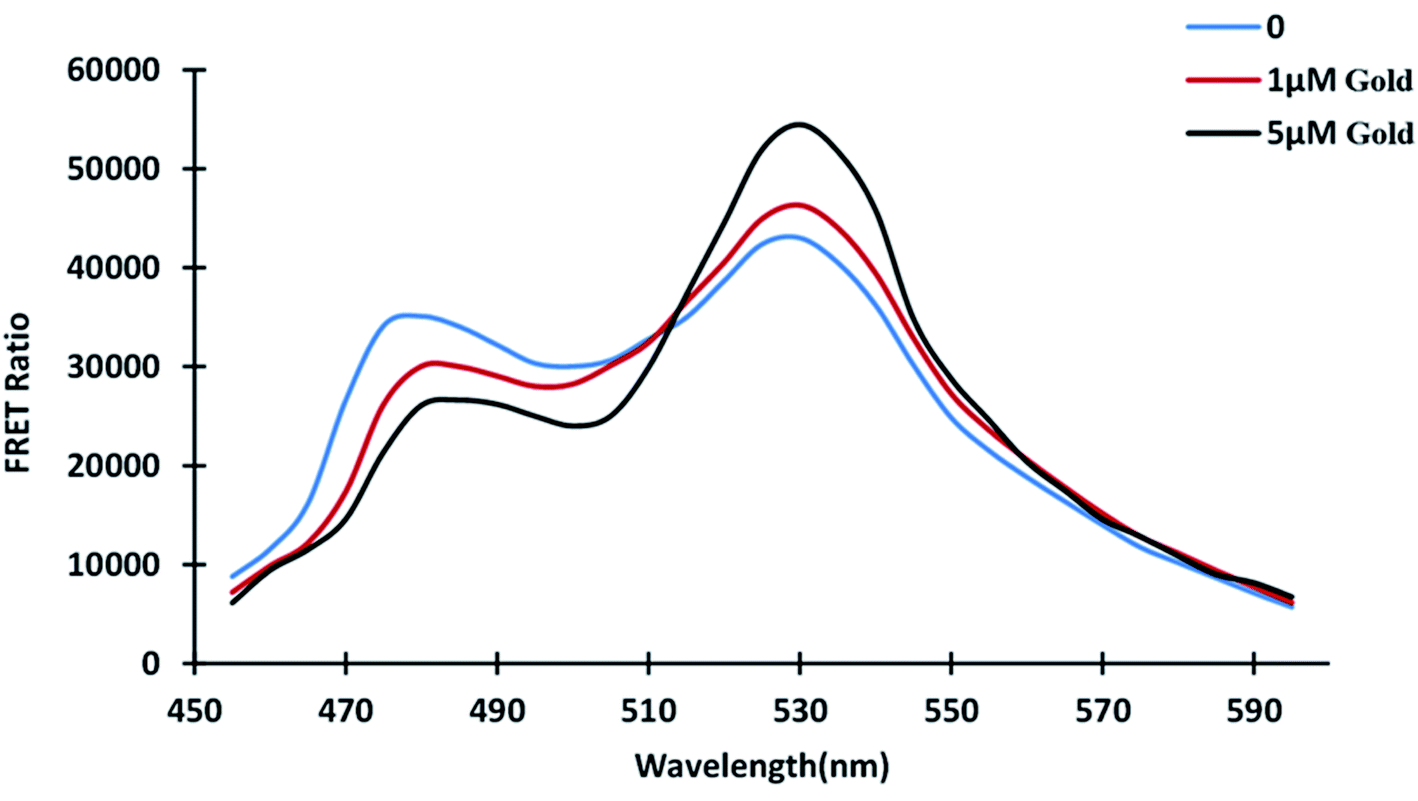
The distance between the donor and acceptor molecules, which must be within 1–10 nm, is significant in FRET. The donor emission spectrum and the acceptor excitation spectrum must overlap, and the donor and acceptor dipoles must be parallel aligned for FRET phenomenon. Two major fluorescent protein characteristics determine the efficiency of FRET-based biosensors: high donor quantity and high acceptor absorption coefficient.31,36 According to emission spectral analysis, fluorescent proteins' emission spectrum shifted in the presence and absence of gold. The emission profile was obtained by placing 180 μL of protein in a 96-well plate in the absence of gold and varying the concentrations of gold. The profile shows how gold binding alters the conformation of the GolB domain. The intensity of ECFP emission decreases as the intensity of Venus emission rises (Fig. 2). The energy transfer from the donor fluorophore ECFP to the acceptor Venus causes the subsequent increase in Venus emission intensity. The FRET refers to the non-radiative energy transfer between the two fluorophores, and we have successfully converted the GolB as the binding domain to a FRET sensor. FRET-based nanosensors, which are very effective in metabolite localization and quantification studies were developed using this strategy.37–39
 |
| | Fig. 2 In vitro GolSeN emission spectral scan. At wavelengths ranging from 460 to 590 nm, the spectrum was captured. As gold is added, the relative fluorescence intensity of the donor and acceptor fluorophores changes. | |
3.4. Stability of the nanosensor
Testing of purified nanosensor protein in various buffer systems with pH values ranging from 5.0 to 8.0 was performed. The constructed nanosensor showed the stability in the MOPS buffer, with the least alteration in the ratio of the different buffer systems (Fig. 3A). The sensor protein was diluted in MOPS buffer to allow further investigation. The FRET ratio was determined in the absence and presence of 5 μM gold by diluting GolSeN in 20 mM MOPS buffer in the pH range 5.0–8.0. On a 96-well plate monochromator reader, the assay was performed in triplicates. In the acidic pH range, the change in the FRET ratio was quite significant. The purified sensor protein appears to stabilize in an alkaline environment, such as above pH 7.0, as only a minor but non-significant change in the ratio has been observed (Fig. 3B). This sensor can be used in vivo to study gold flux in yeast cells because S. cerevisiae has a cytosolic pH of around 7.0.40
 |
| | Fig. 3 Stability with pH. (A) GolSeN was diluted in various buffers with pH values ranging from 5.0 to 8.0. (B) The nanosensor's stability was tested in MOPS buffer with and without 0.5 μM gold in a physiological pH range of 5.0 to 8.0. | |
3.5. In vitro characterization of the GolSeN
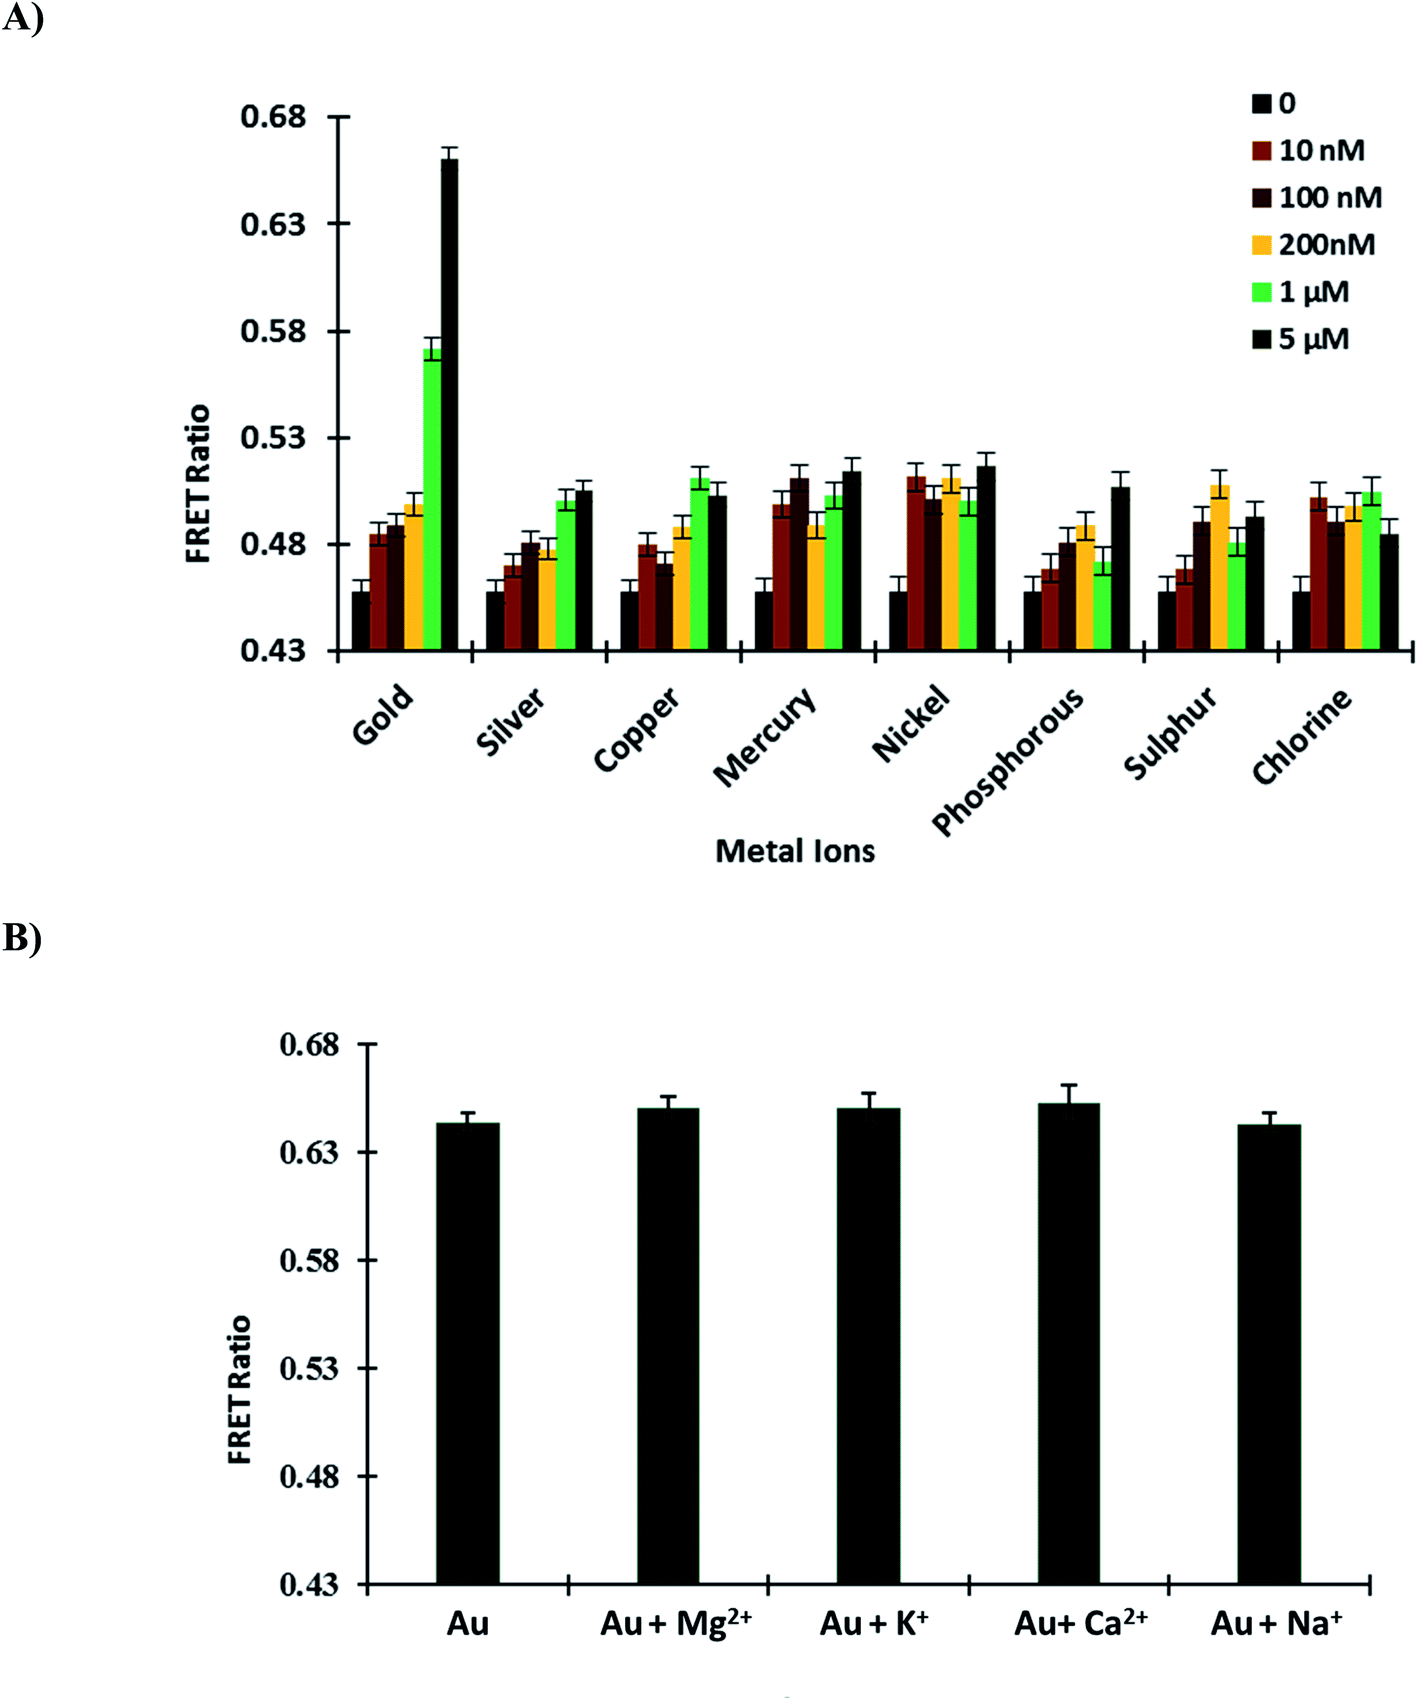
3.5.1. Specificity and selectivity of GolSeN for gold. Periplasmic binding proteins (PBPs) have a window thanks to FRET-based nanosensors. The ligand sensing domain, which binds with specific substrates, is best suited for these nanosensors.34 To confirm the GolSeN specificity and selectivity for gold, the sensor protein was titrated against various metal ions (silver, copper, mercury, nickel, phosphorous, sulphur and chlorine) in a 96-well plate. These metal ions were used to test the protein's specificity and selectivity at various concentrations. The maximum ratio change was obtained with gold at a concentration of 5 μM, implying that GolSeN is extremely gold sensitive and selective. On the contrary, minor but non-significant variations in the ratio were observed with other metal ions (Fig. 4A). The observed ratiometric changes result from conformational changes in the ligand sensing domain caused by standard periplasmic binding protein hinge bending and twisting movements.37
 |
| | Fig. 4 GolSeN in vitro testing (A) to confirm the sensor protein's specificity, the FRET ratio was measured in the presence of several metal ions. (B) Essential metal ions such as Mg2+, K+, Ca2+, and Na+ do not affect the efficiency of the nanosensor and do not interfere with GolSeN specificity. Vertical bars indicate the standard error. | |
3.5.2. Effect of other metal ions. Competition experiments with potential intracellular interferents such as biologically essential metal ions Mg2+, K+, Ca2+ and Na+ were also carried out in the presence of 5 μM gold. When the sensor protein was mixed with these biological species, there was almost no change in the FRET ratio, implying that these potential intracellular interferents did not affect the sensor (Fig. 4B). As a result, it was discovered that gold sensing is not hampered when these species coexist in living cells.
3.5.3. Engineered affinity sensors. Previously, genetically encoded sensors were adopted, demonstrating the benefit of using GFP variants as a highly efficient FRET pair.34 To introduce point mutations in the wild type (WT), site-directed mutagenesis was used to create R15D, A25W, and S22L mutants. The locations of the point mutations were chosen at random. Protein conformational stability is provided by non-covalent interactions such as increased hydrogen bond formations contributed by polar residues. The mutations were confirmed through Sanger sequencing. After measuring the affinity of the mutant proteins, the affinity constant Kd was calculated. The calculated Kd for WT and mutants R15D, A25W, and S22L were 0.7 M, 0.3 M, 0.2 M, and 1.15 M, respectively (Fig. 5 and Table 1). The affinity constant of mutant sensors differ from those of wild-type sensors. Point mutations in the sensor's sensing domain alter its substrate-binding properties, allowing it to detect gold concentrations. GolSeN-25 was chosen as the most effective based on the binding constant values and was used in real-time in vivo cellular experiments.
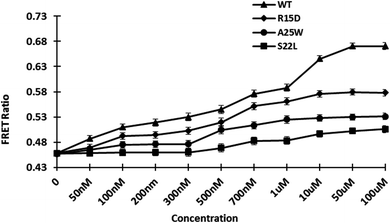 |
| | Fig. 5 In vitro ligand-dependent FRET emission changes of WT and mutant sensors in the presence of varying gold concentrations. Affinity mutants GolSeN-15, GolSeN-25, and GolSeN-22, were created and compared to the WT sensor protein. | |
Table 1 The dynamic range of GolSeN binding affinity variants and the relationship between GolSeN binding affinity constants
| Nanosensor |
Sequence |
Kd (μM) |
Range to detect |
| GolSeN |
WT |
0.7 |
0.02–20 μM |
| GolSeN-15 |
15 |
0.3 |
0.05–5 μM |
| GolSeN-25 |
25 |
0.2 |
0.04–0.9 μM |
| GolSeN-22 |
22 |
1.15 |
0.06–5 μM |
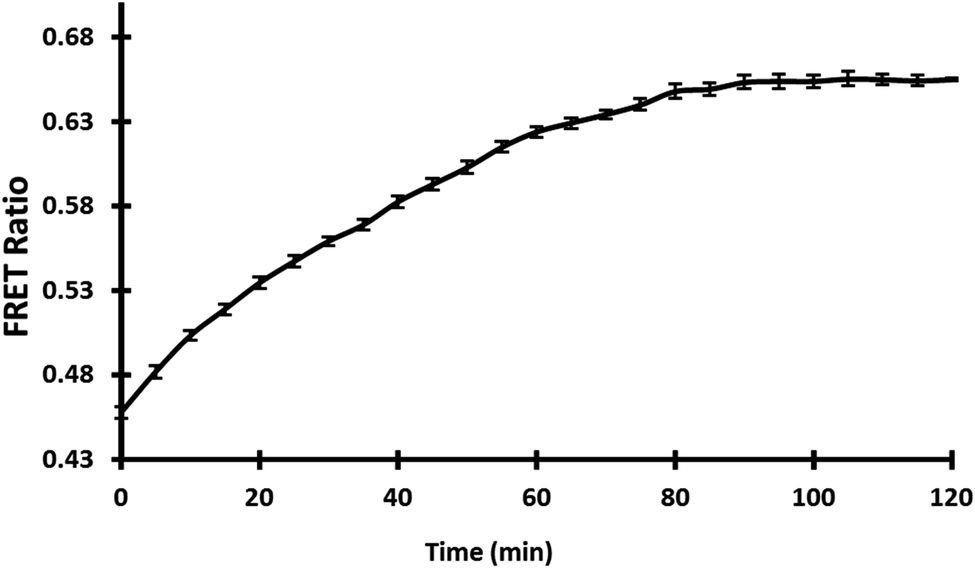
3.5.4. In vivo measurement of gold in bacterial cells. Several genetically encoded FRET-based nanosensors for small molecules and metabolites have been successfully constructed so far to monitor the concentration of any specific metabolite in vivo in real-time with high specificity and selectivity.33,41 With the expression of nanosensor in E. coli-Rosetta strain, real-time and in vivo monitoring of GolSeN-25 in bacterial cells was performed. Live cell images taken with a confocal microscope show that the sensor is successfully expressed in bacterial cells (Fig. S3†). The in vivo bacterial assay used gold at a concentration of 5 μM in a 96-well microplate, and the FRET ratio was measured every 5 minutes for a total of 120 minutes. The addition of 5 μM gold resulted in a significant increase in the FRET ratio for up to 30 minutes, after which it became saturated (Fig. 6). Each measurement was recorded in triplicate. The in vivo results show that the GolSeN-25 sensor can measure gold concentration in live bacterial cells in real-time.
 |
| | Fig. 6 Cells were used to examine the nanosensor. In bacterial cells carrying GolSeN-25, FRET ratio variations were time-dependent in response to gold. | |
3.5.5. Monitoring of gold in Saccharomyces cerevisiae. The use of genetically encoded fluorescent sensors allows analyzing metabolite dynamics in living organisms in a quick, sensitive, precise, and real-time manner, potentially filling a gap in current techniques.42 The model organism S. cerevisiae BY4742 was used to investigate the mechanism of gold uptake in yeast. Yeast cells can be used as a model for studying metal ion trafficking and diseases caused by a nutrient imbalance in humans because of their highly conserved protein nature.43 The pYEST-DEST52 vector was used as a destination vector to transform GolSeN-25 into S. cerevisiae and express it as a sensor protein. The expression of sensor GolSeN-25 in yeast cells was carried out in 2% sucrose and 3% galactose. A confocal microscope was used to obtain ratiometric images of the cells expressing the GolSeN-25 (Fig. 7A and S4†). The yeast cells were given 5 μM gold, and the FRET ratio was measured in vivo. After adding gold, the fluorescence intensities of the two fluorophores were measured. In the presence of gold, the fluorescence intensity of Venus increases, followed by a decrease in the emission intensity of ECFP (Fig. 7B). For the first 4 minutes, the FRET ratio increased, and then plateau, with little or no further ratiometric change. Gold is transported to the cytosol and recognized by GolSeN-25, resulting in a FRET signal, according to this model. After gold has been taken up into the cytosol of yeast, the GolSeN-25 detects it, as a result, the FRET ratio increases. The change in the FRET ratio can be used to estimate the amount of gold present in live cells. Several sensors that respond to dynamic changes in the concentration of specific metabolites have been reported in the literature previously. SenALiB a genetically encoded FRET based probe was developed for monitoring of arsenic levels in live cells.
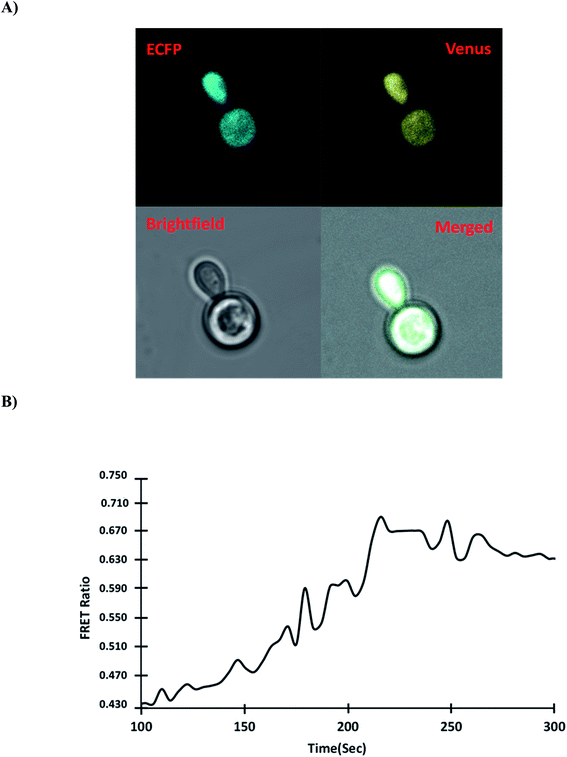 |
| | Fig. 7 Measurement of the dynamic flux rate of gold uptake in yeast cells in real-time. (A) In the presence of gold, confocal images of GolSeN-25 expression in the cytoplasm of yeast cells. (B) In the presence of 5 μM gold, the graph depicts the change in FRET ratio in the cytoplasm of yeast cells and ratiometric changes in a single cell. A difference in the FRET ratio indicates the import and binding of gold with GolSeN-25. | |
3.5.6. Monitoring the gold in HEK-293T cells. The uptake and distribution of gold were studied non-invasively in real-time using a mammalian HEK-293T cell line transfected with GolSeN-25. The Leica microscope's confocal images revealed that the transfected cells had successfully expressed GolSeN-25 (Fig. 8A). With the addition of 5 μM gold, the change in emission intensity ratio was measured over 8 minutes and showed a steady increase. The FRET ratio increases dramatically overtime when the cells are exposed to 5 μM gold. The changes revealed a decrease in the intensity of ECFP emission, followed by an increase in the intensity of Venus (Fig. 8B). This sensor promises to detect and monitor gold in eukaryotic cells in real-time without causing the cells to break down. The ability of genetically encoded FRET-based nanosensors to detect and monitor metabolites such as metal ions in cellular and subcellular components of a mammalian cell has previously been demonstrated, as shown in the case of intracellular fluctuations of second messenger cAMP.44 When animal cells are transfected with genetically encoded GolSeN-25, it has much potential for detecting, tracking, and localizing gold levels in mammalian cells in real-time. The performance of the developed sensor was compared with that of some other reported probes in Table 2. Previously developed sensors are dye/QD based, however GolSeN-25 is genetically encoded and fluorescent proteins have been used to develop the sensor.
 |
| | Fig. 8 GolSeN-25 imaging in the HEK-293T cell line in real-time. (A) In the presence of gold, confocal images of GolSeN-25 expression in the HEK-293T cell line. (B) GolSeN-25 was transfected into HEK-293T cells, and the changes in the emission intensity ratio were tracked throughout the experiment. The graph depicts the Venus/ECFP ratio change over 8 minutes. | |
Table 2 Comparison of the developed method for the determination gold with some previously published methods
| Probe |
Detection limit/μM |
Sensor type |
Reporter proteins |
Ref. |
| Coumarin–alkyne derivative |
0.44 |
Dye based |
Coumarin–alkyne |
45 |
| Thioamide-phenyl-substituted alkynes |
0.039 |
Dye based |
Thioamide |
46 |
| Propargylamide |
0.16 |
Dye based |
Propargylamide |
47 |
| Graphene oxide–poly(vinyl alcohol) hybrid |
0.7 |
Nanoparticle |
Graphene oxide |
18 |
| Rhodamine amide |
0.05 |
Dye based |
Rhodamine |
48 |
| GQDs |
0.5 |
QD |
Graphene QD |
49 |
| FRET sensor (GolSeN-25) |
0.3 |
FRET based |
ECFP–Venus |
This work |
3.5.7. Toxicology studies. In living organisms, gold is known to bind tightly to enzymes and DNA, causing cytotoxicity and eventual damage to the liver, kidney, and peripheral nervous system.50,51 This emphasizes the importance of developing fluorescent probes capable of detecting and imaging gold in cells. To determine the in vivo cytotoxicity of gold, cell viability studies were conducted. Gold was tested in cells at concentrations ranging from 0 to 100 μM to see if it was toxic (Fig. 9). The cell viability results showed that gold treatment becomes toxic at higher concentrations > 5 μM. Hence it was proved GolSeN-25 could monitor the toxicity of gold in live cells.
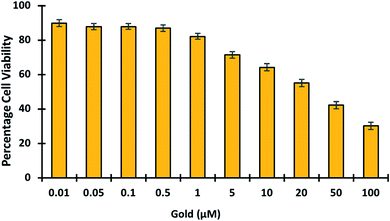 |
| | Fig. 9 MTT studies show the viability of HEK-293T cells in the presence of gold. The viability of HEK-293T cells treated with escalating concentrations of gold (0.01–100 μM). | |
4. Conclusions
In conclusion, we present a FRET-based nanosensor for rapidly detecting and monitoring gold in live cells. The PBP GolB was used to create a genetically encoded FRET nanosensor. The expression and fluorescence scan of the sensor protein was obtained, which shows the transfer of energy from donor (ECFP) to the acceptor (Venus) in gold. Upon investigation with various metal ions, the selectivity and specificity of the sensor to gold were highly observed. Compared to other conventional techniques used so far, the FRET-based technique is simple, non-invasive and cost-effective for detecting and quantifying gold in live cells. The developed nanosensor can detect and help in monitoring gold even at low concentrations. The ability of GolSeN-25 to detect dynamic flux levels of gold in real-time in live cells is demonstrated by its successful expression in bacterial and eukaryotic models, S. cerevisiae, and HEK-293T. Confocal fluorescence images demonstrated that GolSeN-25 is cell-permeable and can be used to monitor gold in living cells non-invasively. It can also be transfected or transformed into cellular compartments, and the toxicity level of this metal ion can be checked with high resolution without disrupting the cells and tissues. This is the first time, to our knowledge, that a genetically encoded FRET-based probe for the detection of gold has been reported with excellent sensing and selectivity extending its potential use in biological systems. The rapid and fluorescent response of the probe is useful for imaging gold in cell.
Conflicts of interest
The authors declare that they have no known competing interests.
Acknowledgements
Financial Assistant in the form of research grant under nanomedicine scheme (no. 35/13/2019-NAN/BMS) from Indian Council of Medical Research, Govt. of India for conducting this research work is gratefully acknowledged. The first author RN is also thankful to the Hamdard National Foundation (HNF) for financial support during the study.
References
- Z. Li, C. Brouwer and C. He, Chem. Rev., 2008, 108, 3239–3265 CrossRef CAS PubMed
 .
. - A. S. K. Hashmi and G. J. Hutchings, Angew. Chem., 2006, 45, 7896–7936 CrossRef PubMed .
- A. Corma and H. Garcia, Chem. Soc. Rev., 2008, 37, 2096–2126 RSC .
- L. Mishulow and C. Krumwiede, J. Immunol., 1927, 14, 77 CAS .
- A. Locke and E. R. Main, J. Am. Med. Assoc., 1928, 90, 259–260 CrossRef .
- A. S. H. Sigel, CRC Press, 2004, ISBN-1135537194, 9781135537197.
- I. Ott, Coord. Chem. Rev., 2009, 253, 1670–1681 CrossRef CAS .
- M. Navarro, Coord. Chem. Rev., 2009, 253, 1619–1626 CrossRef CAS .
- R. H. Freyberg, W. D. Block and S. Levey, J. Clin. Investig., 1941, 20, 401–412 CrossRef CAS PubMed .
- E. E. Connor, J. Mwamuka, A. Gole, C. J. Murphy and M. D. Wyatt, Small, 2005, 1, 325–327 CrossRef CAS PubMed .
- S. L. Best and P. J. Sadler, Gold Bull., 1996, 29, 87–93 CrossRef CAS .
- A. S. Thakor, J. Jokerst, C. Zavaleta, T. F. Massoud and S. S. Gambhir, Nano Lett., 2011, 11, 4029–4036 CrossRef CAS PubMed .
- S. Lanone and J. Boczkowski, Curr. Mol. Med., 2006, 6, 651–663 CrossRef CAS PubMed .
- G. J. Hutchings, M. Brust and H. Schmidbaur, Chem. Soc. Rev., 2008, 37, 1759–1765 RSC .
- Y. Yang, C. Yin, F. Huo and J. Chao, RSC Adv., 2013, 3, 9637–9640 RSC .
- C. Goebel, M. Kubicka-Muranyi, T. Tonn, J. Gonzalez and E. Gleichmann, Arch. Toxicol., 1995, 69, 450–459 CrossRef CAS PubMed .
- J. Zou, Z. Guo, J. A. Parkinson, Y. Chen and P. J. Sadler, Chem. Commun., 1999, 1359–1360, 10.1039/A902646K .
- A. Kundu, R. K. Layek, A. Kuila and A. K. Nandi, ACS Appl. Mater. Interfaces, 2012, 4, 5576–5582 CrossRef CAS PubMed .
- J. Park, S. Choi, T.-I. Kim and Y. Kim, Analyst, 2012, 137, 4411–4414 RSC .
- Y. Yang, B. Bai, M. Jin, Z. Xu, J. Zhang, W. Li, W. Xu, X. Wang and C. Yin, Biosens. Bioelectron., 2016, 86, 939–943 CrossRef CAS PubMed .
- H. B. Senturk, A. Gundogdu, V. N. Bulut, C. Duran, M. Soylak, L. Elci and M. Tufekci, J. Hazard. Mater., 2007, 149, 317–323 CrossRef CAS PubMed .
- M. Soylak and M. Tuzen, J. Hazard. Mater., 2008, 152, 656–661 CrossRef CAS PubMed .
- A. J. Aller and C. García-Olalla, J. Anal. At. Spectrom., 1992, 7, 753–760 RSC .
- M. Hadioui, C. Peyrot and K. Wilkinson, Environ. Sci. Technol., 2015, 49(10), 6141–6148 CrossRef CAS PubMed .
- A. Scheffer, C. Engelhard, M. Sperling and W. Buscher, Anal. Bioanal. Chem., 2008, 390, 249–252 CrossRef CAS PubMed .
- A. Ceresa, A. Radu, S. Peper, E. Bakker and E. Pretsch, Anal. Chem., 2002, 74, 4027–4036 CrossRef CAS PubMed .
- E. E. Langdon-Jones and S. J. A. Pope, Chem. Commun., 2014, 50, 10343–10354 RSC .
- J. Wu, L. Jiang, P. Verwilst, J. An, H. Zeng, L. Zeng, G. Niu and J. S. Kim, Chem. Commun., 2019, 55, 9947–9950 RSC .
- H. Y. Au-Yeung, E. J. New and C. J. Chang, Chem. Commun., 2012, 48, 5268–5270 RSC .
- M. Mohsin, A. Ahmad and M. Iqbal, Biotechnol. Lett., 2015, 37, 1919–1928 CrossRef CAS PubMed .
- M. Mohsin, M. Z. Abdin, L. Nischal, H. Kardam and A. Ahmad, Biosens. Bioelectron., 2013, 50, 72–77 CrossRef CAS PubMed .
- M. Mohsin and A. Ahmad, Biosens. Bioelectron., 2014, 59, 358–364 CrossRef CAS PubMed .
- M. Ahmad, M. Mohsin, S. Iqrar, O. Manzoor, T. O. Siddiqi and A. Ahmad, Sens. Actuators, B, 2018, 257, 866–874 CrossRef CAS .
- N. Soleja, N. Agrawal, R. Nazir, M. Ahmad and M. Mohsin, 3 Biotech, 2020, 10, 87 CrossRef PubMed .
- K. Deuschle, S. Okumoto, M. Fehr, L. L. Looger, L. Kozhukh and W. B. Frommer, Protein Sci., 2005, 14, 2304–2314 CrossRef CAS PubMed .
- S. S. Vogel, C. Thaler and S. V. Koushik, Science's STKE: signal transduction knowledge environment, 2006, 2006, p. re2 Search PubMed .
- M. Fehr, W. B. Frommer and S. Lalonde, Proc. Natl. Acad. Sci. U. S. A., 2002, 99, 9846–9851 CrossRef CAS PubMed .
- N. Agrawal, N. Soleja, R. Bano, R. Nazir, T. O. Siddiqi and M. Mohsin, ACS Omega, 2021, 6, 14164–14173 CrossRef CAS PubMed .
- N. Soleja, O. Manzoor, P. Khan and M. Mohsin, Sci. Rep., 2019, 9, 11240 CrossRef PubMed .
- R. Orij, J. Postmus, A. T. Beek, S. Brul and G. J. Smits, Microbiology, 2009, 155, 268–278 CrossRef CAS PubMed .
- P. J. Dittmer, J. G. Miranda, J. A. Gorski and A. E. Palmer, J. Biol. Chem., 2009, 284, 16289–16297 CrossRef CAS PubMed .
- Z. Zhang, X. Cheng, Y. Zhao and Y. Yang, Annu. Rev. Anal. Chem., 2020, 13, 293–314 CrossRef CAS PubMed .
- M. S. Cyert and C. C. Philpott, Genetics, 2013, 193, 677–713 CrossRef CAS PubMed .
- N. Patel and M. G. Gold, Front. Pharmacol., 2015, 6, 164 Search PubMed .
- B. Wang, T. Fu, S. Yang, J. Li and Y. Chen, Anal. Methods, 2013, 5, 3639–3641 RSC .
- X. Cao, W. Lin and Y. Ding, Chem.–Eur. J., 2011, 17, 9066–9069 CrossRef CAS PubMed .
- M. J. Jou, X. Chen, K. M. K. Swamy, H. N. Kim, H.-J. Kim, S.-g. Lee and J. Yoon, Chem. Commun., 2009, 7218–7220, 10.1039/B917832E .
- Y.-K. Yang, H. J. Cho, J. Lee, I. Shin and J. Tae, Org. Lett., 2009, 11, 859–861 CrossRef CAS PubMed .
- M. Amjadi, R. Shokri and T. Hallaj, Spectrochim. Acta, Part A, 2016, 153, 619–624 CrossRef CAS PubMed .
- C. M. Goodman, C. D. McCusker, T. Yilmaz and V. M. Rotello, Bioconjugate Chem., 2004, 15, 897–900 CrossRef CAS PubMed .
- J. Y. Choi, G.-H. Kim, Z. Guo, H. Y. Lee, K. M. K. Swamy, J. Pai, S. Shin, I. Shin and J. Yoon, Biosens. Bioelectron., 2013, 49, 438–441 CrossRef PubMed .
|
| This journal is © The Royal Society of Chemistry 2022 |
Click here to see how this site uses Cookies. View our privacy policy here. 
 Open Access Article
 This Open Access Article is licensed under a Creative Commons Attribution-Non Commercial 3.0 Unported Licence
 *a and
Tariq Omar Siddiqib
*a and
Tariq Omar Siddiqib