 Open Access Article
The incipient denaturation mechanism of DNA
Min Xu,
Tinghui Dai,
Yanwei Wang* and
Guangcan Yang *
*
Department of Physics, Wenzhou University, Wenzhou 325035, China. E-mail: minxu526@foxmail.com; wangyw@wzu.edu.cn; yanggc@wzu.edu.cn; Fax: +86-577-8668-9010; Tel: +86-577-8668-9033
First published on 17th August 2022
Abstract
DNA denaturation is related to many important biological phenomena, such as its replication, transcription and the interaction with some specific proteins for single-stranded DNA. Dimethyl sulfoxide (DMSO) is a common chemical agent for DNA denaturation. In the present study, we investigate quantitatively the effects of different concentrations of DMSO on plasmid and linear DNA denaturation by atomic force microscopy (AFM) and UV spectrophotometry. We found that persistent length of DNA decreases significantly by adding a small amount of DMSO before ensemble DNA denaturation occurs; the persistence length of DNA in 3% DMSO solution decreases to 12 nm from about 50 nm without DMSO in solution. And local DNA denaturation occurs even at very low DMSO concentration (such as 0.1%), which can be directly observed in AFM imaging. Meanwhile, we observed the forming process of DNA contacts between different parts for plasmid DNA with increasing DMSO concentration. We suggest the initial mechanism of DNA denaturation as follows: DNA becomes more flexible due to the partial hydrogen bond braking in the presence of DMSO before local separation of the two complementary nucleotide chains.
1. Introduction
DNA is a long polymer made from mono-nucleotide DNA. It codes genetic information and plays an important role in many biological processes. When the hydrogen bonds between nucleotides are broken, DNA is denatured, resulting in base pair breakage and double-stranded helix separation into two single strands. DNA denaturation is becoming important for nanotechnology as DNA is now used for its self-assembly properties,1,2 to create nanodevices3 or to design molecular memories.4 The denatured structure of DNA exists widely in nature, and denaturation is affected by a series of factors, such as pH,5,6 temperature,6–8 ionic strength,9 ion type,10–12 organic reagent,13–17 binding protein18. However, the detail mechanism of DNA denaturation is still not fully understood, and has interested experimental and theoretical scientists for decades.19Generally, DNA can be denatured by heat, chemical treatment·(such as some organic solvents), or their combinations. Chemical treatment is more convenient for DNA denaturation investigation. Dimethyl sulfoxide (DMSO) is a common chemical agent for DNA denaturation.20 It is a small amphipathic organic molecule with a hydrophilic sulfoxide group and two hydrophobic methyl groups. It is an important polar aprotic solvent that dissolves both polar and nonpolar compounds. Thus, it has been used as a good solvent for a wide range of organic compounds, and is a powerful reagent in chemical and biological studies. For example, it can be used in cryopreservation for preserving intact proteins, phages, and cells in suitable concentration,21–23 and acts as an inducer of cellular differentiation and as a free radical scavenger and radioprotectant.24–26 DMSO can not only denature DNA solely, but also can lower DNA melting temperature by adding a very small amount in solution.27–32 Previous ensemble study shows that at least 10% DMSO in solution is needed to obtain an observable absorption signal change of ultraviolet 260 nm for detecting DNA denaturation at room temperature.15,33 However, recent studies have shown that even the involvement of very low concentrations of DMSO can have a significant impact on different directions of research on proteins and nucleic acids,24,34–36 and low concentrations of DMSO can cause significant conformational changes of nucleic acids, such as the formation of Z-DNA under a specific condition.36 Therefore, to study the effect of DMSO on DNA, especially in the range of low concentration, is quite helpful to understand DNA denaturation mechanism which is far more fully understood. On the other hand, since local DNA denaturation is an obligatory step for the initiation of the transcriptional process and DNA replication, the location and dynamics of denaturation should be strictly regulated in cells. Single-molecule analysis enable researchers to detect phenomena having been obscured by ensemble averaging in the past. Therefore, the study of DNA local denaturation with single molecule technology such as atomic force microscopy (AFM) will provide a direct visual information for understanding the transition process of DNA denaturation and developing biomedical applications based on DNA topology and conformation. Based on the AFM images, we are able to calculate the flexibility of DNA to characterize its mechanical properties quantitively.
In present study, we are trying to investigate quantitatively the effects of low concentrations of DMSO on plasmid and linear DNA denaturation by atomic force microscope (AFM) and UV spectrophotometer to elucidate the mechanism of DNA denaturation at single molecular level. We found that persistent length of DNA decreases with increasing DMSO concentration before DNA denaturation. And DNA denaturation occurs even at very low DMSO concentration (such as 0.1%), which can be directly observed in AFM imaging. When the plasmid DNA hydrogen bond is broken, the conformation change from relaxation to superhelix occurs because of the conservation of the number of connections.37–40
2. Materials and methods
2.1. Materials
DNA (pBR322 plasmid and linear 5000 bp) was purchased from Fermentas (Thermo Fisher Scientific, Inc., Waltham, MA, USA) and its initial concentration was 500 ng μL−1. Calf thymus DNA, dimethyl sulfoxide (DMSO, purity≥ 99.8%) and 3-aminopropyltriethoxysilane (APTES, purity≥ 99%) were purchased from Sigma-Aldrich (Sain Louis, MO, USA) and were used without further purification. Purified water was obtained from a Milli-Q system (Millipore, Billerica, MA, USA).2.2. Sample preparation for AFM imaging
Mica modified with APTES (APTES-treated mica) was used as substrate for the preparation of the samples for AFM imaging in air. The preparation procedure of AFM imaging in air is as follows:41–43 mica was cut into about 1 cm2 square pieces and attached to a glass slide. The freshly cleaved mica surface was modified with APTES by evaporating 4% (v/v) APTES solution in the fume hood for 4 h. Leave the surface in a drying oven for 30 min at 120 °C to further passivate. APTES-treated mica is ready for the sample after that. The DNA samples were diluted to a final concentration of 1 ng·μL−1 by a stock solution containing 1 mM Tris–HCl at pH 7.8 with various DMSO concentrations, incubating at room temperature for about 30 min. A 40 μL aliquot of the DNA solution was deposited onto APTES-treated mica and incubated for 3 min at room temperature. The excessive solution was then removed. Finally, the sample was rinsed with about 200 μL of deionized water and dried with a gentle flow of nitrogen gas. The concentration of DMSO and the molecular ratio between DMSO molecules and nucleotides are listed in Table 1.| Concentration of DMSO (%) | Concentration of DMSO (mol L−1) | Molecular ratio between DMSO molecules and nucleotides |
|---|---|---|
| 0.1 | 0.014 | 4.6 × 10³ |
| 0.2 | 0.028 | 9.1 × 10³ |
| 0.5 | 0.07 | 2.3 × 10⁴ |
| 1 | 0.14 | 4.6 × 10⁴ |
| 3 | 0.42 | 1.4 × 10⁵ |
| 5 | 0.7 | 2.3 × 10⁵ |
| 10 | 1.4 | 4.6 × 10⁵ |
The preparation procedure of AFM imaging in liquid is according to ref. 44. Here is a brief description of the deposition protocol used: 1.0 mM MgCl2, 25 mM KCl, 10 mM HEPES (pH 7.5) solution was used as deposition buffer, 10 mM NiCl2, 25 mM KCl, 10 mM HEPES (pH 7.5) solution was used as imaging buffer, NiCl2 containing buffer only plays a role of increasing the DNA–mica interaction strength. When 1 mM MgCl2, PBS as deposition buffer and 10 mM NiCl2, 25 mM KCl as imaging buffer, because PBS will react with NiCl2, we changed the protocol slightly: before we used imaging buffer, we add the procedure of gently rinsed with 2 mL deposition buffer and 6 mL ultrapure water. Both DNA and DMSO are deposited on mica after sufficient reaction in a centrifuge tube, regardless of whether AFM experiments are performed in air or liquid environment. In air, DNA can be adsorbed on the mica surface in a very short time (30–180 seconds) and the conformation is almost not affected by the subsequent preparation process. Therefore, although the evaporation process and the adsorption on the mica surface may change the local concentration of DMSO, it has no effect on the DNA morphology. In liquid, DNA can be adsorbed on the surface of mica within 2 seconds, and the configuration remains unchanged after adsorption. Longer deposition time only makes the sample adsorbed more firmly, so it will not be affected by the imaging liquid. The prepared samples were scanned using a Nano Wizard III AFM (JPK Instruments AG, Berlin, Germany) operated in AC mode in air. A silicon AFM probe (NCHR-50, NanoWorld Corporation, Neuchâtel, Switzerland) with aluminum coating was used and was driven at resonance frequency of 320 kHz. During imaging, the surface was scanned at a rate of 1.0 Hz.
The AFM images obtained by imaging in air are quantitatively analyzed. The kinks and bubbles of DNA in AFM were regarded as DNA denaturation regions, take the distance between the two farthest points on the 5000 bp DNA and the PBR322 DNA chain as the long axis, and the parallel line of the long axis is translated to both sides and is tangent to the point on the chain, and the distance between the two parallel lines is taken as short axis. Full contour length, local denaturation length, long axis, short axis and end-to-end distance measurements of DNA molecules were performed by the software ImageJ (Wayne Rasband, National Institute of Health, USA), as shown in Fig. 1. Each measured DNA was manually traced through the mapping tool of the software and was traced for at least three times, and the length was automatically measured by the software. The average value of the three times was taken. The kinks caused by DNA denaturation may contain the undenatured parts, the ratio of denaturation going to be bigger than it really is. In addition to the images shown in the paper, we also measured DNA in other images. We analysed approximately 25 imaged DNA for each concentration group.
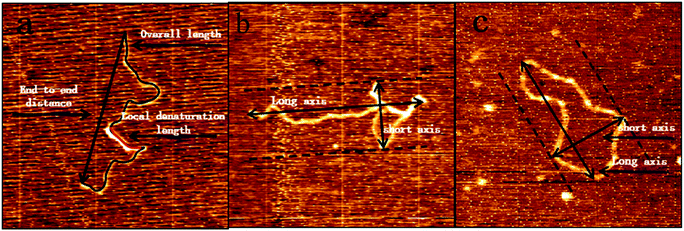 | ||
| Fig. 1 The various dimensions of 5000 bp DNA and pBR322 DNA in AFM images were measured manually by ImageJ. | ||
2.3. Sample preparation for dynamic light scattering (DLS)
The particle size measurements45 were performed by using a DLS device of Malvern Zetasizer Nano ZS90 (Malvern Instruments Ltd, Worcestershire, UK) equipped with the patented M3-PALS technique. PBS buffer solution was used for the assay with different concentrations of DMSO and 1 ng·μL−1 DNA. The solution was detected after incubated at room temperature for 30 minutes, and the sample cell was kept at 25 °C.2.4. Sample preparation for UV spectrophotometry
An appropriate amount of the calf thymus DNA was dissolved in 1 mM PBS buffer and stored at 4 °C as DNA stock solution. PBS buffer was used to prepare different concentrations of DMSO solution, 200 μL of each concentration of solution was added to 2 μL of DNA stock solution. The final DNA concentrations was fixed at 60.7 ng·μL−1. The PBS buffer solution containing different proportion of DMSO without DNA was used as blank control. 2 μL of the prepared solution were loaded onto the pedestal of the Q5000 Ultra-micro ultraviolet spectrophotometer (Quawell, USA) for absorbance measurement at 260 nm. For thermal denaturation experiments, calf thymus DNA was denatured by MK-10 dry bath incubator (ALLSHENG, Hangzhou, China). The final A260 UV absorbance of each group of sample were immediately recorded after they were removed from the incubator.3. Results and discussions
3.1. AFM imaging and DLS experiment
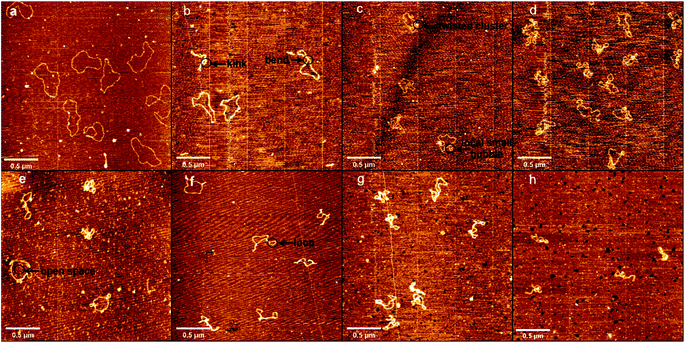
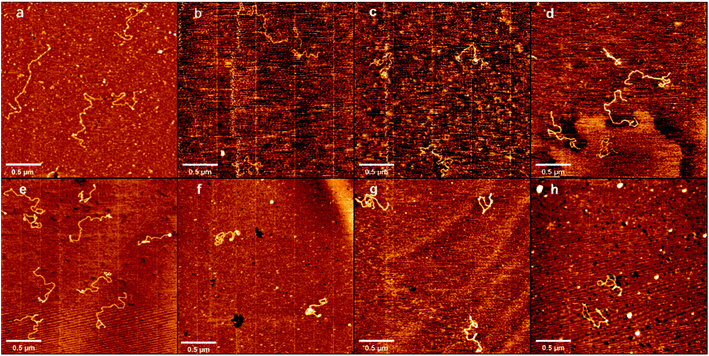
Atomic force microscopy (AFM) has been known to be a powerful tool for determining some subtle change of DNA conformation. We used AFM to investigate the change in morphology of DNA in the presence of different concentrations of DMSO in solution. Two types of DNA were used, one is circular plasmid pBR322 DNA, including 4361 bp, and the other is linear 5000 bp linear DNA. The obtained AFM images of circular plasmid DNA on the mica surface are shown in Fig. 2. For the negative control, we start by imaging DNA alone in the same buffer condition as used in presence of DMSO (Fig. 2a), which shows the typical circular conformation of DNA in the absence of DMSO as expected. From Fig. 2b–h, the corresponding DMSO concentrations in solution increases gradually from 0.1% (v/v) to 10% (v/v). We can see a dose dependent change in the conformation of DNAs. In Fig. 2b, we can see DNAs have more bends compared with those in Fig. 2a, but few or no kinks can be found, and no crossings. In the case, the effect of DMSO on DNA is only to make DNA more flexible, but have no observable change on its tertiary conformation. When the concentration of DMSO is increased slightly to 0.2% and 0.5%, as shown in Fig. 2c and d, some dose dependent local denaturation can be found, including local small bubbles or twisted clusters due to the denatured single stranded DNAs collapse. Because of the local denaturation, some toroidal supercoils are observable, in which DNA chain crossovers, although the concentration of DMSO is still very low. When the concentration of DMSO grows further up to 1%, as shown in Fig. 2e, in addition to the irregular shape of loosely interwound, partially plasmid molecules become more intertwined, but with clear open space visible between the contact points. When 3% DMSO is added into the DNA solution, as shown in Fig. 2f, tight supercoiling was detected as a close contact between DNA segments from duplexes, with regions of close contact separated by loops with different duplex-to-duplex distance. When we increase the concentration of DMSO further to 5% and 10%, as shown in Fig. 2g and h, the degree of plectonemic supercoiling in the plasmid molecule increased until the plasmid molecules most of duplex segments became plectonemic supercoiled structure, with no clear space between contact points.Similar to the length of pBR322 DNA, we imaged 5000 bp linear DNA with increasing concentration of the DMSO and studied its physical properties. The obtained AFM images of linear DNA on the mica surface are shown in Fig. 3 with the increase concentration of DMSO. Fig. 3 shows images of DNA samples incubated with different DMSO concentrations. Fig. 3a shows in the absence of DMSO, we can see the naturally extended DNA on the fresh mica surface. When the concentration of DMSO is 0.1%, 0.2% as shown in Fig. 3b and c, the double strand is more curved, the same as the plasmid DNA. As shown in Fig. 3d and e, we observed loops, crossings and knots of different sizes at 0.5% and 1% DMSO concentration. When the concentration of DMSO is 3% and 5%, as shown in Fig. 3f and g these individual toroidal structures appeared as a series of loops resembling a telephone cord. When the concentration of DMSO is 10%, as shown in Fig. 3h, more compact structure is adopted by DNA molecules. The crossing is the point at which the number of entanglements between DNA strands is less and the intersections between strands can be clearly observed. The knot is a point of convergence where strands of DNA are intertwined to form multiple intersections that cannot be clearly identified.
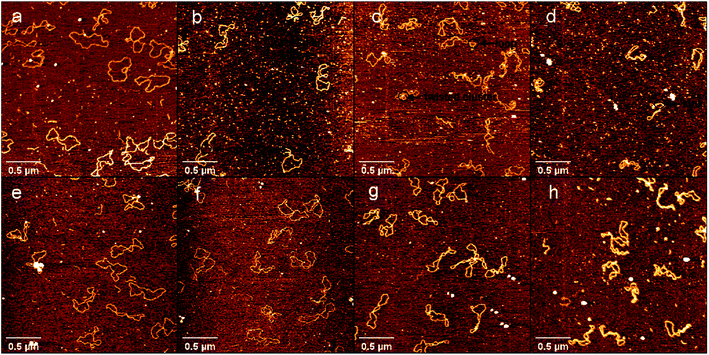
To further explore the interaction between DNA and DMSO in physiologically similar conditions, we used 1 mM PBS buffer and 10 mM HEPES buffer containing 1 mM MgCl2, 25 mM KCl respectively for AFM imaging of DNA in a liquid environment. The results in liquid are shown in Fig. 4 in which Fig. 4a–d used PBS buffer, and Fig. 4e–h used HEPES buffer. DMSO concentrations in the two groups of buffers were 0.1% (a, e), 0.5% (b, f), 5% (c, g) and 10% (d, h). Firstly, we can see that in the same buffer, with the increase of DMSO concentration, the DNA superhelix structure would become more and more obvious. Secondly, by comparing the experimental results of the two buffers, we can see that there is almost no difference in the DNA conformation of the two buffers at the same concentration of DMSO. Finally, by comparing the AFM experiments in liquid and air environments, AFM experiments in liquid is consistent with the trend of DNA conformational change under different DMSO concentration in air. In addition, the liquid environment even improves the resolution of AFM, allowing us to more clearly observe the kink and superhelical structure produced by DNA denaturing.
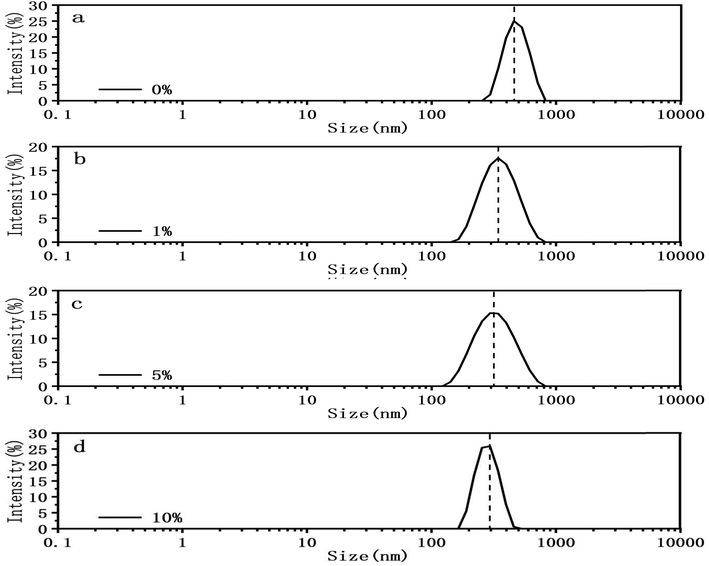
In addition of visual comparison, we tried to quantify how DMSO affect the mechanical properties of both circular and linear DNA chains. Here we used two methods. The first method is DLS. We measured the particle size of pBR322 DNA at different DMSO concentrations (0%, 1%, 5%, 10%) by DLS, being similar to ref. 46. The experimental results are shown in the Fig. 5. In the absence of DMSO, the peak centered at about 490 nm, when 1% DMSO was added, the peak center shifted significantly to the left, and the peak centered at about 360 nm. When the concentration of DMSO increased to 5%, the peak centered at about 337 nm and when the concentration of DMSO increased to 10%, the peak centered at about 284 nm. It can be explicitly seen that the particle size of DNA decreased with the increase of DMSO concentration, because of the ability of DMSO to change the topological structures.47,48
The second method is to analyze the images collected by AFM. At first, we measured the mean dimension of two types of DNA fragments at various DMSO concentrations. Then, we traced the mean end to end distance of linear DNA under the same conditions, which is closely related to the persistence length of DNA molecule. We found out the orientation in which DNA images show the maximal extension as the long axis and measured the dimension as R1, then measured the dimension perpendicular to the long axis as R2. The arithmetic average D = (R1 + R2)/2 is our definition of the mean dimension of a polymer chain. pBR322 DNA and 5000 bp DNA mean dimensions at different DMSO concentrations was obtained after statistical analysis of the obtained data. The relations between the mean dimension and DMSO concentration are shown in Fig. 6. We can see that the DNA mean dimensions decrease with increasing DMSO concentration progressively in both circular and linear chains. For example, the mean dimension of bare pBR322 is about 408 nm, then becomes about 370 nm when adding 0.1% of DMSO in solution, a shrinkage by 9%. When DMSO concentration goes up to 10%, the mean dimension of pBR322 DNA deceases to 220 nm, almost half of the original dimension. For linear DNA, the result is also similar. The DNA mean dimension of 5000 bp DNA gradually goes down from (757 ± 9) nm to (324 ± 5) nm, reduced 57%, when 10% of DMSO is added. Although the variation trend of AFM and DLS was consistent, the results of DLS appear systematically bigger than from AFM. The reasons may include solution effect, absorption on mica surface and the complex shape of DNA.
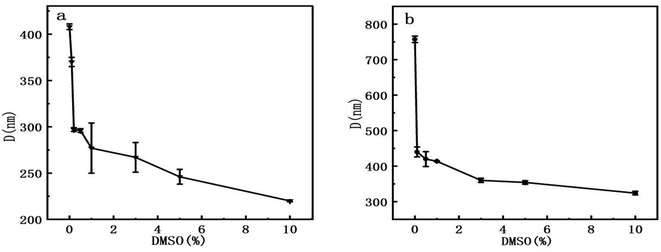 | ||
| Fig. 6 Mean dimension of DNA at different concentrations of DMSO. (a) pBR322 plasmid DNA. (b) 5000 bp linear DNA. | ||
From the statistics for DNA mean dimension and particle size, we can infer that adding DMSO into solution makes DNA more flexible, that is, the persistence of DNA chain decreased. To investigate the influence of DMSO upon the flexibility of DNA quantitatively, we measured the end-to-end distances of linear DNA fragments and calculated their persistence lengths by wormlike chain (WLC) model. The mean square root distances of linear DNA fragments are presented in Table 2. We can see the mean square root distance of DNA decreases monotonically with increasing DMSO concentration. For example, the mean square root end-to-end distance of 5000 bp linear DNA is (683 ± 43) nm in the absence of DMSO in solution, while it decreases drastically to (509 ± 41) nm in the presence of 0.1% DMSO in solution. It means a very low concentration of DMSO has a quite impact to the change of end-to-end distance of DNA, and thus to the persistence of DNA. When the concentration goes up to 5%, the mean square root end-to-end distance deceases to (288 ± 25) nm. The data in Table 2 was calculated by measuring the DNA persistence length of multiple images and averaging it. We analysed 25 DNA images for each concentration group. The end-to-end distance of DNA more than expected in Fig. 3a is probable due to excessive water flow for washing or excessive flow of nitrogen for blow drying during the preparation process.
According to the worm like chain model, we can estimate persistence length from the Mean Square End-to-End distance of DNA, the relation between them is as follows:49
3.2. UV spectrophotometry
Usually, DNA denaturation is monitored by its ultraviolet absorbance collected by a UV-vis spectrophotometer. We used Q5000 Ultra-micro ultraviolet spectrophotometer (Quawell, USA) measuring the change of absorbance at 260 nm caused by denaturation. The denaturation of DNA will lead to the destruction of base pairs, and the double-stranded helix is separated into two single strands, but does not involve the change of the primary structure of DNA. The denaturation of DNA is measured by measuring the UV absorption of DNA solution at 260 nm. The absorbance is related to the number of unpaired DNA base pairs. The more unpaired DNA base pairs, the greater the absorbance. Fig. 7a presents the UV denaturation profile of DNA at various DMSO concentration, the concentration of DMSO varies from 0% to 100%. When the concentration of DMSO is lower than 1%, the absorbance does not have an observable change. We inferred that the kinks caused by DNA denaturation observed by AFM correspond to the weakening of hydrogen bonds between two strands of DNA rather than their complete separation, which is less sensitive in UV absorption. When the concentration of DMSO is greater than 1%, the absorbance gradually increases with increasing concentration of dimethyl sulfoxide. At about 60% concentration of DMSO, the absorbance is saturated and we can conclude that double stranded DNAs become single stranded chains, implying complete denaturation.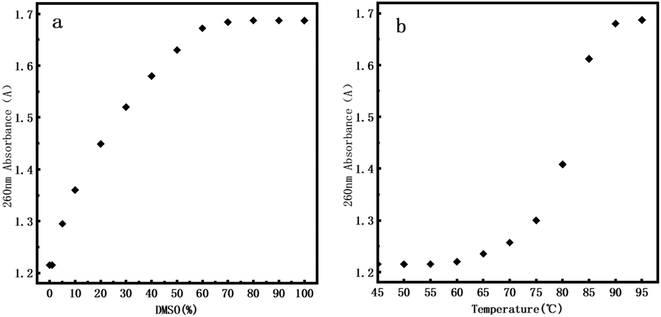 | ||
| Fig. 7 260 nm absorbance of DNA. (a) At 0%, 1%, 5%, 10%, 20%, 30%, 40%, 50%, 60%, 70%, 80%, 90% and 100% of DMSO. (b) At 45 °C, 50 °C, 55 °C, 60 °C, 65 °C, 70 °C, 75 °C, 80 °C, 85 °C, 90 °C, 95 °C. | ||
In addition, in order to efficiently evaluate the effect of DMSO concentration on DNA stability, we performed DNA melting experiment by heating for comparison. Fig. 7b presents the UV denaturation profile of DNA at various temperature. About 10% of total absorption change (comparing to that at 95°) at 70°. This is because in the thermal denaturation of DNA molecules, as the temperature goes up, when the temperature reaches a certain value, the double strand starts to open and then there is a rapid process of unchain, becoming an irregular line ball, and the denaturation temperature range is very narrow. When the temperature rises to about 90 °C, we can see that the DNA is almost completely denatured. By comparing the UV denaturation profile of DMSO, the same DNA denaturation effect can be achieved when DMSO concentration is 60%. It is notable that we focus mainly on DNA denaturation by DMSO and thermal denaturation is only for comparison. Thus our conclusions are mainly valid on chemical denaturation of DNA.
By comparing with the data of atomic force microscope (AFM), we found that even at ultra-low concentration range (0.1–1%), we still observed DNA denaturation locally in the DNA images. We calculated the ratio of local denaturation based on AFM images of pBR322 DNA and linear DNA. We think that the kinks and bubbles of DNA in AFM were closely related to DNA denaturation regions: we first used ImageJ to measure the total contour length and local denatured parts of each DNA at different concentrations of DMSO, and then calculated the ratio of length of the local denatured part to the contour length, finally, calculated the average from the all of data measured, the calculated average rate is regarded as the denaturation rate. The statistical results are shown in Table 3. For example, 1.4% of plasmid DNA is denatured even in 0.1% DMSO solution while it becomes 2.3% for linear DNA. This interesting finding might be elucidated by the supercoiling of circular DNA since it has to overcome the extra energy barrier to form DNA supercoils while the supercoiling is released for linear DNA. Therefore, denaturing circular DNA is slightly harder than linear one. Since UV-vis spectroscopy is an ensemble method, is not sensitive enough to detect a small amount of local denaturation of DNA molecules. This also reflects the advantages of single molecular techniques such as atomic force microscopy.
| Concentration of DMSO (%) | Denaturation of pBR322 DNA (%) | Denaturation of 5000 bp DNA (%) |
|---|---|---|
| 0.1 | 1.4 | 2.3 |
| 0.2 | 3.1 | 5.6 |
| 0.5 | 4.4 | 9.2 |
| 1 | 8.2 | 10.5 |
The double helix structure of DNA is mainly attributed to the interaction of hydrogen bonds between the complementary nucleotide units of DNA and the base stacking force. The denaturation ability of DMSO can be firstly attributed to the strong hydrogen bond acceptability of sulfoxide functional groups and hydrophobic properties of methyl groups: DMSO and amine group of Guanine base interaction through the hydrogen bonding between oxygen moiety of DMSO and a hydrogen atom of NH2 to destabilize DNA base pairing. Another effect of DMSO is its modification on solvation environment of DNA. The insertion of the non-polar methyl groups of DMSO into the nonpolar space of the water, the structure of the whole aqueous solution is changed, resulting in hydrophobic interaction and also affects the base stacking force.30,50 Even at a very low concentration of DMSO, the presence of a strong interaction between the DMSO and the minor and major grooves of the DNA bases causes a distortion of the hydrogen bonds between the DNA bases, thus destabilizing the DNA double helix.51 Therefore, some hydrogen bonds in DNA chains and the base stacking force are weakened or broken by the agent although the total double helix conformation of DNA is still intact. The consequent result is that DNA becomes more flexible, in the other words, DMSO lowers the persistence of DNA before causing the local denaturation of DNA. With the increase of DMSO concentration, denatured regions gradually increased, leading to an apparently more interwound DNA configuration were observed in AFM images, as shown in Fig. 1.
By comparing with the data of atomic force microscope (AFM), we found that the UV spectrophotometer did not detect the denaturation behavior of DNA in the ultra-low concentration range (0.1–1%). It may be that the UV spectrophotometer is not sensitive when denaturation occurs in only a few areas of the DNA molecule. This also reflects the advantages of atomic force microscope compared with ultraviolet spectrophotometer in observing the denaturation of DNA.
4. Conclusions
In summary, we can conclude some points for the interaction between DMSO and DNA as follows:(1) DMSO induces a dose dependently structural changes of DNA as expected.
(2) AFM examination shows that DMSO induces both linear and plasmid DNA denaturation even at very low concentrations (0.1%), far below the concentration at which traditional ultraviolet spectrophotometry is capable to detect the alternation. The AFM images also shows the contacts formed between different parts of DNA supercoil because of the local denaturation of plasmid DNA by DMSO.
(3) We found that DMSO also significantly decreases persistence length of DNA. Specifically, the persistence length of DNA in 3% DMSO solution decreases to 12 nm from about 50 nm without DMSO in solution.
(4) For the initial mechanism of DNA denaturation, we can infer that DNA becomes more flexible and has the unique morphological and structural changes due to the partial hydrogen bond broken in the presence of DMSO even at very low concentration.
Author contributions
G. Y. conceived and designed the project; M. X., T. D. and Y. W. performed the experiment; Y. W., T. D. and M. X. analyzed the data; G. Y., Y. W., and M. X. wrote the paper.Conflicts of interest
The authors declare no conflict of interest.Acknowledgements
This work is supported by the National Natural Science Foundation of China (Grant No. 12074289 and 11574232).References
- C. J. Benham, Sites of predicted stress-induced DNA duplex destabilization occur preferentially at regulatory loci, Proc. Natl. Acad. Sci. U. S. A., 1993, 90, 2999–3003 CrossRef CAS PubMed.
- R. P. Goodman, I. A. Schaap, C. F. Tardin, C. M. Erben, R. M. Berry, C. F. Schmidt and A. J. J. S. Turberfield, Rapid chiral assembly of rigid DNA building blocks for molecular nanofabrication, Science, 2005, 310, 1661–1665 CrossRef CAS PubMed.
- K. Komiya, M. Yamamura and J. A. Rose, Quantitative design and experimental validation for a single-molecule DNA nanodevice transformable among three structural states, Nucleic Acids Res., 2010, 38, 4539–4546 CrossRef CAS PubMed.
- M. Takinoue and A. Suyama, Molecular reactions for a molecular memory based on hairpin DNA, Chem. Bio Inf. J., 2004, 4, 93–100 CAS.
- A. Tempestini, V. Cassina, D. Brogioli, R. Ziano, S. Erba, R. Giovannoni, M. G. Cerrito, D. Salerno and F. Mantegazza, Magnetic tweezers measurements of the nanomechanical stability of DNA against denaturation at various conditions of pH and ionic strength, Nucleic Acids Res., 2013, 41, 2009–2019 CrossRef CAS PubMed.
- W. Strider, M. Camien and R. Warner, Renaturation of denatured, covalently closed circular DNA, J. Biol. Chem., 1981, 256, 7820–7829 CrossRef CAS PubMed.
- M. S. Hung, O. Kurosawa and M. Washizu, Single DNA molecule denaturation using laser-induced heating, Mol. Cell. Probes, 2012, 26, 107–112 CrossRef CAS PubMed.
- L. Yan and H. Iwasaki, Thermal Denaturation of Plasmid DNA Observed by Atomic Force Microscopy, Jpn. J. Appl. Phys., 2002, 41, 7556–7559 CrossRef CAS.
- J. Adamcik, J.-H. Jeon, K. J. Karczewski, R. Metzler and G. Dietler, Quantifying supercoiling-induced denaturation bubbles in DNA, Soft Matter, 2012, 8, 8651–8658 RSC.
- B. Hammouda and D. Worcester, The denaturation transition of DNA in mixed solvents, Biophys. J., 2006, 91, 2237–2242 CrossRef CAS PubMed.
- S. U. Rehman, T. Sarwar, M. A. Husain, H. M. Ishqi and M. Tabish, Studying non-covalent drug-DNA interactions, Arch. Biochem. Biophys., 2015, 576, 49–60 CrossRef PubMed.
- S. Maity, S. Singh and A. Kumar, Unsteady three dimensional flow of Casson liquid film over a porous stretching sheet in the presence of uniform transverse magnetic field and suction/injection, J. Magn. Magn. Mater., 2016, 419, 292–300 CrossRef CAS.
- S. I. Nakano and N. Sugimoto, The structural stability and catalytic activity of DNA and RNA oligonucleotides in the presence of organic solvents, Biophys. Rev., 2016, 8, 11–23 CrossRef CAS PubMed.
- B. Hammouda, Insight into the denaturation transition of DNA, Int. J. Biol. Macromol., 2009, 45, 532–534 CrossRef CAS PubMed.
- X. Wang and A. Son, Effects of pretreatment on the denaturation and fragmentation of genomic DNA for DNA hybridization, Environ. Sci.: Process. Impacts, 2013, 15, 2204–2212 CAS.
- X. Wang, H. J. Lim and A. Son, Characterization of denaturation and renaturation of DNA for DNA hybridization, Environ. Health Toxicol., 2014, 29, 11–18 CAS.
- Y. Ito, K. Tsukagoshi and A. Kobayashi, Denaturation of DNA in Ternary Mixed Solution of Water/Hydrophilic/Hydrophobic Organic Solvent, J. Anal. Sci. Methods Instrum., 2017, 07, 40–46 CAS.
- V. Vukojevic, T. Yakovleva, L. Terenius, A. Pramanik and G. Bakalkin, Denaturation of dsDNA by p53: fluorescence correlation spectroscopy study, Biochem. Biophys. Res. Commun., 2004, 316, 1150–1155 CrossRef CAS PubMed.
- R. Thomas, The denaturation of DNA, Gene, 1993, 135, 77–79 CrossRef CAS PubMed.
- Z. W. Yu and P. J. Quinn, Dimethyl sulphoxide: a review of its applications in cell biology, Biosci. Rep., 1994, 14, 259–281 CrossRef CAS PubMed.
- P. Westh, Thermal expansivity, molar volume, and heat capacity of liquid dimethyl sulfoxide-water mixtures at subzero temperatures, J. Phys. Chem., 1994, 98, 3222–3225 CrossRef CAS.
- L. E. McGann and M. L. Walterson, Cryoprotection by dimethyl sulfoxide and dimethyl sulfone, Cryobiology, 1987, 24, 11–16 CrossRef CAS PubMed.
- B. Sydykov, H. Oldenhof, H. Sieme and W. F. Wolkers, Storage stability of liposomes stored at elevated subzero temperatures in DMSO/sucrose mixtures, PLoS One, 2018, 13, 19–28 CrossRef PubMed.
- G. Kashino, Y. Liu, M. Suzuki, S.-i. Masunaga, Y. Kinashi, K. Ono, K. Tano and M. Watanabe, An alternative mechanism for radioprotection by dimethyl sulfoxide; possible facilitation of DNA double-strand break repair, J. Radiat. Res., 2010, 51, 733–740 CrossRef PubMed.
- S. W. Jacob and C. Jack, Dimethyl sulfoxide (DMSO) in trauma and disease, CRC press, 2015 Search PubMed.
- J. R. Milligan and J. F. Ward, Yield of single-strand breaks due to attack on DNA by scavenger-derived radicals, Radiat. Res., 1994, 137, 295–299 CrossRef CAS PubMed.
- J. R. Hutton and J. G. Wetmur, Activity of endonuclease S1 in denaturing solvents: dimethysulfoxide, dimethylformamide, formamide and formaldehyde, Biochem. Biophys. Res. Commun., 1975, 66, 942–948 CrossRef CAS PubMed.
- J. F. Escara and J. R. Hutton, Thermal stability and renaturation of DNA in dimethyl sulfoxide solutions: acceleration of the renaturation rate, Biopolymers, 1980, 19, 1315–1327 CrossRef CAS PubMed.
- G. Bonner and A. M. Klibanov, Structural stability of DNA in nonaqueous solvents, Biotechnol. Bioeng., 2000, 68, 339–344 CrossRef CAS PubMed.
- S. A. Markarian, A. M. Asatryan, K. R. Grigoryan and H. R. Sargsyan, Effect of diethylsulfoxide on the thermal denaturation of DNA, Biopolymers, 2006, 82, 1–5 CrossRef CAS PubMed.
- A. Giugliarelli, M. Paolantoni, A. Morresi and P. Sassi, Denaturation and preservation of globular proteins: the role of DMSO, J. Phys. Chem. B, 2012, 116, 13361–13367 CrossRef CAS PubMed.
- I. K. Voets, W. A. Cruz, C. Moitzi, P. Lindner, E. P. Arêas and P. Schurtenberger, DMSO-induced denaturation of hen egg white lysozyme, J. Phys. Chem. B, 2010, 114, 11875–11883 CrossRef CAS PubMed.
- X. Wang, H. J. Lim and A. Son, Characterization of denaturation and renaturation of DNA for DNA hybridization, Environ. Health Toxicol., 2014, 29, 53–62 Search PubMed.
- M. Noda, Y. Ma, Y. Yoshikawa, T. Imanaka, T. Mori, M. Furuta, T. Tsuruyama and K. Yoshikawa, A single-molecule assessment of the protective effect of DMSO against DNA double-strand breaks induced by photo-and γ-ray-irradiation, and freezing, Sci. Rep., 2017, 7, 1–8 CrossRef CAS PubMed.
- Z. Jia, H. Zhu, Y. Li and H. P. Misra, Potent inhibition of peroxynitrite-induced DNA strand breakage and hydroxyl radical formation by dimethyl sulfoxide at very low concentrations, Exp. Biol. Med., 2010, 235, 614–622 CrossRef CAS PubMed.
- S. Tunçer, R. Gurbanov, I. Sheraj, E. Solel, O. Esenturk and S. Banerjee, Low dose dimethyl sulfoxide driven gross molecular changes have the potential to interfere with various cellular processes, Sci. Rep., 2018, 8, 1–15 Search PubMed.
- J. M. Fogg, N. Kolmakova, I. Rees, S. Magonov, H. Hansma, J. J. Perona and E. L. Zechiedrich, Exploring writhe in supercoiled minicircle DNA, J. Phys.: Condens. Matter, 2006, 18, 145 CrossRef PubMed.
- M. Barbi, S. Lepri, M. Peyrard and N. Theodorakopoulos, Thermal denaturation of a helicoidal DNA model, Phys. Rev. E, 2003, 68, 1906–1909 CrossRef PubMed.
- A. Kabakçıoğlu, A. Bar and D. Mukamel, Macroscopic loop formation in circular DNA denaturation, Phys. Rev. E, 2012, 85, 1905–1919 CrossRef PubMed.
- M. Sayar, B. Avşaroğlu and A. Kabakçıoğlu, Twist-writhe partitioning in a coarse-grained DNA minicircle model, Phys. Rev. E, 2010, 81, 1904–1916 CrossRef PubMed.
- Y.-F. Liu and S.-Y. Ran, Divalent metal ions and intermolecular interactions facilitate DNA network formation, Colloids Surf. B Biointerfaces, 2020, 194, 1111–1117 Search PubMed.
- S. Qiu, Y. Wang, B. Cao, Z. Guo, Y. Chen and G. Yang, The suppression and promotion of DNA charge inversion by mixing counterions, Soft Matter, 2015, 11, 4099–4105 RSC.
- T. Gao, W. Zhang, Y. Wang and G. Yang, DNA compaction and charge neutralization regulated by divalent ions in very low pH solution, Polymers, 2019, 11, 337 CrossRef PubMed.
- P. R. Heenan and T. T. Perkins, Imaging DNA equilibrated onto mica in liquid using biochemically relevant deposition conditions, ACS Nano, 2019, 13, 4220–4229 CrossRef CAS PubMed.
- F. Ma, Y. Wang and G. Yang, The modulation of chitosan-DNA interaction by concentration and pH in solution, Polymers, 2019, 11, 646 CrossRef PubMed.
- J. Langowski, A. S. Benight, B. S. Fujimoto and J. M. J. B. Schurr, Change of conformation and internal dynamics of supercoiled DNA upon binding of Escherichia coli single-strand binding protein, Biochemistry, 1985, 24, 4022–4028 CrossRef CAS PubMed.
- J.-K. Juang and H.-J. Liu, The effect of DMSO on natural DNA conformation in enhancing transcription, Biochem. Biophys. Res. Commun., 1987, 146, 1458–1464 CrossRef CAS PubMed.
- B. Lv, Y. Dai, J. Liu, Q. Zhuge and D. Li, The effect of dimethyl sulfoxide on supercoiled DNA relaxation catalyzed by type I topoisomerases, BioMed Res. Int., 2015, 2015, 1–8 Search PubMed.
- C. Rivetti, M. Guthold and C. Bustamante, Scanning force microscopy of DNA deposited onto mica: equilibration versus kinetic trapping studied by statistical polymer chain analysis, J. Mol. Biol., 1996, 264, 919–932 CrossRef CAS PubMed.
- M. G. Aznauryan and S. A. Markarian, Properties of DNA+ dipropylsulfoxide or dibutylsulfoxide+ water ternary solutions, J. Solution Chem., 2010, 39, 43–50 CrossRef CAS.
- K. Y. Amirbekyan, A. Antonyan, P. Vardevanyan and S. A. Markarian, Molecular interactions between benzimide trichloride (Hoechst 33258) and DNA in dimJ. Solut. Chem.ethyl sulfoxide aqueous solutions, according to spectroscopy data, Russ. J. Phys. Chem. A, 2013, 87, 2027–2029 CrossRef CAS.
| This journal is © The Royal Society of Chemistry 2022 |

