 Open Access Article
Performance enhancement of a thermal energy storage system using shape-stabilized LDPE/hexadecane/SEBS composite PCMs by copper oxide addition
Abdelwaheb Trigui *a,
Makki Abdelmoulehb and
Chokri Boudayaa
aLaboratoire des Matériaux Multifonctionnels et Applications (LMMA), Université de Sfax, Tunisia. E-mail: abdotrg@yahoo.fr
bLaboratoire Sciences des Matériaux et Environnement (LMSE), Université de Sfax, Tunisia
First published on 9th August 2022
Abstract
Thermal Energy Storage (TES) technologies based on Phase Change Materials (PCMs) with small temperature differences have effectively promoted the development of clean and renewable energy. The organic phase change materials are most commonly used in latent heat TES (LHTES). Nevertheless, the trend of this type of material limits their applications because of their low thermal conductivities and liquid leakage over the phase transition process. Copper oxide (CuO) microparticles served as an additive to enhance thermal performance and a series of shape-stabilized composite PCMs (SSPCMs) were prepared by physical impregnation. The composites were characterized for their micro-morphology, chemical structure, thermal degradation stability and thermal energy storage performance with the aid of SEM, FT-IR, ATG, infrared thermography (IRT) and DSC, respectively. To obtain the maximally efficient energy storage capacity, the mass fraction of Hex (PCM) was found to be 75%, with a good form stability, which surmounts almost all mass fraction values reported in the literature. The ATG curves of all PCM composites revealed that addition of CuO has increased the onset degradation temperature and the maximum weight loss temperature. During the heating and cooling processes, leakage and impairment of the composite PCM were not detected. Significant enhancement in melting time and larger heat storage capacity were observed when 15% CuO was added to the SSPCM as revealed by IRT. The DSC results of the SSPCM composite indicated that the presence of CuO microparticles in PCM composites reduces the supercooling effect during the phase change process and increases the energy storage/release capacity with suitable phase change temperatures for building TES applications.
1 Introduction
Phase Change Materials (PCMs) for thermal energy storage (TES) is an emerging field of research that received considerable attention due to its potential impact on every domain of science and technology. It benefits various fields of study in research and application such as solar energy, smart textiles, heat transfer media and intelligent buildings.1–4 LHTES is the most promising method in this field due to the excellent phase change behavior5–7 and high heat storage capacity.8,9 Up to now, phase change materials (PCMs) for the LHTES have been widely investigated in building energy storage, such as building insulation walls,10 phase change cement boards,11 solar space cooling and heating applications in buildings.12 Among all types of PCMs organic PCMs have desirable characteristics including a suitable melting temperature, negligible supercooling through phase change, outstanding phase transition performance, and non-toxicity. However, the direct employment of these organic PCMs for heat storage has several limitations because of the flammability and instability, low thermal conductivity which leads to low charging and discharging rates and problems with leakage through the solid–liquid phase transition.13–15 The majority of PCMs are so-called solid–liquid phase change materials. For practical applications, the leakage of the PCMs at their liquid phase must be prevented.15,16 The most cost-efficient way to do this is to disperse the PCM in a matrix material. These kinds of composites are called shape stabilized phase change materials (SSPCMs). In recent years, there has been considerable interest in shape-stable composite PCMs;17 the most beneficial objective for SSPCM would be to not only make PCMs easier and safer to use but also to decrease the reactivity of PCMs, enhance their thermal properties by increasing their heat transfer area and improve their application effect and application scope.18 By melting and mixing polymer and organic PCMs (such as paraffin) together, the polymer can form a three-dimensional network structure to envelop the paraffin. The melting point of the polymer is always higher than that of the organic phase change materials PCMs. Thus, when PCMs change from solid to liquid, the supporting matrix remains solid and the PCMs will not leak, although there may be seepage with time, from the polymer network structure.19–23 The composite material, therefore, can be used as laminated SSPCM wallboards with no need to incorporate them into building materials. A range of polymers can be used as the structural supporting component/matrix, including high-(HDPE), low-(LDPE) and linear low-density LLDPE) poly(ethylene), styrene-butadiene-styrene (SBS) tri-block copolymer and poly(propylene) (PP). Although, the poly(ethylene) polymer family has been most widely studied for SSPCM application with paraffin waxes, due to their similar chemical structures.8,24–26 For the paraffin with a least number of carbon atoms used (i.e. hexadecane), they display a thermal hysteresis between melting and solidification temperatures of about 11.6 °C.27,28 The absolute value of hysteresis strongly depends on the experimental conditions. Moreover, the rate of cooling also plays a role on supercooling effects.29,30 Supercooling takes place during the liquid-to-solid phase transition and leads to a delay in the crystallization onset that is the material remains liquid even at temperatures smaller than the freezing temperature. Short experimental times would result in an increase in the degree of supercooling, defined as the temperature difference between the melting and crystallizing temperatures, as shown by Safari et al.29 where the increase in cooling rate leads to an increase in the degree of supercooling. A typical but most significant drawback which affects the thermal performance of LHTES systems, is the low thermal conductivity of most PCMs. In fact, the thermal conductivity of most inorganic PCMs are less than 1.0 W (m−1 K−1), whilst organic PCMs have even lesser thermal conductivity values of 0.2 W (m−1 K−1).11,31 Such low thermal conductivity of PCMs could lead to low heat transfer rate, resulting in slow heat exchange performance during melting and solidification processes. Furthermore, in a LHTES system, the major cost is associated with the heat transfer technology that employs to achieve a large amount of heat charge/discharge rates to achieve high efficiency.32,33 Therefore, enhancing the thermal performance of PCM is a key requirement in terms of efficient and economic perspective. There are many different methods that can be adopted to improve the heat transfer performance of PCM and out of those, using extended surfaces, dispersing high conductive additives and fabrication of micro-sized PCM composites are some of the commonly used approaches.34,35 Among these different technologies, increasing the heat transfer surface area or adopting extended surfaces in a TES system is the most straightforward approach. However, this method suffers from reduced PCM content due to large volume contribution of extended surfaces such as metal fins.27,36 Another most versatile approach in heat transfer enhancement is to disperse high conductive additives in the PCMs, both in -micro and-nano sized particles. The dispersion of high thermal conductive additives into PCMs improves the effective thermal conductivity and increases the heat transfer performance. A wide variety of high conductive additives including, copper,37,38 nickel,39 silver,40,41 Al2O3,42 and TiO2,43,44 carbon-based materials (CNTs),45,46 graphene,47 graphite,48,49 GO/rGO,50,51 CFs,52,53 EG,28,54 and graphene aerogels (GAs),55,56 and ceramic-based materials (boron nitride (BN)57,58 and aluminum nitride (AlN).59,60 The other method is to embed metal foams or graphite matrix in PCMs.61,62Yet, a TES system also requires large amounts of latent heat of fusion and the addition of high conductive additives will reduce the latent heat of fusion, because the promoter is not engaged in phase change operation. Therefore, there is a need for compromising between the thermal conductivity and latent heat.63,64 Metallic particles including, copper, nickel and aluminum were widely studied for thermal conductivity enhancement of PCMs due to their high thermal conductivity. Wang et al.65 introduced copper fibers into paraffin to increase heat transfer performance of PCM and reported that the effective thermal conductivity of PCM composite was increased by 27–134 times without large reduction in latent heat capacity. On the other hand, copper nanoparticles with the average particle size of 20 nm were dispersed into paraffin wax to synthesis Cu-PCM nanocomposites.35 It was found that the addition of up to 2.0 wt% of Cu increased the thermal conductivity of paraffin by 4.3%. Furthermore, nano-Cu also acted as nucleation agent to reduce the supercooling effect during the phase change process. Xiao et al.66 also prepared composite PCMs using copper and nickel forms with 95% porosity. The results showed that the effective thermal conductivity increased from 0.305 to 4.9 W (m−1 K−1) and 1.3 W (m−1 K−1) for paraffin/copper and paraffin/nickel composite PCMs respectively. However, the latent heat capacity and specific heat capacity were reduced by 22–30% and 14–24% respectively. Nourani et al.67 developed a new kind of composite PCM by dispersing aluminum oxide (Al2O3) nanoparticles into paraffin with the presence of sodium stearoyl lactylate (SSL) as a dispersing agent/surfactant. The thermal conductivity and melting heat transfer rate enhancement were reported as 31% and 27% respectively. Thermal reliability studies revealed that the PCM composite had good thermal reliability after subjected to 120 thermal cycles.
Harikrishnan et al.68 added CuO to PCM materials, obtaining results showing that the more CuO added to oleic acid, the more its thermal conductivity is increased. Karunamurthy et al.69 added CuO nanoparticles to paraffin (N-docosane) in various concentrations, resulting in increased thermal conductivity of the paraffin. Wu et al.70 also added Cu nanoparticles to accelerate thermal conductivity of paraffin. PCM material has a stable thermal cycle – during repeated heating and cooling up to 100 cycles. Nandy et al.71 analyzed beeswax/CuO with various mass fractions of nanoparticles to study the thermal properties of nano-PCM for low temperature application. Adding nanoparticles increased the thermal conductivity of the nano-PCM but reduced its latent heat and heat capacity.
This paper aims to provide in-depth understanding of the smart utilization of CuO microparticles indicated as suitable dopant for improving thermal properties in PCMs which will address the TES challenges by a facile and low-cost strategy. The integration of copper oxide additives into form-stable PCMs is considered an effective method to improve the heat storage/release performance. Furthermore, various characterization techniques were adopted to analyze the surface morphology, chemical and physical interaction, thermal properties including phase-change temperature, melting/solidifying, latent-heat enthalpies, specific heat capacity and thermal stability. Based on the obtained results, the composites open very wide horizons in the thermal energy storage and thermal management applications.
2 Experiments
2.1 Materials
Hexadecane (C14H34, Sigma Aldrich with 99% purity) a saturated hydrocarbon of the alkanes family with a phase change temperature of 18–20 °C was used as the PCMs thanks to its high latent heat (over 224 kJ kg−1). Elastomer SEBS (Kraton G1650 M, linear tri-block copolymer based on styrene and ethylene/butylene) and the LDPE were selected as the supporting materials for their good compatibility with the hexadecane. The selected micro particle for this analysis is copper oxide (CuO) (99.9% pure; particle size <120 μm). Toluene (C7H8, analytical reagent, Sigma Aldrich) served as solvent.2.2 Preparation
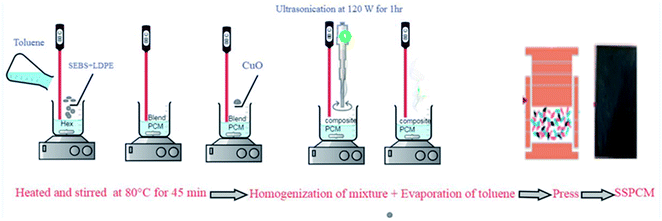
Several series of SEBS/Hex/LDPE blend in the absence and in the presence of CuO (Table 1) were prepared according to the experimental protocol of the Fig. 1. (i) The SEBS and the LDPE were mixed in the liquid PCM at 80 °C in toluene for 45 min at a speed of about 800 rpm to yield a homogeneous solution. (ii) The SEBS/Hex/LDPE/CuO composite with different CuO loads were prepared by adding the oxide copper microparticles at 80 °C for 30 min to the SEBS/Hex/LDPE blend-toluene solution. The mixture was then homogenized using sonication treatment (1 hour at 120 W) to dispersed CuO aggregates. The mixture was left under a hood at 120 °C to evaporate the toluene. The composite was obtained after the total evaporation of the solvent in a Teflon mold. (iii) Ultimately, the mixture was placed in a mold with the size of 45 mm in diameter for hot-pressing. This technique produced parallelepiped-shaped composites with different mass fraction of CuO.| SSPCMS | SEBS | Hex | LDPE | CuO | |
|---|---|---|---|---|---|
| SSPCM1 | S0 | 0 | 75 | 25 | 0 |
| T0 | 0 | 75 | 20 | 5 | |
| SSPCM2 | S1 | 25 | 75 | 0 | 0 |
| T1 | 20 | 75 | 0 | 5 | |
| SSPCM3 | S2 | 20 | 75 | 5 | 0 |
| T21 | 15 | 75 | 5 | 5 | |
| T22 | 10 | 75 | 5 | 10 | |
| T23 | 5 | 75 | 5 | 15 | |
2.3 Characterization
 | (1) |
Thermal properties, such as melting temperature and latent heat capacity of the SSPCMs, were determined using differential scanning calorimetry (DSC Q1000). DSC measurements were executed at a 10 °C min−1 heating and rate and temperature ranges of [(−80 °C)–(160 °C)] and [(160 °C)–(−80 °C)], respectively. The typical result of a DSC measurement is the DSC thermogram (heat flow curve), which directly displays information about the onset melting temperature (Tom), melting peak temperature (Tpm), endset melting temperature (Tem) latent heat of fusion or melting enthalpy (ΔHm). The melting temperature was measured by drawing a line at the start point of maximum slope of the leading edge of the peak, and concluding at the baseline. The latent heat of SSPCMs was calculated by numerical integration of the area under the peaks that represent the solid–solid and solid–liquid phase transitions. The specific heat capacity of PCM and SSPCMs was determined using the enthalpy-sum curve -also known as the (enthalpy-temperature) curve-as the slope of the sensible heat part before the phase transition region for the solid phase and after the phase transition region for the liquid phase.
Thermogravimetric analysis measurements of the SSPCMs were performed using thermo gravimetric analysis (TGA Q5000) on approximately 2–4 mg samples, over the temperature range 25–600 °C, at a heating rate of 10 °C min−1, under a nitrogen flow of 20 ml min−1.
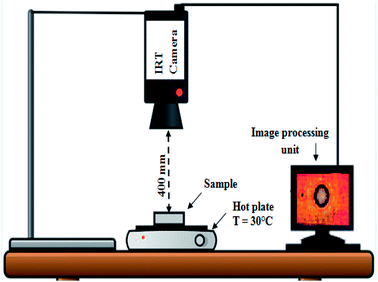
Infrared thermography (IRT) tests were performed to evaluate the temperature distribution of the surface of samples with and without CuO. Fig. 2 shows the IRT test setup, including thermal camera (FLIR) and hot plate used for this study. The IRT test was done by preheating the hotplate at 30 °C. The thermal radiation emitted from the surfaces and temperature at the center of samples were then captured at 60 s intervals during 38 min.
3 Results and discussion
3.1 Morphologies of SSPCMs
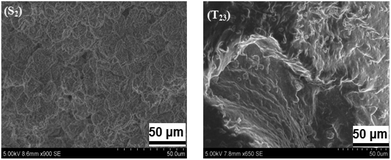
Surface morphology of shape-stabilized composite SSPCM3 (S2 and T23) is shown in Fig. 3. The PCM content of the SSPCMs was as high as 75%. From these images, it can be observed that the paraffin is dispersed into the network of solid LDPE/SEBS used as the supporting material.72–75 Therefore, the composite material maintains its shape in the solid state without seepage of the melted paraffin. In the photographs, the black and white parts represent the paraffin and LDPE compounds in the composite PCMs. The polystyrene (PS) and ethylene/butylene (EB) elastomer blocks of the SEBS are respectively miscible with LDPE and Hex.72 The PS block and the EB block are thermodynamically incompatible, which exhibit a microscopic phase separation resulting in a two-phase structure. Therefore, the change of the morphology of SEBS is caused by the dispersion of paraffin into the network of SEBS. Besides, the surface with higher Hex ratio is related to the process of our preparation processes, which involves melting the phase change material onto the filler while using mixing techniques like sonication, ultra-sonication, and magnetic/mechanical stirring. Hence, the absorption of SEBS and the sealing of LDPE could provide a mechanical structure to prevent paraffin from leakage when paraffin is melted. The incorporation of CuO into the SSPCMs blends resulted in a finer degree of dispersion of the microparticles and morphological evidence of interfacial adhesion.The SEM photograph of the SSPCMs (T23) indicated that CuO additives were more uniformly dispersed in the composite,76,77 and no new products are formed. This kind of microstructure of SEBS/hexadecane/LDPE/CuO composite is testified valid to solve the leakage problem by leakage test.
3.2 Chemical compatibility of SSPCMs
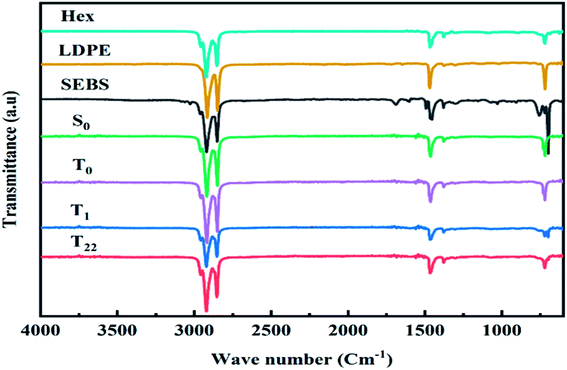
The FT-IR spectra from 400 to 4000 cm−1 of SSPCM1 (a), SSPCM2 (b) and SSPCM1 (c) are exhibited in Fig. 4. In the spectrum of the LDPE, four main peaks at 2933 cm−1, 2850 cm−1, 1457 cm−1 and 717 cm−1 are appeared,78 which are assigned to –CH2 symmetric stretching, –CH3 symmetric stretching, –CH2 deformation vibration and –CH2 rocking vibration respectively.In the pure n-hexadecane spectra, the peaks at 2956 and 2916, and 2848 cm−1 represent the symmetrical stretching vibration of –CH3 and –CH2 group, respectively. The peaks at 1471, 1461, 1377 cm−1 belong to the deformation vibration of –CH2 and –CH3 groups. The peak at 729 cm−1 represents the rocking vibration of –CH2 group. For pure SEBS, the wave number region of 1601–1452 cm−1 is assigned to the skeleton vibration of benzene rings. The peaks at 757 cm−1 and 698 cm−1 can be attributed to the mono substituted benzene rings. The peak at 1378 cm−1 corresponds to the C–H bending vibration of the EB segments.79–81 As appeared in the spectrum of SSPCMs, some specific absorption areas in the range of approximately 2800–3000 cm−1 for C–H stretching vibration, and 1350–1500 cm−1 for CH2 deformation similar to any previous report.9 As appeared in the spectrum of SSPCM1 (S0 and T0) and SSPCM2 (T1), specific absorption areas in the range of approximately 2800–3000 cm−1 for C–H stretching vibration, and 1350–1500 cm−1 for CH2 deformation similar to the bass compounds previously described. The FT-IR spectrum graph indicated that there was no chemical reaction from the mixing of these materials. There was only a physical interaction between the components demonstrating that SSPCMs forming an immiscible blend.28 The same spectroscopic observations were found on the SSPCM3 (T22) composites in the presence of CuO confirming that the dispersion of CuO throughout the PCM was uniform and without any chemical reaction.
3.3 Thermal stability analysis of SSPCMs
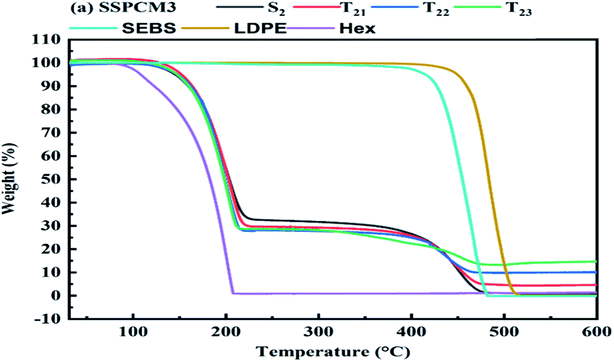
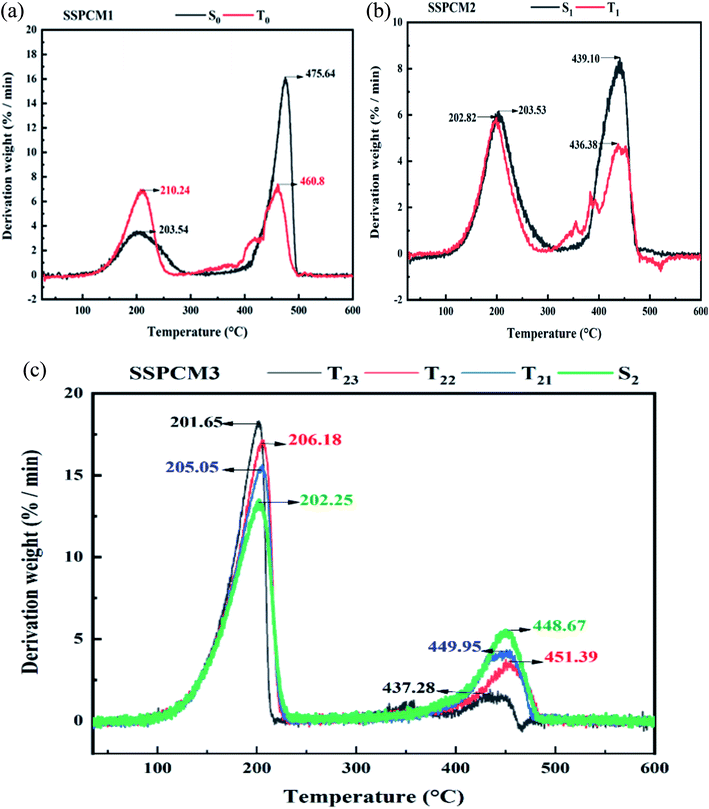
TGA tests ranging from 25 °C to 600 °C with heating rate 10 °C min−1 were performed to determine the onset temperature of SSPCMs degradation and rate of weight loss at which is occurs. For the all SSPCMs, the thermal degradation is a two-step process, corresponding to the degradation of hexadecane and polymers, which is typical for immiscible blends that have different degradation temperatures.24 As shown in Fig. 5, LDPE and the SEBS were almost decomposed completely in a single step over a temperature range 500–600 °C and 400–500 °C, respectively.82 The thermal stability and the loading percentage of CuO in the composite SSPCMs were evaluated by thermal gravimetric analysis (TGA). There was almost no mass loss below 100 °C, revealing that the composite PCMs had excellent thermal stability within their working temperature range. The LDPE has the highest thermal stability, followed by the SEBS, the SSPCM3 and finally the Hex. Pure Hex began to decompose at 225 °C, and a lower percentage of CuO in PCMs could improve the thermal stability. However, an excess of CuO accelerated the decomposition of Hex possibly due to the enhanced thermal conductivity.83 Pure Hex, SEBS and LDPE were completely burnt out in the air atmosphere when heated to 550 °C. Whereas there was a negligible loss of mass for CuO due to its remarkable stability.84,85 Hence, the weight percentage of the final residue should account for the content of CuO in the composite PCMs. The findings suggested that SEBS, Hex, LDPE and CuO have been successfully mixed, and that the prepared composite PCM exhibits a good thermal reliability in the operating temperature range. The SEBS seems to act as a heat barrier so that it takes longer for heat to reach the blends. According to the TGA curves, the weight loss of the samples in TGA curves is basically correspond with the composition in Table 1. In case of SSPCM1 and SSPCM2, the first step represents the onset decomposition temperature ranged from 150–250 °C, and the final decomposition temperature range was 380–500 °C (Fig. 6). The first step corresponding to the degradation of hexadecane and the second step at above 400 °C represents the degradation of the polymer matrix (LDPE or SEBS). In SSPCM3, the experimental percentage of mass loss during the first step is about 75% wt corresponds to the quantity of hexadecane mixed in the SSPCM. The DTG curves of all SSPCMs revealed that addition of CuO has increased the onset degradation temperature and the maximum weight loss temperature. It is significant that the maximum weight loss temperature of the microcapsules depends on the weight ratio of CuO. Therefore, sample T23 which was synthesized with the weight ratio of 15% CuO achieved the highest weight loss temperature. In addition, the thermal stability of the composite is improved by the adding of CuO. The improvement in thermal stability can be explained by the onset decomposition temperature related to the specific heat capacity of SSPCMs which can be raised by the specific heat capacity of microparticles. As a result, the phase change temperature of SSPCMs was lower than 25 °C, and the application temperature range was also lower than 100 °C, which was lower than the mass loss start temperature, and there was almost no mass loss in the application temperature range. Therefore, the prepared SSPCMs possessed excellent heat storage performance and great thermal stability.3.4 The shape stability of SSPCMs
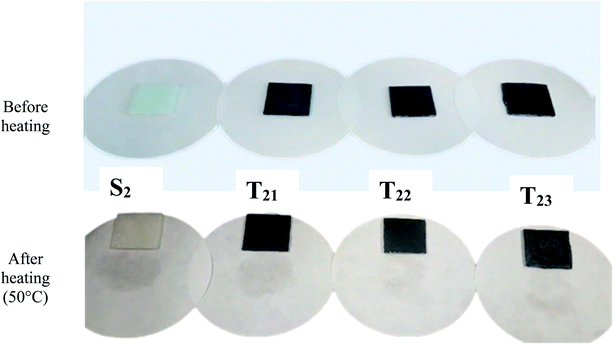
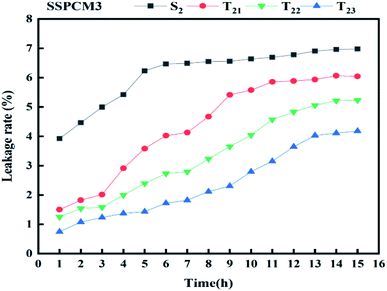
Leakage-proof is an important property of SSPCMs for TES. The leakage test was conducted by comparing the SSPCMs which were heated at above the melting point of Hex (PCM). Fig. 7 shows the photographs of SSPCM3 composites on the filter paper for 15 consecutive hours of heating at 50 °C. As seen from Fig. 7, there are some imprints which appear around S2 after thermal treatment. The relationships between the leakage rates and time of SSPCM3 composites with and without CuO are presented in Fig. 8. The leakage rates of SSPCM3 increased significantly during 12 hours of the thermal cycling, due to the residual melting on the surface of the samples. After 15 hours, the total leakage rates of S2 ∼ T23 reached 6.97%, 6.045%, 5.23%, 4.17%. The addition of CuO can help support the shape stabilization of the samples. The leakage rate decreased with the increase of CuO. This is already seeded in the Fig. 8; the leakage rate is under 6% after 16 heating cycles. It can be concluded that the CuO contributes to improving the shape stability of S0 blend with an important amount of hexadecane. This result can be explicated by the capillary and surface tension action for its network-like porous structure.86 SEBS provides the form stability because paraffin trapped in the EB rich microdomain of SEBS which restricts the chain movement of paraffin within the matrix and thus reduces the leakage of paraffin inside the composites. The photographs show, some imprints appearing around S2 and no imprints appearing around T23 after thermal treatment. This leakage test proves that the T23 has a good observation for shape stability. The results indicate that no substantial Hex leakage occurred even during the test carried out at a temperature much greater than the melting point. Thus, the support (LDPE/SEBS/CuO) is capable of absorbing and retaining the important liquified amount of hexadecane, giving rise to thermally stable PCMs.3.5 TES performance of SSPCMs
The possibility to use PCMs in engineering applications is related to their capability to store/release thermal energy in a useful temperature interval. Therefore, the investigation of the thermal properties of the prepared specimens plays a major role in the present investigation. DSC analysis presents the phase transition temperatures and latent heat of melting/solidification of SSPCMs, as shown in Fig. 9. DSC thermograms present the endothermic and exothermic curves, respectively, of Hex (a), SSPCM1 without SEBS (b), SSPCM2 without LDPE (c) and SSPCM3 (d) with various mass fractions of CuO. The measured values of phase transition thermal properties of Hex and SEBS/Hex/LDPE/CuO SSPCMS prepared with impregnation method determined by DSC analysis are summarized in Table 2. To obtain the maximally efficient energy storage capacity, the mass fraction of Hex was found to be 75%, with a good form stability, which surmounts almost all mass fraction values reported in the literature.28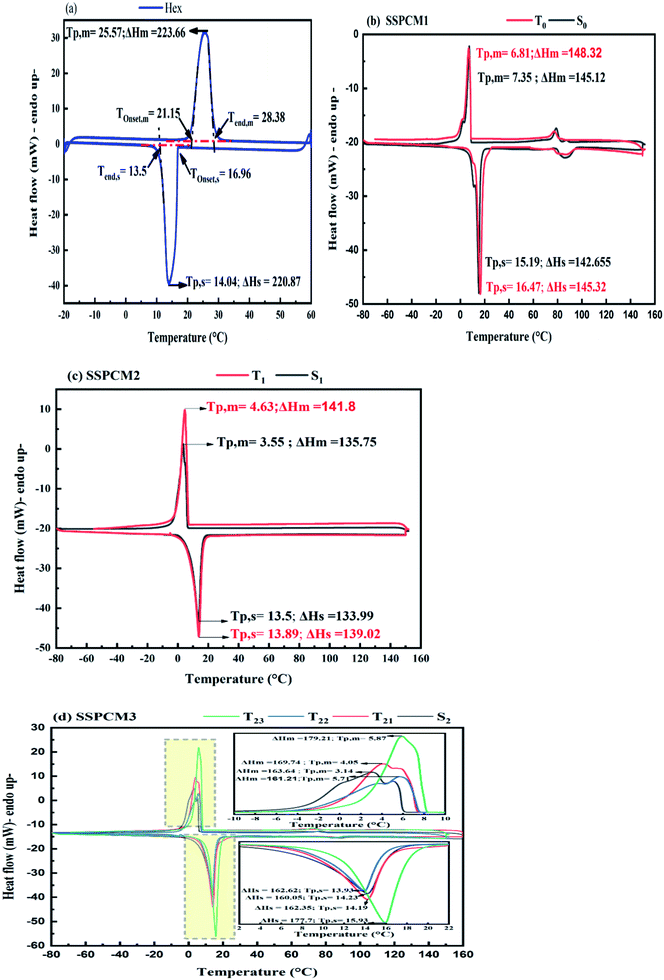 | ||
| Fig. 9 DSC experiment of endothermic and exothermic thermograms for Hex (a) and SSPCMs (b), (c) and (d). | ||
| Sample | Onset (°C) | Peak (°C) | Endset (°C) | Supercooling | ||||
|---|---|---|---|---|---|---|---|---|
| Tom | Tos | Tpm | Tps | Tem | Tes | ΔT = |Tpm − Tps| | ||
| a Tom: onset melting temperature of DSC curve. Tos: onset solidification temperature of DSC curve. Tpm: melting peak temperature of DSC curve. Tps: solidification peak temperature of DSC curve. Tem: endset melting temperature of DSC curve. Tes: endset solidification temperature of DSC curve. | ||||||||
| PCM | Hex | 21.15 | 16.96 | 25.57 | 14.04 | 13.5 | 28.38 | 11.53 |
| SSPCM1 | S0 | −1.7 | 16.5 | 7.35 | 15.19 | 8.7 | 8.10 | 7.84 |
| T0 | −2.7 | 20.1 | 6.81 | 16.47 | 8.7 | 8.4 | 9.66 | |
| SSPCM2 | S1 | −3.7 | 16.55 | 3.55 | 13.50 | 6.7 | 2.94 | 9.95 |
| T1 | −2.62 | 17.44 | 4.63 | 13.89 | 7.26 | 2.05 | 9.26 | |
| SSPCM3 | S2 | −3.45 | 16 | 3.14 | 13.93 | 5.94 | 6.53 | 10.79 |
| T21 | −0.65 | 16.44 | 4.05 | 14.19 | 7.13 | 7.58 | 10.14 | |
| T22 | −2.6 | 15.76 | 5.71 | 14.23 | 7.40 | 8.06 | 8.52 | |
| T23 | 2.06 | 18.30 | 5.87 | 15.93 | 8.02 | 9.17 | 10.06 | |
For PCMs where solid–liquid transition occurs, this is equal to the specific heat (Cp) that is the typical output of a colorimeter's measurement.87 The enthalpy is obtained by integrating the heat stored in a given temperatures as eqn (2) follows:
 | (2) |
 is the heat flow in units of W g−1, and
  is the DSC heating rate in units of °C s−1.
Further addition of heat is stored through sensible heat in the liquid phase as the temperature raises again uniformly in a rate proportional to the PCM specific heat. Therefore, the total amount of energy stored for a TES system is given by eqn (3):
 | (3) |
In Fig. 9, the first peak at the temperature range 3.14 °C to 7.35 °C in the thermograms is related to the paraffin wax; whereby the melting of the polyethylene's is seen in the second peak, range between 60–90°C (Fig. 9(b)). A similar trend can be detected in the cooling stage; the solidification peak of the Hex is measured at the temperature range 13.5 °C to 16.47 °C in the thermograms is related to the paraffin wax; while that of LDPE range between 80–100 °C·In all plots, as expected, the melting point was influenced by the additives of CuO. It was observed the increase in melting temperature, as presented in Table 2, is due to the penetration of additives in the microstructure of SSPCMs. Increasing the amount of CuO in the SSPCM1 reduces the Tom of the paraffin, and increases the Tom of the paraffin in SSPCM2 and SSPCM3 respectively. For SSPCM3 at concentrations of 5, 10 and 15 wt%, of CuO the Tom ratio increased by 81.16%, 24.63%, and 100.59%, respectively compared to S2. The intensity of the peak associated to the melting of the composite is higher than without CuO and delayed the end of the melting point of the phase change. Furthermore, adding CuO additives at varying concentrations alters the solidification onset temperature of exothermic curve. The enhanced ratio of Tos into Hex is 21.81% and 5.37% of SSPCM1 and SSPCM2 respectively. Adding the CuO to S2 at concentrations of 5 and 15 wt%, increases Tos by 2.75% and 14.38%, respectively. Adding those additives to paraffin resulted in a higher Tos and allowed the solidification phase change of paraffin to occur at higher temperatures. This situation makes it possible to use a phase-change heat at higher temperatures to enhance the heat release rate of paraffin.
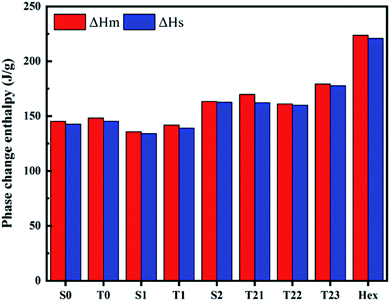
The phase change enthalpy is an important factor representing the phase properties and reflects the melting of the Hex content of SSPCMs. The comparison of the melting (ΔHm) and solidification (ΔHs) enthalpies of Hex and SSPCMs are presented in Fig. 10. It is clear that the composite latent heat with various mass fractions of CuO is greater than composites without CuO. The ΔHm and ΔHs of Hex are determined of 223.66 and 220.86 J g−1, respectively. The increasing in ΔHm of SSPCM3 (T21 and T23) has been obtained of 3.72% and 9.51% as compared to S2. Similarly, the ΔHs phase change enthalpy also increased by 1.43%, 1.6%, and 11.03% for T21, T22 and T23 respectively. It was found that the latent heat of the SSPCM1 and SSPCM2 increased with addition of CuO, because the heat transfer rate between the PCM and the environment is increased. It can be concluded that the high thermal conductivity of CuO allows the thermal energy to flow quickly through the blend, reaching the PCM. The advantage of this configuration is to combine a high storage capacity and high heat propagation rate. The specific heat capacity is a key parameter in describing the thermal energy storage during sensible heat process (before and after phase transitions) (Fig. 11). The heat capacity of the PCM and SSPCM was calculated based on the DSC heat-flow curve. The heat capacity of materials can be determined using eqn (4):
 | (4) |
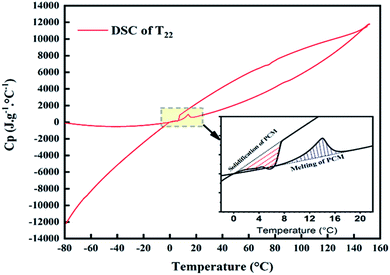
As latent heat was increased, the heat capacity of the SSPCM with CuO also increased, as seen in Table 3. Several studies showed that the heat capacity of a material can be enhanced by enhancing its crystallinity.88 The increase in specific heat capacity with the addition of CuO leads to an increase in the thermal energy storage caused by the increase in the sensible heat contribution. The increase in the sensible heat contribution toward the total Thermal Energy Storage (TES) is also very important, especially when the PCM works within higher temperature ranges.
| Sample | Specific heat capacity Cp (J g−1 °C) at onset temperature | ||
|---|---|---|---|
| Melting (Tom) | Solidification (Tos) | ||
| SSPCM1 | S0 | 610.74 | 598.05 |
| T0 | 622.74 | 603.85 | |
| SSPCM2 | S1 | 630.10 | 600.02 |
| T1 | 642.55 | 612.82 | |
| SSPCM3 | S2 | 772.25 | 778.11 |
| T21 | 791.33 | 788.29 | |
| T22 | 624.88 | 615.65 | |
| T23 | 1009.79 | 998.94 | |
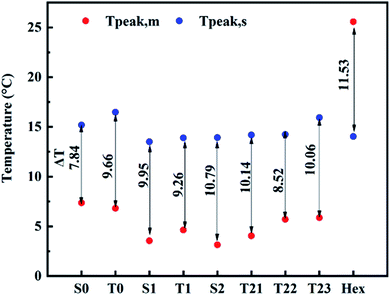
The supercooling of PCMs is one of their drawbacks. That's why, minimizing supercooling is one of the purposes of synthesizing the SSPCMs. The degree of supercooling (ΔT) of Hex and SSPCMs is presented in Fig. 12. A notable fact in Fig. 12 is that supercooling degree of the all SSPCMs is smaller than PCM during melting/solidification process. Adding those additives to paraffin results in a higher heat conduction performance and allows the SSPCMs to response the rapid heat load changes in the charging and discharging process.
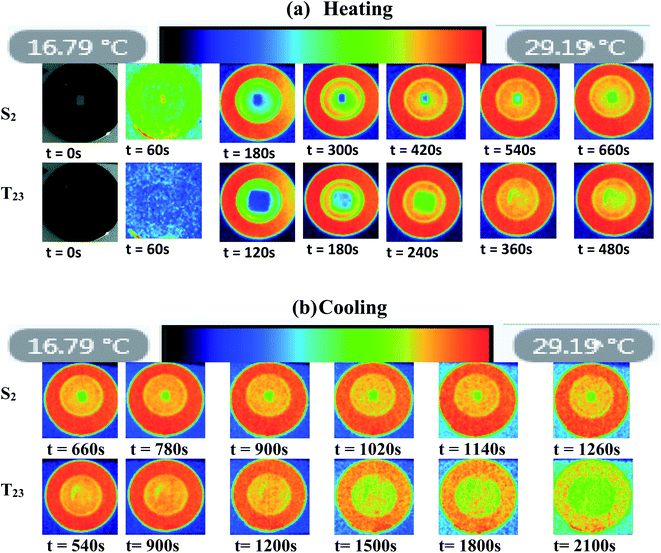
3.6 Infrared thermography (IRT) analysis
Fig. 13 presents the surface temperature distribution of the samples captured during the IRT test at various times with 60 s intervals. The infrared images allow a clear determination of the phase change process for both melting and solidification experiments as shown for S2 and T23 respectively. As shown in the scale bar, the black, dark blue colour represents the coldest temperature before transitioning through light blue, yellow and red, representing the highest temperature. As it can be seen throughout the thermal images, an instant and uniform hot region gradually expanded from that top to the middle with belly tip at the center. Obviously from these images, the composite T23 shows faster thermal responses than that observed from S2.The IR images used to study the heating cycle for T23 clearly portrays the hot spot generation and development within the Hex–CuO composite by time that helps to better visualize the melting process of Hex adjacent to CuO. Taking 180 s as an example, introduced CuO leads to increased dark blue regions. The composite T23 is much more blue color, but the middle region of the S2 is still in dark blue color. Similarly, in the course of solidification, temperature decreasing can be clearly indicated by the color changing from red to blue. When CuO is introduced, the solidification rates of the composite PCM increase gradually. Based on the above observations, it can be concluded that CuO as an additive can tremendously enhance the heat transfer efficiency of the SSPCMs. The enhancement in melting process with CuO is due to the uniform and homogenous dispersion of organic based microparticles in organic matrix, which increase the viscosity and shape stability and lowers the convection heat transfer. The added CuO provides more mechanical strength for the contained composite and prevents the leakage of the melted compounds.
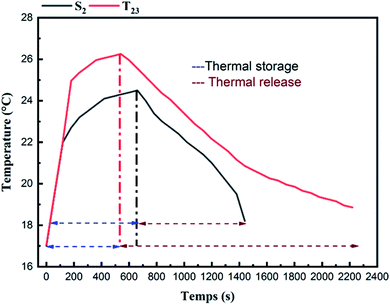
As shown in Fig. 14, the time that's required for the melting and solidification processes of Hex in the SSPCMs without and with CuO. As can be seen, the temperature of the composite T23 continues to rise rapidly within 540 s, and the maximum temperature reaches about 26.25 °C. In contrast, the temperature rise speed of S2 is slightly slower than that of T23 due to the heat absorption of internal Hex; the maximum temperature within 658 s reaches about 24.5 °C. According to Fig. 14, the composite T23 showed an increase in the rate of heat transfer and faster response to charging (melting). In the cooling process, in contrast to the fastest decrease of the temperature of the S2, the temperature of T23 dropped slower and become longer. The reducing of the melting time shows an improvement in TES response time to the demand by adding CuO to the SSPCM. Nevertheless, the energy release was a very long process since the beginning of the solidification. A layer solid Hex was formed on the upper surface of the material which was in contact with the hot plate. This is ascribed to the formation of a thin layer that ‘‘insulates’’ the liquid PCM from the cooling source.28 Furthermore, it can be noted that the period of solidification was much longer than the melting process. This increase is mainly attributed to the SEBS content, because it has discrete blocks of styrene (PS) that make hexagonal cylindrical structures in the EB matrix, forming a physical crosslinking network that allows SEBS to strongly absorb Hex.77
4 Conclusion
This work aims to study the potential usage of the copper oxide impregnated with SEBS/Hex/LDPE of SSPCMs as temperature regulative material in energy efficient-buildings. A series of Shape-Stabilized composite PCMs (SSPCM1, SSPCM2 and SSPCM3) were prepared by physical impregnation. The SEM and FTIR results showed that the ingredients of the prepared composition were interacted with each other only physically and not chemically. The experimental observations by IRT suggested that the resulting composite T23 (with 15% CuO) exhibited an increase in the rate of heat transfer faster melting and long discharging process of thermal energy. The DSC results indicated good energy storage/release capacity with suitable phase change temperatures for building TES applications. The latent heats of T21 and T23 in the melting process were 169.74 and 179.21 J g−1, respectively, which increased by 3.72 and 9.51%, successively, compared with that of S2, indicating that the heat transfer rate between the PCM and the environment has increased. It can be concluded that the high thermal conductivity of CuO allows the thermal energy to flow quickly through the blend, reaching the PCM. The advantage of this configuration is to combine a high storage capacity and a high heat propagation rate. As latent heat increased, the heat capacity of the SSPCM with CuO also increased. The rise in specific heat capacity with the addition of CuO leads to an increase in the thermal energy storage caused by the growth of the sensible heat contribution. The effect of adding CuO caused a decrease in supercooling degree of the all SSPCMs than PCM during melting/solidification process. Adding those additives to paraffin results in a higher heat conduction performance and allows the SSPCMs to response the rapid heat load changes in the charging and discharging process. According to the TGA results, the all composites were greatly stable in terms of chemical structure and TES properties at the working temperature range. The reduction of costs connected with CuO microparticles indicated as suitable dopant for improving thermal properties in PCMs.In conclusion, the prepared SSPCMs exhibited high latent heat, great chemical compatibility, thermal degradation stability and thermophysical properties which were a promising composite PCM in the field of building energy storage.
Nomenclature
| T | Temperature, °C |
| Cp | Specific heat capacity, J g−1 °C |
Subscripts
| Hex | Hexadecane |
| m | Melting |
| s | Solidification |
| SSPCMs | Shape-stabilized PCMs |
| TES | Thermal energy storage |
| LHTES | Latent heat |
| TES PCMs | Phase change materials |
| IRT | Infrared thermography |
Conflicts of interest
There are no conflicts to declare.References
- X. Huang, X. Chen, A. Li, D. Atinafu, H. Gao, W. Dong and G. Wang, Chem. Eng. J., 2019, 356, 641–661 CrossRef CAS.
- I. Sarbu and A. Dorca, Int. J. Energy Res., 2019, 43, 29–64 CrossRef CAS.
- A. Fouda, P. Těšinová, A. Khalil and M. Eldeeb, Alexandria Eng. J., 2022, 61, 7029–7036 CrossRef.
- B. Srinivasaraonaik, S. Sinha and L. Pratap Singh, in Energy Storage Devices, IntechOpen, 2021 Search PubMed.
- A. Sharma, V. V. Tyagi, C. R. Chen and D. Buddhi, Renewable Sustainable Energy Rev., 2009, 13, 318–345 CrossRef CAS.
- A. M. Khudhair and M. M. Farid, Energy Convers. Manage., 2004, 45, 263–275 CrossRef CAS.
- V. V. Tyagi and D. Buddhi, Renewable Sustainable Energy Rev., 2007, 11, 1146–1166 CrossRef.
- P. Zhang, L. Song, H. Lu, J. Wang and Y. Hu, Energy Convers. Manage., 2010, 51, 2733–2737 CrossRef CAS.
- A. Trigui, M. Karkri, C. Boudaya, Y. Candau and L. Ibos, Composites, Part B, 2013, 49, 22–35 CrossRef CAS.
- H. Yang, Y. Wang, Q. Yu, G. Cao, R. Yang, J. Ke, X. Di, F. Liu, W. Zhang and C. Wang, Appl. Energy, 2018, 212, 455–464 CrossRef.
- J. Lei, Y. Tian, D. Zhou, W. Ye, Y. Huang and Y. Zhang, Solar Energy, 2017, 221, 75–86 CrossRef.
- A. Sarı and A. Biçer, Sol. Energy Mater. Sol. Cells, 2012, 101, 114–122 CrossRef.
- M. Kenisarin and K. Mahkamov, Renewable Sustainable Energy Rev., 2007, 11, 1913–1965 CrossRef CAS.
- C. A. Ikutegbe and M. M. Farid, Renewable Sustainable Energy Rev., 2020, 131, 110008 CrossRef CAS.
- G. Yang, Y.-J. Yim, J. W. Lee, Y.-J. Heo and S.-J. Park, Molecules, 2019, 24, 2055 CrossRef CAS PubMed.
- M. Liu, Y. Ma, H. Wu and R. Y. Wang, ACS Nano, 2015, 9, 1341–1351 CrossRef CAS PubMed.
- A. Trigui, M. Karkri and I. Krupa, Energy Convers. Manage., 2014, 77, 586–596 CrossRef CAS.
- P. B. Salunkhe and P. S. Shembekar, Renewable Sustainable Energy Rev., 2012, 16, 5603–5616 CrossRef CAS.
- H. Inaba and P. Tu, Heat Mass Transfer, 1997, 32, 307–312 CrossRef CAS.
- A. Trigui, M. Karkri, C. Boudaya, Y. Candau, L. Ibos and M. Fois, J. Compos. Mater., 2014, 48, 49–62 CrossRef.
- Y. Cai, Y. Hu, L. Song, H. Lu, Z. Chen and W. Fan, Thermochim. Acta, 2006, 451, 44–51 CrossRef CAS.
- W. Wang, X. Yang, Y. Fang and J. Ding, Appl. Energy, 2009, 86, 170–174 CrossRef CAS.
- L. Wang and D. Meng, Appl. Energy, 2010, 87, 2660–2665 CrossRef CAS.
- J. A. Molefi, A. S. Luyt and I. Krupa, Thermochim. Acta, 2010, 500, 88–92 CrossRef CAS.
- M. Xiao, B. Feng and K. Gong, Energy Convers. Manage., 2002, 43, 103–108 CrossRef CAS.
- C. Alkan, K. Kaya and A. Sarı, J. Polym. Environ., 2009, 17, 254–258 CrossRef CAS.
- C. Moulahi, A. Trigui, M. Karkri and C. Boudaya, Compos. Struct., 2016, 149, 69–78 CrossRef.
- I. Chriaa, M. Karkri, A. Trigui, I. Jedidi, M. Abdelmouleh and C. Boudaya, Polymer, 2021, 212, 123128 CrossRef CAS.
- A. Safari, R. Saidur, F. A. Sulaiman, Y. Xu and J. Dong, Renewable Sustainable Energy Rev., 2017, 70, 905–919 CrossRef CAS.
- X. Liu, K. Zhuang, S. Lin, Z. Zhang and X. Li, Crystals, 2017, 7, 128 CrossRef.
- A. Trigui, M. Karkri, L. Peña, C. Boudaya, Y. Candau, S. Bouffi and F. Vilaseca, J. Compos. Mater., 2013, 47, 1387–1397 CrossRef CAS.
- P. Zhang, X. Xiao and Z. W. Ma, Appl. Energy, 2016, 165, 472–510 CrossRef CAS.
- P. Bose and V. A. Amirtham, Renewable Sustainable Energy Rev., 2016, 65, 81–100 CrossRef CAS.
- S. Zhang, D. Feng, L. Shi, L. Wang, Y. Jin, L. Tian, Z. Li, G. Wang, L. Zhao and Y. Yan, Renewable Sustainable Energy Rev., 2021, 135, 110127 CrossRef CAS.
- S. Wu, T. Yan, Z. Kuai and W. Pan, Energy Storage Materials, 2020, 25, 251–295 CrossRef.
- C. Moulahi, A. Trigui, C. Boudaya and M. Karkri, J. Thermoplast. Compos. Mater., 2017, 30, 887–914 CrossRef CAS.
- B. Tang, M. Qiu and S. Zhang, Sol. Energy Mater. Sol. Cells, 2012, 105, 242–248 CrossRef CAS.
- X. Zhang, Z. Huang, B. Ma, R. Wen, M. Zhang, Y. Huang, M. Fang, Y. Liu and X. Wu, RSC Adv., 2016, 6, 58740–58748 RSC.
- X. Xiao, P. Zhang and M. Li, Appl. Energy, 2013, 112, 1357–1366 CrossRef CAS.
- J. L. Zeng, Z. Cao, D. W. Yang, L. X. Sun and L. Zhang, J. Therm. Anal. Calorim., 2010, 101, 385–389 CrossRef CAS.
- Y. Deng, J. Li, T. Qian, W. Guan, Y. Li and X. Yin, Chem. Eng. J., 2016, 295, 427–435 CrossRef CAS.
- B. Tang, C. Wu, M. Qiu, X. Zhang and S. Zhang, Mater. Chem. Phys., 2014, 144, 162–167 CrossRef CAS.
- R. K. Sharma, P. Ganesan, V. V. Tyagi, H. S. C. Metselaar and S. C. Sandaran, Appl. Therm. Eng., 2016, 99, 1254–1262 CrossRef CAS.
- J. Wang, H. Xie, Z. Guo, L. Guan and Y. Li, Appl. Therm. Eng., 2014, 73, 1541–1547 CrossRef CAS.
- Y. Chen, Q. Zhang, X. Wen, H. Yin and J. Liu, Sol. Energy Mater. Sol. Cells, 2018, 184, 82–90 CrossRef CAS.
- F. Ye, Z. Ge, Y. Ding and J. Yang, Particuology, 2014, 15, 56–60 CrossRef CAS.
- J.-N. Shi, M.-D. Ger, Y.-M. Liu, Y.-C. Fan, N.-T. Wen, C.-K. Lin and N.-W. Pu, Carbon, 2013, 51, 365–372 CrossRef CAS.
- J. Lopez, Z. Acem and E. Palomo Del Barrio, Appl. Therm. Eng., 2010, 30, 1586–1593 CrossRef CAS.
- M. Li, Appl. Energy, 2013, 106, 25–30 CrossRef CAS.
- W. Wang, C. Wang, T. Wang, W. Li, L. Chen, R. Zou, J. Zheng and X. Li, Mater. Chem. Phys., 2014, 147, 701–706 CrossRef CAS.
- M. Mehrali, S. T. Latibari, M. Mehrali, T. M. Indra Mahlia and H. S. Cornelis Metselaar, Energy, 2013, 58, 628–634 CrossRef CAS.
- Z. Liu, H. Wei, B. Tang, S. Xu and Z. Shufen, Sol. Energy Mater. Sol. Cells, 2018, 174, 538–544 CrossRef CAS.
- X. Huang, G. Alva, L. Liu and G. Fang, Appl. Energy, 2017, 200, 19–27 CrossRef CAS.
- S. Wu, T. X. Li, T. Yan, Y. J. Dai and R. Z. Wang, Int. J. Heat Mass Transfer, 2016, 102, 733–744 CrossRef CAS.
- Y. Zhong, M. Zhou, F. Huang, T. Lin and D. Wan, Sol. Energy Mater. Sol. Cells, 2013, 113, 195–200 CrossRef CAS.
- S. Ye, Q. Zhang, D. Hu and J. Feng, J. Mater. Chem. A, 2015, 3, 4018–4025 RSC.
- J. Yang, L.-S. Tang, R.-Y. Bao, L. Bai, Z.-Y. Liu, W. Yang, B.-H. Xie and M.-B. Yang, Chem. Eng. J., 2017, 315, 481–490 CrossRef CAS.
- J. Shen, Z. Hu, C. Wang, K. Chen, Z. Cai and T. Wang, ChemistrySelect, 2019, 4, 4125–4130 CrossRef CAS.
- W. Wang, X. Yang, Y. Fang, J. Ding and J. Yan, Appl. Energy, 2009, 86, 1196–1200 CrossRef CAS.
- L. Zhang, J. Zhu, W. Zhou, J. Wang and Y. Wang, Thermochim. Acta, 2011, 524, 128–134 CrossRef CAS.
- C. Y. Zhao and Z. G. Wu, Sol. Energy Mater. Sol. Cells, 2011, 95, 636–643 CrossRef CAS.
- M. Mehrali, S. T. Latibari, M. Mehrali, H. S. C. Metselaar and M. Silakhori, Energy Convers. Manage., 2013, 67, 275–282 CrossRef CAS.
- X. Chen, Z. Tang, P. Liu, H. Gao, Y. Chang and G. Wang, Matter., 2020, 3, 708–741 CrossRef.
- S. Song, J. Li, Z. Yang and C. Wang, ACS Omega, 2021, 6, 3891–3899 CrossRef CAS PubMed.
- H. Wang, F. Wang, Z. Li, Y. Tang, B. Yu and W. Yuan, Appl. Energy, 2016, 176, 221–232 CrossRef CAS.
- X. Xiao, P. Zhang and M. Li, Appl. Energy, 2013, 112, 1357–1366 CrossRef CAS.
- M. Nourani, N. Hamdami, J. Keramat, A. Moheb and M. Shahedi, Renewable Energy, 2016, 88, 474–482 CrossRef CAS.
- S. Harikrishnan and S. Kalaiselvam, Thermochim. Acta, 2012, 533, 46–55 CrossRef CAS.
- K. Karunamurthy, Dig. J. Nanomater. Biostructures, 2012, 7, 1833–1841 Search PubMed.
- S. Wu, D. Zhu, X. Zhang and J. Huang, Energy Fuels, 2010, 24, 1894–1898 CrossRef CAS.
- N. Putra, E. Prawiro and M. Amin, Int. J. Technol., 2016, 7, 244 CrossRef.
- I. Krupa and A. Luyt, Polym. Degrad. Stab., 2001, 73, 157–161 CrossRef CAS.
- L. A. Utracki, in Polymer Blends Handbook, Springer Netherlands, Dordrecht, 2014, pp. 1559–1732 Search PubMed.
- W. Cheng, R. Zhang, K. Xie, N. Liu and J. Wang, Sol. Energy Mater. Sol. Cells, 2010, 94, 1636–1642 CrossRef CAS.
- I. Krupa, Z. Nógellová, Z. Špitalský, M. Malíková, P. Sobolčiak, H. W. Abdelrazeq, M. Ouederni, M. Karkri, I. Janigová and M. A. S. A. Al-Maadeed, Thermochim. Acta, 2015, 614, 218–225 CrossRef CAS.
- M. Karkri, M. Lachheb, Z. Nógellová, B. Boh, B. Sumiga, M. A. AlMaadeed, A. Fethi and I. Krupa, Energy Build., 2015, 88, 144–152 CrossRef.
- P. Chen, X. Gao, Y. Wang, T. Xu, Y. Fang and Z. Zhang, Sol. Energy Mater. Sol. Cells, 2016, 149, 60–65 CrossRef CAS.
- I. Chriaa, A. Trigui, M. Karkri, I. Jedidi, M. Abdelmouleh and C. Boudaya, Appl. Therm. Eng., 2020, 171, 115072 CrossRef CAS.
- G. D. M. Margareta Avram, in Application in Organic Chemistry, Bucharest, 1966 Search PubMed.
- J.-F. Masson, L. Pelletier and P. Collins, J. Appl. Polym. Sci., 2001, 79, 1034–1041 CrossRef CAS.
- J. Guilment and L. Bokobza, Vib. Spectrosc., 2001, 26, 133–149 CrossRef CAS.
- J. K. Akishino, D. P. Cerqueira, G. C. Silva, V. Swinka-Filho and M. Munaro, Thermochim. Acta, 2016, 626, 9–12 CrossRef CAS.
- Y. R. Lee, A. V. Raghu, H. M. Jeong and B. K. Kim, Macromol. Chem. Phys., 2009, 210, 1247–1254 CrossRef CAS.
- J. Yang, P. Yu, L.-S. Tang, R.-Y. Bao, Z.-Y. Liu, M.-B. Yang and W. Yang, Nanoscale, 2017, 9, 17704–17709 RSC.
- J. Yang, L.-S. Tang, R.-Y. Bao, L. Bai, Z.-Y. Liu, W. Yang, B.-H. Xie and M.-B. Yang, J. Mater. Chem. A, 2016, 4, 18841–18851 RSC.
- S. Kim, S. J. Chang, O. Chung, S.-G. Jeong and S. Kim, Energy Build., 2014, 70, 472–479 CrossRef.
- K. Azzouz, D. Leducq and D. Gobin, Int. J. Refrig., 2009, 32, 1634–1644 CrossRef CAS.
- M. Abdelmouleh and I. Jedidi, in Plastic Deformation in Materials, IntechOpen, 2021 Search PubMed.
| This journal is © The Royal Society of Chemistry 2022 |

