 Open Access Article
Research on UO2 modification of a direct ethanol fuel cell Pt/C catalyst
Dashu Pan a,
Yubing Xue
 a,
Songtao Xiao*a,
Yinggen Ouyanga,
Feng Zuob,
Fuyan Loua and
Xiang Lia
aChina Institute of Atomic Energy, Beijing, 102413, China
bSchool of Nuclear Science and Technology, Xi'an Jiaotong University, Xi'an, 710049, China
First published on 12th August 2022
Abstract
Radioactive UO2 powder was prepared by hydrothermal method and a set of Pt–xUO2/C catalysts were synthesized by impregnation method for solving the problem of low activity and easy poisoning of anode Pt/C catalysts for a direct ethanol fuel cell. XRD, TEM, EDS, XPS and ICP-MS characterization showed the successful loading of Pt and UO2 onto the carbon carrier. Electrochemical workstation and single cell test results confirm that the catalytic performance of Pt–10% UO2/C is significantly better than Pt/C-eg. It is speculated that the synergistic effect of Pt and U enhances the catalytic activity and UO2 improves the resistance to CO poisoning by releasing O2 stored in the lattice space, while the α-particles released by 235U can also generate radiolysis product OH and promote the oxidative desorption of CO from the Pt surface.
1. Introduction
Since the beginning of the 21st century, the world has been facing increasingly serious problems of energy shortages and environmental pollution. It is urgent to explore clean and alternative energy sources and develop green energy power generation technologies.1–3 Ethanol has become globally recognized as an important source of energy because it is abundant, has a high molecular energy density, and is easily produced from a renewable source (plant matter).4 The direct ethanol fuel cell (DEFC), as a new type of energy conversion device with a compact configuration and convenient operation, can convert the chemical energy of ethanol directly into electricity while the combustion products do not contain substances harmful to the environment or human health, such as sulphur oxides and nitrogen oxides.5,6The core component of the DEFC, the membrane electrode assembly (MEA), consists of the proton exchange membrane, Pt catalytic layer and diffusion layer. The mechanism for ethanol oxidation reaction (EOR) is still at the research stage. The intermediate and final products of EOR are usually studied and analyzed using equipment such as differential electrochemical mass spectrometry,7 Raman Spectroscopy8,9 and in situ IR spectroscopy.10 Typically the main products of EOR are acetaldehyde, acetic acid and carbon dioxide, and their formation is accompanied by a release of 2, 4 and 12 electrons per one ethanol molecule, respectively.11,12 In acidic electrolytes, the main product is acetaldehyde at higher concentration of ethanol; and at lower ethanol concentration, the water content will increase, which is conducive to the formation of PtOH (water dissociates and adsorbs on Pt: Pt + H2O → PtOH + H+ + e−), thereby promoting the production of acetic acid and CO2.13 In alkaline medium, the main intermediate products of EOR are acetaldehyde and acetate (the ethanol dehydrogenation reaction: (CH3CH2OH)ads + 3OH− → –(CH3CO)ads + 3H2O + 3e−).14,15 The OHads species, required by the removal of adsorbed ethoxy residues, is produced by water decomposition on Sn active sites in acid media, while in alkaline media, the OHads species is produced from the discharge of OH− in the solution, which is far more than enough. L. Jiang et al. investigated that the promotion effect of Sn in Pt–Sn/C, compared with Pt/C catalyst, is not as obvious in alkaline media as it is in acid solutions.16
Numerous fundamental studies have shown that Pt based catalysts have the most excellent performance.15,17 At present, the only commercial DEFC catalyst is Pt/C catalyst.18 However, the foremost obstacle to the development of DEFC technology is also the anode Pt/C catalyst because of its high cost (accounts for 36% of the fuel cell's total expenditure) and the performance drop attributed by the poor ability to resist CO poisoning.6,19,20 Ethanol in the anode catalytic layer generates CO-intermediates as a result of incomplete oxidation. The study has shown that the intermediate product CO is adsorbed on the Pt surface by linear adsorption, forming stable Pt carbonyl groups (Pt + CO → Pt–COads). As COads occupies the active site of Pt, it prevents further dissociation of ethanol and affects the Pt/C catalytic performance, ultimately leading to sharp decline in the cell performance.21–23
In addition to scan the poisoned Pt/C electrode in 0.5 mol L−1 H2SO4 solution, there are three other methods to solve the degradation of catalyst performance caused by CO poisoning: (1) according to the bifunctional mechanism, the addition of some auxiliary metals to the Pt/C catalyst can conducive to remove COads. M. Watanabe et al. found that Ru decomposes and adsorbs OH radicals from water at low potentials (Ru + H2O → Ru–OHads + H+ + e−), which rapidly oxidizes CO on the Pt surface to CO2 (Pt–COads + Ru–OHads → CO2 + H+ + e−), exposing the Pt active site and restoring the catalytic activity.24 M. J. Paulo et al. reported that Pt/C catalysts modified with CeO2 to catalyze the oxidation of ethanol, analyzed the increased resistance to poisoning for two reasons. One reason is that CeO2 has oxygen storage properties, storing oxygen at high oxygen concentrations and releasing oxygen to desorb CO at low concentrations, accompanied by a change in Ce valence between +3/+4 (Pt–COads + 4CeO2 + 2H+ + 2e− → 2Ce2O3 + Pt + CO2 + H2O). For another, based on the bifunctional mechanism, CeO2 decompose water molecules to form OHads species at low potentials, which oxidize CO on the Pt surface to produce CO2 at high potentials.25 There are also SnO2,16,26 TiO2,27 ZrO2 (ref. 28 and 29) and WO3 (ref. 30 and 31) be added to Pt/C catalysts to improve the resistance to poisoning through a bifunctional mechanism. (2) Based on the ligand effect, change the electronic structure of Pt, weaken the bond strength between Pt carbonyl groups (Pt–COads), so as to promote the oxidative desorption of CO and improve the resistance of the catalyst to poisoning. J. E. Sulaiman et al. investigated the Pt–Ni/C catalyst is more resistant to CO poisoning than Pt/C, gave a reasonable explanation through the ligand effect.32 (3) Improve the resistance to CO poisoning by introducing oxygen-containing groups on the catalyst carrier. C. T. Hsieh et al. first pretreated carbon nanotubes with nitric acid to infuse the carbon nanotubes with surface oxides such as carboxyl (–COOH), carbonyl (–C![[double bond, length as m-dash]](https://www.rsc.org/images/entities/char_e001.gif) O), and hydroxyl (–C–OH) on the ends and defects, and then used ethylene glycol to load the bimetallic reduction onto the carbon nanotubes to obtain the catalysts Pt–M (M = Fe, Co and Ni)/CNT. 5000 s i–t curves were tested to evaluate the anti-poisoning ability of the catalysts and it was found that Pt–Co/CNT had the best resistance to CO poisoning and was superior to Pt/CNT. The analysis is twofold, one is that oxygen-containing groups on the surface of carbon nanotubes can oxidize CO (CNT–OH + Pt–COads → CNT + Pt + CO2 + H+ + e−) and the other is that, according to the bifunctional mechanism, cobalt removes carbon monoxide from the Pt surface by providing OH or other oxygen-containing groups for oxidation.33
O), and hydroxyl (–C–OH) on the ends and defects, and then used ethylene glycol to load the bimetallic reduction onto the carbon nanotubes to obtain the catalysts Pt–M (M = Fe, Co and Ni)/CNT. 5000 s i–t curves were tested to evaluate the anti-poisoning ability of the catalysts and it was found that Pt–Co/CNT had the best resistance to CO poisoning and was superior to Pt/CNT. The analysis is twofold, one is that oxygen-containing groups on the surface of carbon nanotubes can oxidize CO (CNT–OH + Pt–COads → CNT + Pt + CO2 + H+ + e−) and the other is that, according to the bifunctional mechanism, cobalt removes carbon monoxide from the Pt surface by providing OH or other oxygen-containing groups for oxidation.33
Uranium is an important element in the nuclear industry and consists of several natural isotopes (238U, 235U and 234U, with natural abundances of 99.275%, 0.720% and 0.005%). 238U has a long half-life of approximately 4.5 billion years and is therefore safe to use. The use of uranium compounds as catalysts dates back to the beginning of the last century. The 5f orbital of U can hybridize with the 6d orbital, giving U a variety of oxidation states such as +2, +3, +4, +5 and +6. UO2 has a face-centered cubic structure and can store up to 10% extra oxygen in the lattice space without changing the crystal structure, ensuring structural integrity.34–36 D. P. Steve et al. prepared UOX/Al2O3 (2 < x< 2.25) catalysts for the catalytic reduction of NOX by CO. In comparison with 5% Pt/Al2O3, the loaded UOX catalysts showed both high thermal stability and high sulphur resistance.37 Z. R. Ismagilov et al. Synthetized the alumina-supported uranium oxide catalysts and performed their characterization in methane oxidation have, found that the catalysts containing 5% U (5% U–Al2O3 catalyst) at 1000 °C had the highest catalytic activity, and explained by the formation of highly active nanodispersed state of uranium on the surface of the support.38 Dongliang Gao et al. prepared triuranium octoxide-reduced graphene oxide (U3O8/rGO) hybrids by a two-step solution-phase method, which was used to catalyze the direct methanol fuel cell cathode oxygen reduction reaction, demonstrating higher catalytic activity and stability compared to Pt/C catalyst.39 L. Ding et al. Synthesized nanocomposites Pd–UO2/rGO via a solvothermal process in ethylene glycol, which catalyzes the reduction of 4-nitrophenol to 4-aminophenol. In this composite, the nanocrystals of metal Pd and UO2 are loaded on graphene oxide, and Pd nanocrystals are in close contact with UO2 nanocrystals. The authors suggested that the ternary hybrid Pd–UO2/rGO showed considerably higher catalytic activity than Pd–rGO. Besides the smaller sizes of Pd nanoparticles in the ternary hybrids, in which the aggregation of Pd nanoparticles was prevented by U, the charge transfer between the nano-structured Pd and U may also contribute to the enhancement of catalytic activity by offering more active sites for adsorption and reaction.40 Considering the co-catalytic effect of UO2 as shown above and the radioactivity property of it, we selected UO2 to inspect its effect on the Pt/C catalyst.
This work we investigate the catalytic activity, durability and resistance to CO poisoning resistance of the novel catalyst Pt–UO2/C, giving priority to the catalytic activity of UO2, solving the problem of CO poisoning of the anode Pt/C catalyst of DEFC. The Pt–UO2/C catalyst was synthesized by loading Pt particles onto the UO2-loaded carbon carrier via impregnation-reduction method and characterized by XRD, EDS, ICP-MS, TEM and XPS. The catalytic performance of the catalyst was tested by an electrochemical workstation and three electrodes. Besides, Pt–xUO2/C was assembled into a fuel cell to test the maximum cell power density.
2. Experimental
2.1. Materials
Cabot carbon (XC-72) was purchased from Suzhou Sinero. UO2(NO3)2·6H2O (AR) was purchased from China institute of atomic energy. H2PtCl6·6H2O (AR), C2H5OH (GR) were purchased from Aladdin reagent. N2H4·H2O (AR), NaOH (AR), H2SO4 (AR) were purchased from sinopharm chemical reagent. (CH2OH)2 (AR), C3H8O (AR) was purchased from Macklin reagent. Nafion (5 wt%) was purchased from Shanghai Hesen.2.2. Synthesis of UO2
Weigh 5 g of UO2(NO3)2·6H2O and dissolve it into 25 mL of ultrapure water, add 3 mL of N2H4·H2O into 25 mL of ultrapure water, pour the two sets of solutions into 100 mL of PTFE liner in turn, stir well and then put the liner into the reaction kettle and keep warm in the oven at 200 °C for 48 h. After the reaction kettle cools down, wash it 3 times with ultrapure water, dry it at 60 °C and then grind it to obtain UO2 blue–black powder.2.3. Synthesis of Pt–xUO2/C catalysts
139 mg of carbon and 70 mL of ethylene glycol were added to a round bottom flask and the solution was sonicated and adjusted to pH > 10 by adding 0.1 mol L−1 of NaOH. 21 mg of UO2 powder was sonicated in 5 mL of ultrapure water and then poured into the flask to obtain a mixed solution (sieve the UO2 before using it). A solution of chloroplatinic acid containing Pt 42 mg was added dropwise to the flask under stirring conditions. The flask was then transferred to an oil bath and stirred at 140 °C for 2 h, during which time high-purity N2 was continuously introduced into the flask. After waiting for the flask to cool, the product was washed using ethanol, dried at 60 °C and ground to give the catalyst Pt–10% UO2/C. The same process was used to prepare Pt–40% UO2/C, Pt–20% UO2/C, Pt–6.67% UO2/C, Pt–3.33% UO2/C, Pt–1.67% UO2/C, Pt–0.83% UO2/C, Pt–0.42% UO2/C, Pt–0.21% UO2/C, Pt–0.1% UO2/C, and Pt/C-eg, maintaining 20% mass fraction of Pt in all catalysts.2.4. Physical characterizations
The X-ray diffraction technique (XRD) characterizes the physical phases present in the material. The instrument used for this experiment was a Bruker D8 ADVANCE, manufactured in Germany, with a Cu target as the X-ray source, a voltage of 40 kV, a current of 40 mA and a test angle of 5–90°.The X-ray energy dispersive spectrometer (EDS) was used to analyze the surface morphology and composition of materials. The instrument used in this experiment was made by Japanese company and the model was SU8020.
Transmission electron microscopy (TEM) is used to observe the microstructure of materials. The instrument used in this experiment was manufactured by Japan Electronics Corporation and the model was JEM-F200.
X-ray photoelectron spectroscopy (XPS) was used to characterize the composition and structure of the material surface. The instrument used for this experiment was VG Multilab 2000 made in the United States. The excitation light source was Al K line, and the photon energy was 1486.7 eV.
Inductively coupled plasma mass spectrometer (ICP-MS) was used to analyze the elemental content of the solution. The instrument used in this experiment was manufactured by Agilent, Japan, and the model was Agilent 7850 ICP-MS.
2.5. Electrochemical measurements
An electrochemical workstation with three-electrode system was used to test the catalytic performance of the catalysts. The electrochemical workstation used for the experiments was manufactured by Shanghai Chenhua, model CHI760E. The three electrodes in order are saturated calomel electrode as reference electrode, model CHI150; platinum wire electrode as counter electrode, model CHI115; and glass carbon electrode as working electrode, model CHI104, three electrodes were purchased from Shanghai Chenhua Company. The working electrode is prepared as follows: using in turn 0.3 μm and 0.05 μm AI2O3 powder, the electrode is polished on a flannel with the aim of the glassy carbon to a mirror-like surface without scratches and the PTFE material wrapped around the glassy carbon to a very hydrophobic surface. Weigh 10 mg of catalyst to be tested, add to a mixture solution of 2.4 mL ultrapure water, 0.1 mL Nafion, 2.5 mL C3H8O and sonicate for 30 min to obtain a 2 mg mL−1 slurry of catalyst. 5 μL of slurry was added to the glassy carbon electrode using a pipette gun and allowed to dry naturally as a working electrode.2.6. Fuel cell measurements
The catalyst to be tested was sonicated and dispersed with Nafion solution in C3H8O under ice bath conditions. The catalyst suspension was then sprayed onto the PTFE film as the catalytic layer and subsequently hot-pressed onto both sides of the Nafion 115 membrane at 120 °C and 10 MPa maintained for 120 s. The outermost side used carbon cloth (H2315T10AC1 NOK, Japan) as the diffusion layer to form a membrane electrode (MEA) with an effective area of 2 × 2.5 cm2. The cell uses a homemade catalyst with a Pt loading of 1.2 mg cm−2 for the anode and a commercial Pt/C with a Pt loading of 1.2 mg cm−2 for the cathode, with a Nafion (5 wt%) solution content of 15 wt% and 10 wt% for the anode and cathode respectively. The cell operating temperature was set at 60 °C, with 2 mol L−1 C2H5OH passed through the anode at a flow rate of 1.5 sccm and O2 passed through the cathode at a flow rate of 400 sccm.3. Results and discussion
3.1. Physical characterization
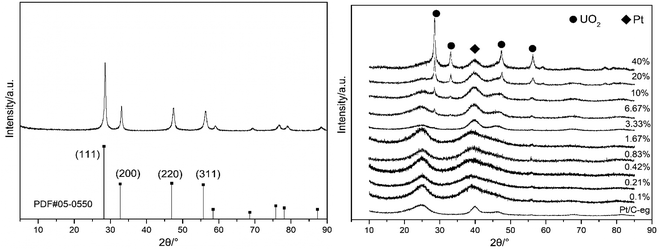
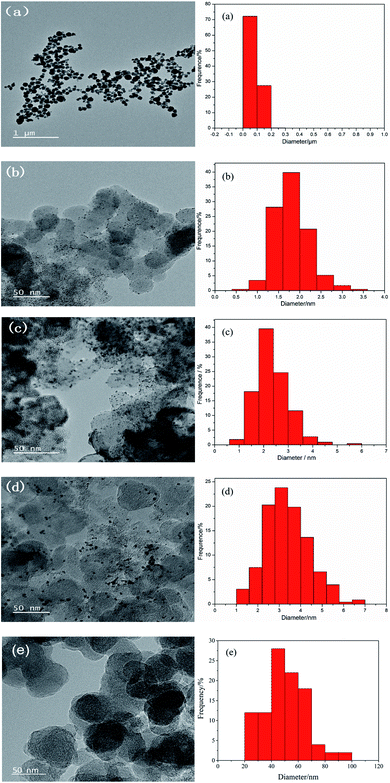
Fig. 1 is an X-ray diffraction pattern of the prepared material. Fig. 1(a) is an XRD pattern of UO2 prepared by hydrothermal method with the peak position and relative intensity of the diffraction peaks corresponding to the UO2 standard PDF card 05-0550. Fig. 1(b) shows the XRD patterns of the 11 catalysts, the diffraction peaks at 28° and 32° correspond to the (111) and (200) crystal planes of UO2 and the diffraction peak at 39° corresponds to the (111) crystal plane of Pt. The XRD patterns indicate that UO2 and Pt have been loaded onto the carbon. The general trend is that as the content of UO2 increases, the UO2 peak becomes stronger and the Pt peak remains more or less constant.The TEM image and the particle distribution of the prepared materials are shown in Fig. 2. Fig. 2(a) shows the TEM image and the particle distribution of the UO2 which reveals that UO2 particles prepared have good dispersion and relatively uniform particle size with an average particle size of 80 nm. Fig. 2(e) shows the TEM image and the particle distribution of the bare carbon, the average size of carbon particles is 50.0 nm. Fig. 2(b–d) shows the TEM images and the U particle size distribution of the of the Pt–10% UO2/C, Pt–40% UO2/C and Pt/C-eg. Based on the particle distribution, the average particle sizes are 1.80 nm, 2.35 nm and 3.38 nm in that order.
As shown in the figure, the Pt–10% UO2/C catalyst has a more homogeneous particle size and better dispersion, and the Pt–40% UO2/C catalyst has poorer dispersion and increased agglomeration due to the increased number of particles loaded on the carbon.
After dissolving Pt and UO2 with aqua regia digested catalyst, the contents of Pt and U in the solution were determined by ICP-MS. The results (RSD < 2%) are shown in Table 1, the actual loading of Pt and UO2 on carbon in the catalyst is close to the theoretical values.
| Catalysts | Pt | UO2 |
|---|---|---|
| 20% Pt–40% UO2/C | 18.5% | 42.6% |
| 20% Pt–20% UO2/C | 18.6% | 18.4% |
| 20% Pt–10% UO2/C | 19.0% | 11.2% |
| 20% Pt–6.67% UO2/C | 19.2% | 6.1% |
| 20% Pt–3.33% UO2/C | 18.7% | 2.9% |
| 20% Pt–1.67% UO2/C | 17.9% | 1.2% |
| 20% Pt–0.83% UO2/C | 17.6% | 0.7% |
| 20% Pt–0.42% UO2/C | 18.0% | 0.3% |
| 20% Pt–0.21% UO2/C | 18.6% | 0.1% |
| 20% Pt–0.1% UO2/C | 18.6% | 0.07% |
| 20% Pt/C-eg | 18.0% | 0 |
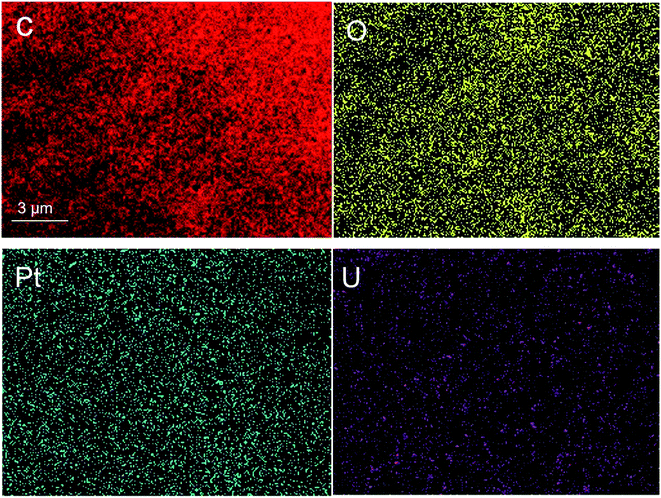
The EDS analysis of surface distribution as shown in Fig. 3 clarified that both Pt and UO2 are successfully loaded on the carbon carrier and well dispersed.
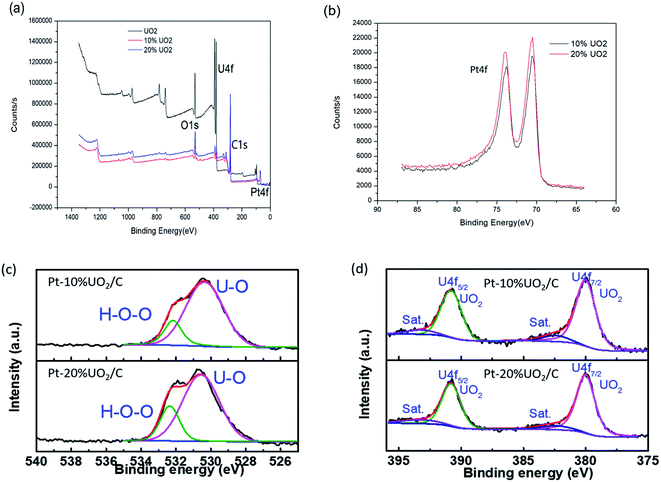
Fig. 4 is an XPS image of the prepared materials. As shown in the Fig. 4(a), the presence of Pt, C, O and U in the Pt–10% UO2/C and Pt–20% UO2/C catalyst are confirmed. The binding energy peaks of O, U, C, and Pt elements given by XPS spectra are shown in Table 2. The C 1s have one peak located at 288.3 eV. The Pt line showed two peaks located at 70.5 eV and 73.8 eV (Fig. 4(b)) are identical to Pt 4f spectra. According to the literature,41 the Pt 4f7/2 and Pt 4f5/2 orbital binding energies of pure Pt species are 71.0 and 74.3 respectively. The Pt 4f orbital binding energies of Pt–10% UO2/C and Pt–20% UO2/C catalysts are reduced by 0.5 eV compared pure Pt. The analysis reason is that there is a strong electronic interaction between the Pt and UO2 nanoparticles, Pt gets electrons and the electron cloud density increases with the addition of UO2. Fig. 4(c) shows the O 1s have apparently two peaks assigned to the oxygen atoms strongly bonded to U and the oxygen in H2O adsorbed on the surface, respectively.42 Based on Table 2, the U 4f7/2 and U 4f5/2 orbital binding energy of Pt–10% UO2/C (Pt–20% UO2/C) materials located at 381.0 (381.2) eV and 391.8 (391.9) eV. According to the literature,43,44 the materials assigning to U4+ species. And Fig. 4(d) deconvolution of the U 4f XPS peaks for Pt–10% UO2/C and Pt–20% UO2/C have also show that only UO2 phase existed in the prepared materials.
| Sample | Binding energy (eV) | ||||||
|---|---|---|---|---|---|---|---|
| O 1S | O 1Sa | U 4f7/2 | U 4f5/2 | C 1s | Pt 4f7/2 | Pt 4f5/2 | |
| UO2 | 530.9 | 381.4 | 392.3 | ||||
| 10% UO2 | 531.4 | 532.7 | 381.0 | 391.8 | 288.3 | 70.5 | 73.8 |
| 20% UO2 | 531.8 | 532.9 | 381.2 | 391.9 | 288.3 | 70.5 | 73.8 |
3.2. Catalytic performance for ethanol oxidation reaction (EOR)
Fig. 5 shows the CV curves of the 11 catalysts in a mixture of 0.5 mol L−1 H2SO4 and 0.5 mol L−1 C2H5OH solution. It can be seen that when the mass fraction of Pt is 20% and the mass fraction of UO2 is 10%, the ethanol oxidation peak current density of Pt–10% UO2/C catalyst is 7.47 mA cm−2, which has the best catalytic activity and is significantly better than Pt/C-eg (3.98 mA cm−2). This suggests that the modification of Pt/C catalyst by UO2 is effective and that the increase in catalytic activity is likely to be attributed to the synergistic effect of Pt and U. It can also be found that the catalytic activity of Pt–0.1% UO2/C is enhanced relative to Pt/C-eg when the mass fraction of UO2 is 0.1%. As the mass fraction of UO2 in the catalyst continues to increase, the catalytic activity also increases. When the mass fraction of UO2 in the catalyst exceeds 10%, the catalytic activity gradually decreases, mainly because UO2 affects the conductivity of the catalyst. It is also possible that the dispersion of the Pt particles is affected by the excessive number of particles loaded on the carbon.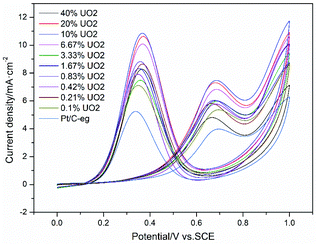 | ||
| Fig. 5 CV curves of ethanol oxidation on catalyst systems in a mixture of 0.5 mol L−1 H2SO4 + 0.5 mol L−1 C2H5OH solution at 25 °C at a scan rate of 50 mV s−1. | ||
To evaluate the durability of the catalysts, 11 catalysts were scanned for 1000 laps CV curves in a mixture solution of 0.5 mol L−1 H2SO4 and 0.5 mol L−1 C2H5OH. Table 3 shows the peak current density of ethanol oxidation per 200 cycles of the catalysts and the durability of the catalyst based on the retention rate of catalytic activity at the 1000th cycles. It can be found that after scanning the CV curve for 1000 cycles, the activity of all catalysts decayed, with Pt–10% UO2/C retaining 57.1% of its catalytic activity, an increase of 13.2% compared to Pt/C-eg (43.9%), indicating the superior durability of the catalyst Pt–10% UO2/C.
| Catalysts | 1st current density/mA cm−2 | 200th current density/mA cm−2 | 400th current density/mA cm−2 | 600th current density/mA cm−2 | 800th current density/mA cm−2 | 1000th current density/mA cm−2 |
|---|---|---|---|---|---|---|
| Pt–40% UO2/C | 4.81(100%) | 4.02(83.5%) | 3.38(70.2%) | 2.91(60.4%) | 2.48(51.5%) | 2.02(41.9%) |
| Pt–20% UO2/C | 7.31(100%) | 5.67(77.5%) | 4.74(64.8%) | 4.20(57.4%) | 3.62(49.5%) | 3.45(47.1%) |
| Pt–10% UO2/C | 7.47(100%) | 6.68(89.4%) | 5.62(75.2%) | 5.98(80.0%) | 4.91(65.7%) | 4.27(57.1%) |
| Pt–6.67% UO2/C | 6.83(100%) | 5.33(78.0%) | 4.46(65.3%) | 4.23(61.9%) | 3.62(53.0%) | 3.45(50.5%) |
| Pt–3.33% UO2/C | 5.97(100%) | 5.26(88.1%) | 4.48(75.0%) | 3.47(58.1%) | 3.01(50.4%) | 2.74(45.8%) |
| Pt–1.67% UO2/C | 6.01(100%) | 4.97(82.6%) | 4.22(70.2%) | 3.30(54.9%) | 2.89(48.0%) | 2.67(44.4%) |
| Pt–0.83% UO2/C | 6.05(100%) | 5.26(86.9%) | 4.48(74.0%) | 3.72(61.4%) | 2.91(48.0%) | 2.53(41.8%) |
| Pt–0.42% UO2/C | 5.77(100%) | 4.97(86.1%) | 4.43(76.7%) | 3.54(61.3%) | 2.74(47.4%) | 2.25(38.9%) |
| Pt–0.21% UO2/C | 5.81(100%) | 4.58(78.8%) | 3.59(61.7%) | 2.67(45.9%) | 2.41(41.4%) | 1.91(32.8%) |
| Pt–0.1% UO2/C | 5.36(100%) | 4.48(83.5%) | 3.66(68.2%) | 2.87(53.5%) | 2.62(48.8%) | 2.01(37.5%) |
| Pt/C-eg | 3.98(100%) | 3.54(88.9%) | 3.27(82.1%) | 2.63(66.0%) | 2.21(55.5%) | 1.75(43.9%) |
To investigate the cause of the decrease in catalytic activity after scanning 1000 cycles CV, the catalysts were characterized by TEM on three working electrodes Pt–10% UO2/C (Fig. 6(a)), Pt–40% UO2/C (Fig. 6(b)) and Pt/C-eg (Fig. 6(c)). It can be found that after scanning 1000 cycles CV, the average particle size changes from 1.8 nm to 3.02 nm for Pt–10% UO2/C, from 2.35 nm to 3.28 nm for Pt–40% UO2/C and from 3.38 nm to 6.04 nm for Pt/C-eg. The average size of the particles loaded on three catalysts became larger, most likely due to the loss and agglomeration of small size particles. It is therefore speculated that the reduced catalyst activity may be due to the soaking and corrosion of the carbon in the acidic electrolyte, which affects the support strength of the carbon, causing migration, loss and agglomeration of small particles of Pt and UO2.
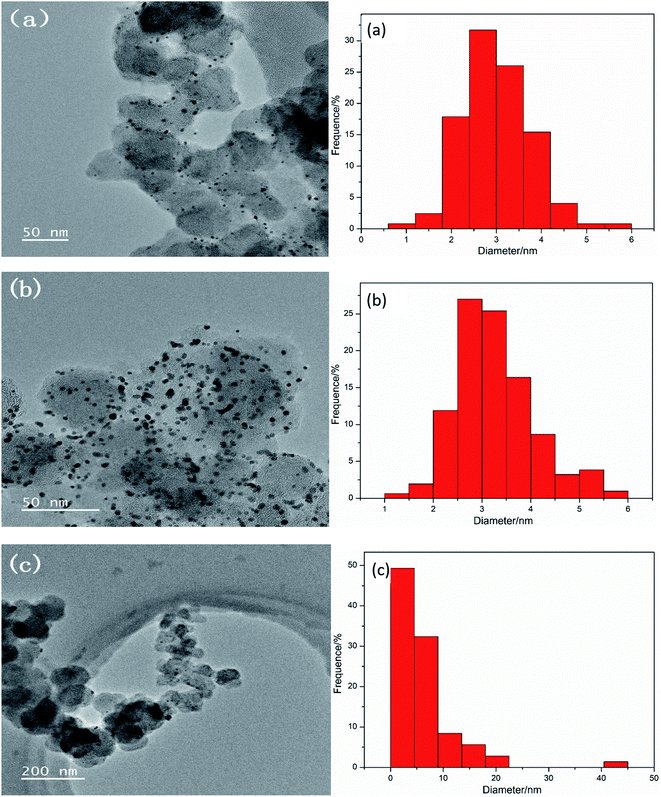 | ||
| Fig. 6 TEM micrographs and the U particle size distribution of the synthesized catalysts (a) Pt–10% UO2/C, (b) Pt–40% UO2/C and (c) Pt/C-eg, respectively. | ||
Fig. 7 shows the i–t curves of 11 catalysts in a mixture solution of 0.5 mol L−1 H2SO4 and 0.5 mol L−1 C2H5OH at a constant potential of 0.6 V (vs. SCE). The current curve drops sharply at the beginning because the intermediate product CO poisons the catalyst and reduces the catalytic activity. However, due to the detoxification effect of UO2, the adsorption and desorption of CO on the Pt surface gradually tends to dynamic equilibrium, so the current curves also gradually tends to level off. After 3000 s of testing, the stable current density of Pt–10% UO2/C was 1.73 mA cm−2, which was significantly higher than Pt/C-eg (0.70 mA cm−2), indicating that Pt–10% UO2/C has better resistance to poisoning than Pt/C-eg. There are two speculations as to why the addition of UO2 improves the resistance of Pt/C catalyst to poisoning: firstly, UO2 has a face-centered cubic structure and can store up to 10% extra oxygen in the lattice space without changing the crystal structure. When the catalyst is poisoned, UO2 releases the O2 stored in the lattice space and oxidatively desorbs CO, improving the catalyst's resistance to poisoning. Secondly, 235U releases α particles irradiates water to produce a large amount of strongly oxidizing hydroxyl radicals OH, which oxidize the CO adsorbed on Pt surface, expose the active site of Pt and promote further dissociation of ethanol. Therefore, we call Pt–xUO2/C catalyst as self activated catalyst.
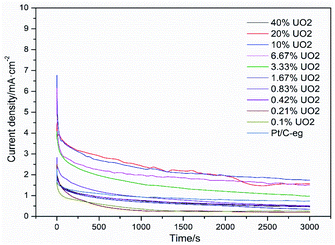 | ||
| Fig. 7 Amperometric i–t curves of ethanol oxidation on catalyst systems in a mixture of 0.5 mol L−1 H2SO4 + 0.5 mol L−1 C2H5OH solution at 25 °C at 0.6 V (vs. SCE) for 3000 s. | ||
3.3. Single cell performance
To further investigate the modification effect of UO2 on Pt/C catalyst, Pt–10% UO2/C and Pt/C-eg were selected as anode catalysts and single cells were assembled to test the cell V–i polarization curves. Fig. 8 shows the V–i polarization curves and power density curves for the two catalysts. During the generation of electricity, the cell undergoes activation polarization, ohmic polarization and dense differential polarization, producing a voltage drop. The cell V–i curves reveal that the polarization of Pt/C-eg is more serious. Comparing the power density curves of the two catalysts, it can be found that the maximum power density of Pt–10% UO2/C is 28.53 mW cm−2, which is higher than Pt/C-eg (21.36 mW cm−2), so the single cell performance of Pt–10% UO2/C is better. The superior catalytic activity and resistance to poisoning of Pt–10% UO2/C compared to Pt/C-eg is the main reason for its better single-cell performance.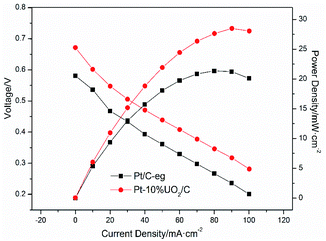 | ||
| Fig. 8 Cell voltage and power density as a function of current density for the single cell with Pt–10% UO2/C catalyst (anode) and Pt/C-eg catalyst (anode) operating at 60 °C. | ||
4. Conclusions
In order to solve the problems of low activity and poor ability to resist CO poisoning of Pt/C anode catalysts in DEFC, we introduced the radioactive material UO2 prepared by hydrothermal method into Pt/C catalyst for the first time. XRD, TEM, EDS, XPS and ICP-MS characterization revealed that Pt and UO2 were successfully loaded on the carbon carrier and evenly distributed, while with the continuous increase of U loading amount, the catalyst will be poor dispersion and increased agglomeration due to the increased number of particles loaded on the carbon.The catalyst performance was determined by electrochemical workstation equipped with three electrodes. It was indicated by the results that the addition of UO2 significantly improved the catalytic activity, durability and resistance to CO poisoning of the Pt/C catalysts. Moreover, the Pt–10% UO2/C giving the best catalytic performance which is significantly improved compared with Pt/C-eg. The increases mentioned above are partly due to the synergistic effect of Pt and U. In addition, Pt–xUO2/C is a self-reactivated catalyst, the increased resistance to poisoning may be due to two factors: firstly, the face-centered cubic structure of UO2 can store up to 10% extra oxygen in the lattice space without changing the crystal structure. When the catalyst is poisoned, UO2 releases the O2 stored in the lattice space and oxidatively desorbs CO, improving the catalyst's resistance to poisoning. Secondly, 235U releases α particles irradiates water to generate radiolysis product OH (H2O + *α → OHα + H+ + e−), which rapidly removes COads (Pt–COads + OHα → Pt + CO2 + H+ + e−) and releases the active site of Pt to solve the poisoning problem.
The single cell tests revealed that the polarization of Pt/C-eg was more severe than Pt–10% UO2/C, further confirming the stronger catalytic activity and resistance to poisoning of the Pt–xUO2/C catalyst compared to Pt/C-eg.
Conflicts of interest
There are no conflicts to declare.Acknowledgements
The authors gratefully acknowledge the financial support for this project provided by the National Natural Science Foundation of China.References
- A. G. Olabi, Energy, 2012, 39(1), 2–5 CrossRef.
- P. A. Owusu and S. Asumadu-Sarkodie, Cogent Eng., 2016, 3(1), 1167990 CrossRef.
- N. L. Panwar, S. C. Kaushik and S. Kothari, Renewable Sustainable Energy Rev., 2011, 15(3), 1513–1524 CrossRef.
- L. R. Lynd and C. H. de Brito Cruz, Science, 2010, 330, 1176–1177 CrossRef CAS PubMed.
- O. Z. Sharaf and M. F. Orhan, Renewable Sustainable Energy Rev., 2014, 32, 810–853 CrossRef CAS.
- U. Lucia, Renewable Sustainable Energy Rev., 2014, 30, 164–169 CrossRef CAS.
- P. I. de Souza, S. L. Queiroz, K. Bergamaski, E. R. Gonzalez and F. C. Nart, J. Phys. Chem. B, 2002, 106(38), 9825–9830 CrossRef.
- S. C. S. Lai, S. E. F. Kleyn, V. Rosca and M. T. M. Koper, J. Phys. Chem. C, 2008, 112, 19080–19087 CrossRef CAS.
- S. C. S. Lai and M. T. M. Koper, Phys. Chem. Chem. Phys., 2009, 11, 10446–10456 RSC.
- C. Lamy, E. M. Belgsir and J. M. Leger, J. Appl. Electrochem., 2001, 31, 799–809 CrossRef CAS.
- F. Vigier, C. Coutanceau, F. Hahn, E. M. Belgsir and C. Lamy, J. Electroanal. Chem., 2004, 563(1), 81–89 CrossRef CAS.
- P. Wnuk and L. Adam, Electrochim. Acta, 2020, 330, 135256 CrossRef CAS.
- J. Seweryn and A. Lewera, Appl. Catal., B, 2014, 144, 129–134 CrossRef CAS.
- R. B. Kutz, B. Braunschweig, P. Mukherjee, D. Dlott and A. Wieckowski, J. Phys. Chem. Lett., 2011, 2, 2236–2240 CrossRef CAS.
- F. M. Souza, J. Nandenha, B. L. Batista, V. H. A. Oliveira, V. S. Pinheiro, L. S. Parreira, A. O. Neto and M. C. Santos, Int. J. Hydrogen Energy, 2018, 43, 4505–4516 CrossRef CAS.
- L. Jiang, A. Hsu, D. Chu and R. Chen, Int. J. Hydrogen Energy, 2010, 35, 365–372 CrossRef CAS.
- S. Samad, K. S. Loh, W. Y. Wong, T. K. Lee, J. Sunarso, S. T. Chong and W. R. W. Daud, Int. J. Hydrogen Energy, 2018, 43, 7823–7854 CrossRef CAS.
- Z. Zakaria, S. K. Kamarudin and S. N. Timmiati, Membranes for direct ethanol fuel cells: An overview[J], Appl. Energy, 2016, 163, 334–342 CrossRef CAS.
- V. B. Oliveira, J. P. Pereira and A. M. F. R. Pinto, Energy, 2017, 133, 652–665 CrossRef CAS.
- M. A. F. Akhairi and S. K. Kamarudin, Int. J. Hydrogen Energy, 2016, 41, 4214–4228 CrossRef CAS.
- Y. Wang, D. F. Ruiz Diaz, K. S. Chen, Z. Wang and X. C. Adroher, Mater. Today, 2020, 32, 178–203 CrossRef CAS.
- A. Arshad, H. Ali, A. Habib and M. A. Bashir, Therm. Sci. Eng. Prog., 2019, 9, 308–321 CrossRef.
- R. Ali and A. Pasha, IOP Conf. Ser.: Mater. Sci. Eng., 2018, 376, 012103 Search PubMed.
- M. Watanabe and S. Motoo, J. Electroanal. Chem. Interfacial Electrochem., 1975, 60, 275–283 CrossRef CAS.
- M. J. Paulo, R. H. D. Venancio, R. G. Freitas, E. C. Pereira and A. C. Tavares, J. Electroanal. Chem., 2019, 840, 367–375 CrossRef CAS.
- Y. Qu, Y. Gao, L. Wang, J. Rao and G. Yin, Chemistry, 2016, 22, 193–198 CrossRef CAS.
- X. Wang, J. Zhang and H. Zhu, Chin. J. Catal., 2011, 32, 74–79 CrossRef CAS.
- Y. Bai, J. Wu, J. Xi, J. Wang, W. Zhu, L. Chen and X. Qiu, Electrochem. Commun., 2005, 7, 1087–1090 CrossRef CAS.
- H. Song, X. Qiu and F. Li, Appl. Catal., A, 2009, 364, 1–7 CrossRef CAS.
- V. Raghuveer and B. Viswanathan, J. Power Sources, 2005, 144, 1–10 CrossRef CAS.
- D. Zhang, Z. Ma, G. Wang, K. Kongstantinov, X. Yuan and H. Liu, Electrochem. Solid-State Lett., 2006, 9, A423–A426 CrossRef CAS.
- J. E. Sulaiman, S. Zhu, Z. Xing, Q. Chang and M. Shao, ACS Catal., 2017, 7, 5134–5141 CrossRef CAS.
- C. T. Hsieh and J. Y. Lin, J. Power Sources, 2009, 188, 347–352 CrossRef CAS.
- G. Audi, O. Bersillon, J. Blachot and A. H. Wapstra, Nucl. Phys. A, 2003, 729, 3–128 CrossRef.
- P. W. W. Joseph, E. T. Bengt, C. Jonathan, K. Andrew and K. Nikolas, J. Phys. Chem. C, 2018, 122(13), 7149–7165 CrossRef.
- G. L. Gresham, A. K. Gianotto, P. D. B. Harrington, L. B. Cao, J. R. Scott, J. E. Olson, A. D. Appelhans, M. J. V. Stipdonk and G. S. Groenewold, J. Phys. Chem. A, 2003, 107, 8530–8538 CrossRef CAS.
- D. P. Steve, F. L. Adam, L. O. Tina, J. S. Patrick, B. W. Peter, E. H. Sarah, D. H. Ian, F. L. Darren and V. Ruddock, Chem. Commun., 1999, 8, 725–726 Search PubMed.
- Z. R. Ismagilov, S. V. Kuntsevich, N. V. Shikina, V. V. Kuznetsov, M. A. Kerzhentsev, V. A. Ushakov, V. A. Rogov, A. I. Boronin and V. I. Zaikovsky, Catal. Today, 2010, 157, 217–222 CrossRef CAS.
- D. Gao, Z. Zhang, L. Ding, Y. Juan and L. Yan, Nano Res., 2015, 8, 546–553 CrossRef CAS.
- L. Ding, Z. Zheyao and L. Yan, Sci. China Mater., 2017, 60, 399–406 CrossRef CAS.
- L. Renxuan, I. Hakim, F. Qinbai, H. Gouyan, B. Aili, L. L. Kevin, E. S. Smotkin, Y. E. Sung, H. Kim, S. Thomas and A. Wieckowski, J. Phys. Chem. B, 2000, 104, 3518–3531 CrossRef.
- Y. Y. Dong, W. P. Liao and Z. H. Suo, Fuel Process. Technol., 2015, 137, 164–169 CrossRef CAS.
- S. D. Senanayake, G. I. N. Waterhouse, A. S. Y. Chan, T. E. Madey, D. R. Mullins and H. Idriss, Catal. Today, 2007, 120, 151–157 CrossRef CAS.
- Y. A. Teterin, K. I. Maslakov, M. V. Ryzhkov, O. A. Traparic, L. Vukvcevic, A. Y. Teterin and A. D. Panov, Radiochemistry, 2005, 47, 215–224 CrossRef CAS.
| This journal is © The Royal Society of Chemistry 2022 |

