
 Open Access Article
 This Open Access Article is licensed under a Creative Commons Attribution-Non Commercial 3.0 Unported Licence
Decisive structural elements in water and ion permeation through mechanosensitive channels of large conductance: insights from molecular dynamics simulation†
Vahid Fadaei Naeini a,
Majid Baniassadi*bc,
Masumeh Foroutan*d,
Yves Rémondc and
Daniel Georgec
a,
Majid Baniassadi*bc,
Masumeh Foroutan*d,
Yves Rémondc and
Daniel Georgec
aDivision of Machine Elements, Luleå University of Technology, 97187 Luleå, Sweden. E-mail: m.baniassadi@ut.ac.ir
bSchool of Mechanical Engineering, College of Engineering, University of Tehran, Tehran, Iran
cUniversity of Strasbourg, ICube Laboratory/CNRS, 2 Rue Boussingault, 67000 Strasbourg, France
dDepartment of Physical Chemistry, School of Chemistry, College of Science, University of Tehran, Tehran, Iran. E-mail: foroutan@khayam.ut.ac.ir
First published on 16th June 2022
Abstract
In this paper, a series of equilibrium molecular dynamics simulations (EMD), steered molecular dynamics (SMD), and computational electrophysiology methods are carried out to explore water and ion permeation through mechanosensitive channels of large conductance (MscL). This research aims to identify the pore-lining side chains of the channel in different conformations of MscL homologs by analyzing the pore size. The distribution of permeating water dipole angles through the pore domains enclosed by VAL21 and GLU104 demonstrated that water molecules are oriented toward the charged oxygen headgroups of GLU104 from their hydrogen atoms to retain this interaction in a stabilized fashion. Although, this behavior was not perceived for VAL21. Numerical assessments of the secondary structure clarified that, during the ion permeation, in addition to the secondary structure alterations, the structure of Tb-MscL would also undergo significant conformational changes. It was elucidated that VAL21, GLU104, and water molecules accomplish a fundamental task in ion permeation. The mentioned residues hinder ion permeation so that the pulling SMD force is increased remarkably when the ions permeate through the domains enclosed by VAL21 and GLU102. The hydration level and potassium diffusivity in the hydrophobic gate of the transmembrane domain were promoted by applying the external electric field. Furthermore, the implementation of an external electric field altered the distribution pattern for potassium ions in the system while intensifying the accumulation of Cl− in the vicinity of ARG11 and ARG98.
1. Introduction
Transporting ions and water molecules through the transmembrane domain in a cell is considered one of the processes that the proper functioning of cells depends on entirely.1–5 Ion permeation through the transmembrane proteins is a method for ion transport across the membrane. Mechanosensitive (MS) channels are pervasive membrane proteins in prokaryotic and eukaryotic cell membranes, and their gating function results in some conformational changes to reach the open and closed states in response to mechanical stimuli such as tension, shear, and pressure.6 These proteins play a pivotal role in physiological processes such as sense of touch, hearing, and regulation of blood pressure as transducers of mechanical stimulations into an electrical signal.7–12 Understanding the nature of mechanotransduction at the atomic level provides a more comprehensive insight into improving therapeutic plans.Besides adjusting the cell volume, water permeation through transmembrane plays an essential role in the cell migration mechanism.13–15 Molecular dynamics (MD) simulation is a numerical method providing a descriptive viewpoint for the role of the structural components of membrane proteins in the gating process. Beckstein et al. have performed a numerical study about the energy barriers for permeation in nanopores using the potential of mean force ions and drew a comparison between MD simulation results and continuum-electrostatic calculations.16 They found that the continuum-electrostatic model does not consider the role of water molecules in the pore, thereby cannot represent this barrier properly. MD simulation was used to determine the different molecular structures of the MscL during the gating process.17 MD simulations have been implemented on Mycobacterium tuberculosis of bacterial MscL (Tb-MscL) embedded in a bilayer membrane and of its helical bundle alone in the solvent.18 It was found that the spatial structure of the helix bundle is not stable at physiological pH, while this behavior is stabilized by decreasing the pH condition. The gating function of MS channels is also investigated in the presence of a membrane, and it was found that the flattening of the transmembrane helices leads to a significant increase in pore radius.19 Moreover, the crucial role of water molecules as a facilitating agent in ion permeation is investigated. The potent structural elements of the protein in the gating process are identified by applying force to the protein structure. The threshold value of the force that makes the channel open and causes a significant change in the channel diameter and conductance was evaluated by MD simulations.20,21 Similar to this study, Gullingsrud et al. assessed the effects of the lateral tension of the membrane on the channel opening state.22 Jonggu et al. utilized the MD simulations to find the reciprocal impacts of membrane and protein on each other during the gating function.23 Based on their observations, the opening of the channel may be ascribed to applying an explicit lateral bias force to each of the five subunits of MscL in the radially outward direction. Additionally, MD simulations were employed to describe the interplay of the main structural segments of the channel during the opening.24,25
In a theoretical study, Haselwandter et al. explored the effects of the shape of membrane proteins, including the oligomeric state of the protein, on free energy alterations.26 It was demonstrated that the lateral pressure across the membrane has no observable role as a stimulation factor in gating function, while the membrane tension plays a crucial role in gating.27
Membrane–protein interaction gives a new insight into the reciprocal effects of the lipid chains on the opening mechanism of the channel.28 MD simulation can indicate how the interaction between the membrane and MS channel affects the gating function of the channel under varying conditions. Elmore et al. investigated the effects of the lipid composition at a molecular level.29 They found that different headgroups of the lipids result in structural changes in the C-terminal domain of Tb-MscL and result in notable alterations in protein–lipid interaction. The thinning procedure was studied for a membrane surrounding an E. coli-MscL structure.30 Based on this study, thinning the membrane allows speeding up the structural changes in MscL. Furthermore, MD simulation is utilized to evaluate the efficacy of the distribution of lateral pressure profiles on different lipid compositions.31
Apart from molecular dynamics simulations, experimental techniques and theoretical analysis give clues for a more advantageous perception of hydrophobic interactions in a membrane protein. Wiggins et al. presented theoretical relations for the free energy of the inclusion–bilayer system.32 They utilized deformation energy relations for a continuum environment to derive analytical relations for the free energy of the system during various membrane deformation scenarios. Developed experimental techniques such as quantitative fluorescence microscopy and quantitative Western blots give insight into the mean number of MscL per cell and the variable distribution of these channels in membrane from cell to cell.33 A single-cell-based assay technique studied the influence of osmotic downshock on the physiology of mechanosensitive channels and cell lysis.34 Furthermore, the inhibition process of mechanosensitive channels by AlexaFluor molecule or a peptide such as GsmTx4 is investigated based on MD simulation or experimental techniques.35,36 In recent years, reconstruction of transport cycle in membrane transporters has been performed by free energy calculations and non-equilibrium work analysis to choose the most preferred pathways for conformational changes in some of the membrane transporters.37,38 According to the preceding studies, it seems that despite previously remarkable efforts, the determinant role of structural agents in the MscL pore is scarcely investigated that will be addressed in the present work. In this research, the authors seek to examine the underlying points of structural changes in the pore-lining side chains in the closed configuration of the channel to permeate different single ions. The steered molecular dynamics (SMD) technique has been utilized in ref. 39–44 to investigate structural determinants in pore-lining side chains of membrane proteins in the closed/inactive state. By implementing the SMD technique, mechanical forces are applied to part of the system, e.g., the substrate, to drive it along a predefined direction. Commonly implemented using a constant force or a constant velocity, this method is beneficial for exploring possible permeation pathways through a membrane protein. In SMD simulation, a vertical bias force is applied to the chloride and potassium ions separately to pull them through the interior pore of a mechanosensitive channel with an almost constant velocity. Finally, we determine whether the application of an external electric field (even several times higher than the normal range) could lead to conformational changes in the MscL channel, that normally is activated by a mechanical stimulus, in such a way that affect the permeability of water and ions, and change the configuration to open/semi-activated state. It was previously demonstrated that besides protein dipoles, pore hydration can be influenced by electric fields in both wild type MscL and its V23T mutant.45 The effects of an external electric field on the electrostatic potential of the system, distribution of water and ions in the pore, and the density of ions in the system will be discussed in this stage.
2. Materials and methods
In this section, further details about the system specifications, equilibrium, and non-equilibrium simulations are provided, and then the pore-lining side chains in the interior pore of the channel are introduced.2.1. Structural analysis of Tb-MscL and modeling procedure
Mechanosensitive channels are structurally composed of small subunits with the approximate molecular weight of 15 kDa,46 that, based on cross-linking observations and electron microscopy studies,47–49 are oriented in space in a specific fashion as a homopolymer. Continuing to verify MscL structure in E. coli, the homologs of the protein were discovered in more than 20 prokaryotic types.47,50 Tb-MscL as the homologous structure of E. coli-MscL with a homopentamer crystalline structure (Fig. S1†) composed of transmembrane and cytoplasmic regions.46 The height of Tb-MscL in the Z direction reaches ∼85 Å, and the transmembrane helix bundle along with cytoplasmic domains are about 50 Å and 35 Å in length, respectively (panels (c) and (d), Fig. S1†). The spatial structure of Tb-MscL, along with the constituent domains, is outlined in Fig. S1.† Each subunit in Tb-MscL, with a relatively uncomplicated folding structure, is correlated to the channel by the fivefold axis.The inner transmembrane helix (TM1: residue ID 15 to 43) is connected to the outer transmembrane helix (TM2: residue ID 69 to 89) by extracellular loops (residue ID 44 to 68). The outer transmembrane helix, extending from the extracellular side to the cytoplasmic domain, is connected to the cytoplasmic helix (H3: residue ID 69 to 89) by a cytoplasmic loop (residue ID 90 to 101). In Fig. S2,† the transmembrane view for the position of Tb-MscL in the membrane together with the sequence of the constructive residues of a subunit is illustrated.
The modeling process was initiated using the crystal structure of Tb-MscL obtained at a resolution of 3.5 Å from X-ray diffraction (PDB entry 2OAR).46 In the next step, a complete membrane patch was prepared. A patch of palmitoyl-oleoyl-phosphoethanolamine (POPE) membrane with the size of (126 × 126) Å2 was built by the membrane–builder plugin of VMD51 and used as the bilayer natural environment. The protein was embedded in the membrane patch and aligned with the membrane properly. The “z” axis is assumed to be the membrane normal. The positioning of the channel in the membrane was performed based on consistent patterns of the charged, polar, and nonpolar segments of the channel and the membrane. The alignment of the channel in the normal direction of the bilayer membrane is in agreement with the electron paramagnetic resonance findings.52 Subsequently, it was essential to take out the minimum number of the lipid and water molecules so that the protein does not overlap any lipid or water molecule. The system was then solvated using the SOLVATE command in VMD.51 A water box with the specified size of (117 × 117 × 153) Å3 in x, y, and z directions, respectively, was built to solvate the system, and the solvent atoms within 1.5 Å of the solute were removed from the system.
Furthermore, a specific ion concentration of 0.3 M KCl was created, and the system was neutralized and prepared for proper long-range electrostatic interactions. Finally, after all of the steps above, the simulation system contained ∼156![[thin space (1/6-em)]](https://www.rsc.org/images/entities/char_2009.gif) 000 atoms, including 35029 water molecules and 332 lipid headgroups. The final structures of the membrane–protein system are the input structures of the MD simulations. Fig. S4a† depicts the final configuration of the system of study and the sizes of different parts.
000 atoms, including 35029 water molecules and 332 lipid headgroups. The final structures of the membrane–protein system are the input structures of the MD simulations. Fig. S4a† depicts the final configuration of the system of study and the sizes of different parts.
2.2. MD simulation: assumptions and method of implementation
All simulations were carried out steadily using the parallel molecular dynamics program NAMD53 with a non-bonded cutoff of 12 Å. In each step, the simulation was performed using 1 fs timestep. Periodic cell dimensions were set up to (120 × 120 × 156) Å3 in x, y, and z directions, respectively. Langevin thermostat with the damping coefficient of 5 ps−1 was used to set the temperature of the system on the constant amount of 310 K. Moreover, the pressure of the system was controlled at a constant level of 1 bar using the Langevin piston.54 The piston period was set to 200 fs, with a decay time constant of 50 fs, and piston temperature of 310 K. It is worthwhile to mention that a CHARMM27 parameter file for lipids55,56 and CHARMM22 for proteins57,58 with NBFIX modification was used as the system force field. This modified force field contains the corrected parameters for non-bonded interaction between carbonyl oxygens and potassium ions. The particle mesh Ewald (PME) method was utilized for the full long-range electrostatic interactions,59 and the PME grid spacing was considered 1 Å. General holonomic constraints were imposed on the covalent bonds of hydrogen atoms using the SHAKE algorithm.60Molecular dynamics simulation was carried out in three general stages: equilibration of the system, steered molecular dynamics simulation (SMD) to permeate ions inside the pore, and non-equilibrium simulation under an external electric field. The equilibrium stage consists of four distinct steps. In the first step, the process of melting lipid tails was performed for 2 ns at 310 K by fixing all system components except the hydrophobic lipid tails. The implementation of this step minimizes the energy of the tails and results in a slight curvature disorder in hydrophilic sections of the lipid tails. In the second step of equilibrium simulation, minimization will be accompanied by an equilibrium state constraining the protein to relax the environment thermodynamically. In the third equilibrium step, the system will be further equilibrated by releasing the protein structure. In the last step of equilibrium simulation, a production run on this setup was performed to equilibrate the membrane protein structure to extract the equilibrium parameters of the system. As the first stage, more than 102 ns of equilibrium simulations were performed on the system.
The free energy profile of water can be evaluated as a function of longitudinal position of the molecules inside the pore during 102 ns using distribution of the water molecules. To calculate the free energy barrier for permeating water molecules, the Boltzmann equation for the free energy and the probability of the water molecules through the channel was utilized. It is worth mentioning that the longitudinal probability is proportional to the density of water along the pore. To evaluate the energy barrier for water through the pore, eqn (1) was utilized:61
 | (1) |
Before investing computer time in relatively lengthy free-energy calculations, SMD simulations will be used to gain a qualitative picture of the permeation pathway of the ions through the pore-lining residues of the channel. Hence, after extracting the equilibrium data and ensuring the equilibrium of the system, the steered molecular dynamics process is used to evaluate the ion permeation in the MscL channel numerically. In this case, the ion on the extracellular side of the channel will be pulled toward the cytoplasmic side at a constant velocity. As the forces imposed are usually orders of magnitude greater than would be experienced in a living system, the interpretation of the results is often limited to a qualitative description of the possible behavior of the substrate and protein. The equilibrated configuration of the system is used as the input structure for the steered simulation stage. A potassium and chloride ion in the system were placed and fixed individually in the extracellular part and central cavity axis during the equilibrium simulation. The K+ and Cl− were fixed on the extracellular side of the channel in equilibrium simulation will be pulled individually toward the cytoplasmic side at a constant velocity of 0.002 Å ps−1 and spring constant k = 1 kcal mol−1 Å−2. The pulling velocity of the ions toward the pore was considered to be as low as possible to make the physiological conditions of permeation more realistic. Fig. S3b† illustrates the simulation setup for the SMD simulation to pull the ion toward the cavity.
As the last stage of the simulations, an external electric field E = 0.1463 kcal mol−1 Å−1 e−1 is applied to the equilibrated structure of the system. According to the dimensions of the system along the Z-axis, the external electric field can be applied by an approximate electric potential gradient of 800 mV across the membrane. The mentioned voltage is more than eight times the ordinary voltage gradient in physiological conditions of a vast majority of ion channels, and in so doing, the impact of a strong electric field on ion permeation through the closed configuration of the channel is detected. The simulation was carried out in the NVT ensemble in this stage. Moreover, in Table 1, all simulation steps and the simulation time for each step are briefly presented. The equilibrium and SMD procedures were repeated three times separately to enhance the primary form of analysis robustness and ensure convergence.
| Stage | Step description | Simulation time (ns) |
|---|---|---|
| (1) Equilibrium simulation | (a1) Shortening (melting) of the lipid tails (lipid tail minimization) | 2 |
| (b1) Minimization and equilibration with protein constrained | 2 | |
| (c1) Equilibration with protein released | 2 | |
| (d1) Production run | 100 | |
| (2) Steered MD simulation | (a2) Pulling the potassium ion with constant velocity | 32 |
| (b2) Pulling the chloride ion with constant velocity | 32 | |
| (3) Non-eqSrium simulation by inducing voltage gradient | (a3) Applying external electric field | 15 |
3. Results and discussion
In this section, three types of analysis on the water and ion permeation results through the channel will be provided.3.1. Remarks on pore-lining residues of MscL homologs
Dimensions of the interior pore are calculated using the molecular structure of the E. coli-MscL in open, extended, and closed conformations of E. coli-MscL derived from the results of the research conducted in ref. 24 and 62. More details about the shape and pore size of E. coli-MscL are described in Section S2.† Fig. 1 illustrates the most critical pore-lining residues of Tb-MscL together with their type and position in the interior pore of the channel. Based on Fig. 1, it is clear that, compared to the closed configuration of E. coli-MscL in Fig. S2,† the Tb-MscL structure has a completely tight region for a water molecule to permeate. This section has been completely blocked in the initial structure due to the steric constraints caused by acid and charged side chains GLU104. As illustrated in Fig. 1, the interior pore of the channel includes polar, non-polar, basic, and acidic side chains from top to bottom. Since the principal part of the transmembrane region is formed by non-polar segments, the water molecules do not aggregate. As perceptible in panels (a) and (b) of Fig. 1, three side chains that operate as filters possibly have more vital molecular interaction with the ions, including the non-polar side chain VAL21, the acidic side chain Glu104, and the polar side chain THR115. It will be pointed out in Section 3.4 that VAL21 side chains interact selectively with permeating ions based on the electrostatic interaction with oppositely charged ions. The narrowest gate of the channel in the undeformed structure of the protein corresponds to the gating domain of GLU104. The THR115 side chain in the cytoplasmic domain is considered a nucleophilic side chain, and given this premise, THR115 will have a remarkable physical interaction with the positively charged ion naturally. The SMD force required for ion permeation through the different side chains reveals the effectuality and performance of each side chain on oppositely charged ions. | ||
| Fig. 1 (a) Graphical representation of the pore-lining side chains of Tb-MscL along with the solid surfaces depicting the spatial shape of the interior pore, (b) pore size along the z-axis for the closed structure of Tb-MscL. | ||
3.2. Equilibrium simulation of Tb-MscL
The root-mean-square-deviation (RMSD) of the backbone of Tb-MscL was calculated to examine the stability of Tb-MscL conformation in the bilayer environment. RMSD for the protein backbone resulting from the equilibrium simulation is displayed in Fig. S5a.† It can be deduced from Fig. S5a† that the protein structure was ordinarily equilibrated after 10 ns. Accordingly, the molecular configuration of the system after 32 ns equilibrium simulation can be used for starting non-equilibrium stages. A severe deviation was observed in some of the residues of Tb-MscL, including, but not limited to, ASN49 on segment1; PRO93 on segment2; and ILE39, THR40, PRO41, GLN110 on segment3. The residues with the maximum deviation concerning their initial structure were identified by the RMSD heatmap, as illustrated in Fig. S5b.† The common feature of the severely deviated residues is that they belong to the cytoplasmic and periplasmic loops of the protein. The weak interaction of the loop parts with the membrane results in a drastic deviation and, consequently forms hydrogen bonds with solvent molecules.3.3. Water molecules inside transmembrane cavity
One of the determinant parameters in discovering the function of membrane channels in a particular structural condition is to explore the water flow mechanism through the channel pore. It is noteworthy that the high permeability of water molecules in biological structures will allow them to penetrate the domains of the channels in which the presence of aqueous ions can be restricted spatially and make the gate filters of the channel wet in the intervals of simulation time. Dehydration factor depends on the size, type of pore-lining side chains (e.g., hydrophobic or hydrophilic), and the potential of the channel for conformational changes.63 Hence, the accumulation of water molecules in the transmembrane pore domain is not merely an indicator of the channel opening. In this section, firstly, by evaluating the distribution of water molecules and ions, the wettability of the transmembrane domain will be examined over the simulation time. The presence of water molecules in the adjacent regions of the two gating side chains (VAL21 and GLU104) will be discussed. Accordingly, the probability of the dipole moment angle of the permeating water molecules through the gating side chains is calculated to explore the difference existing between the molecular interactions of the water molecules and the side chains. Afterward, the cumulative distribution of water molecules within the transmembrane area is evaluated, and the energy barrier for the permeation of water molecules through the hydrophobic side chain VAL21 is obtained. Besides, the contour plot for the distribution of the density of water molecules in the YZ plane is presented in this section.Fig. 2 depicts the presence of water molecules together with chloride and potassium ions within the channel throughout the simulation time. It is inferred from Fig. 2 that the narrow hydrophobic region located in the transmembrane structure of the Tb-MscL channel prevents the permeation of water in most of the simulation intervals. Hydration occurs by forming an unstable single water chain in the narrow region of the transmembrane domain (e.g. [16–17] ns or [34–35] ns). Moreover, Cl− and K+ do not permeate or even accumulate in transmembrane areas. Accordingly, it is inferred that hydrophobic gating occurs in the narrow region enclosed by VAL21 side chains.
 | ||
| Fig. 2 Time evolution for positions of water molecules, Cl−, and K+ along the Z axis. Each water molecule is represented by a blue dot. Cl− and K+ are illustrated by green and red dots, respectively. The discontinuous white region around z ∼ 5 Å corresponds to the dewetted VAL21 domain of the pore. | ||
In order to evaluate the free energy barrier of water molecules permeating through the hydrophobic region formed by VAL21 side chains in the transmembrane domain, the cumulative number of water molecules throughout the 100 ns simulation is depicted in Fig. 3a. Accordingly, extreme subsidence in the number of water molecules in the narrow hydrophobic region is detected. As previously outlined by Sansom et al.,61 free energy alterations of water molecules as a function of their position inside the channel can be obtained using the water distribution in different regions. More details are presented in Section S8.† Free energy profile obtained from distributions of water molecules is displayed in the panel b of Fig. 3. It is concluded from Fig. 3b that in the transmembrane domain of the interior pore, the VAL21 side chain has the highest amount of the energy barrier for permeation of water molecules (about 4.5 kcal mol−1), and afterward, the free energy profile drops significantly. This drop implies that the water molecules accumulate in the adjacent regions of the cytoplasmic loops.
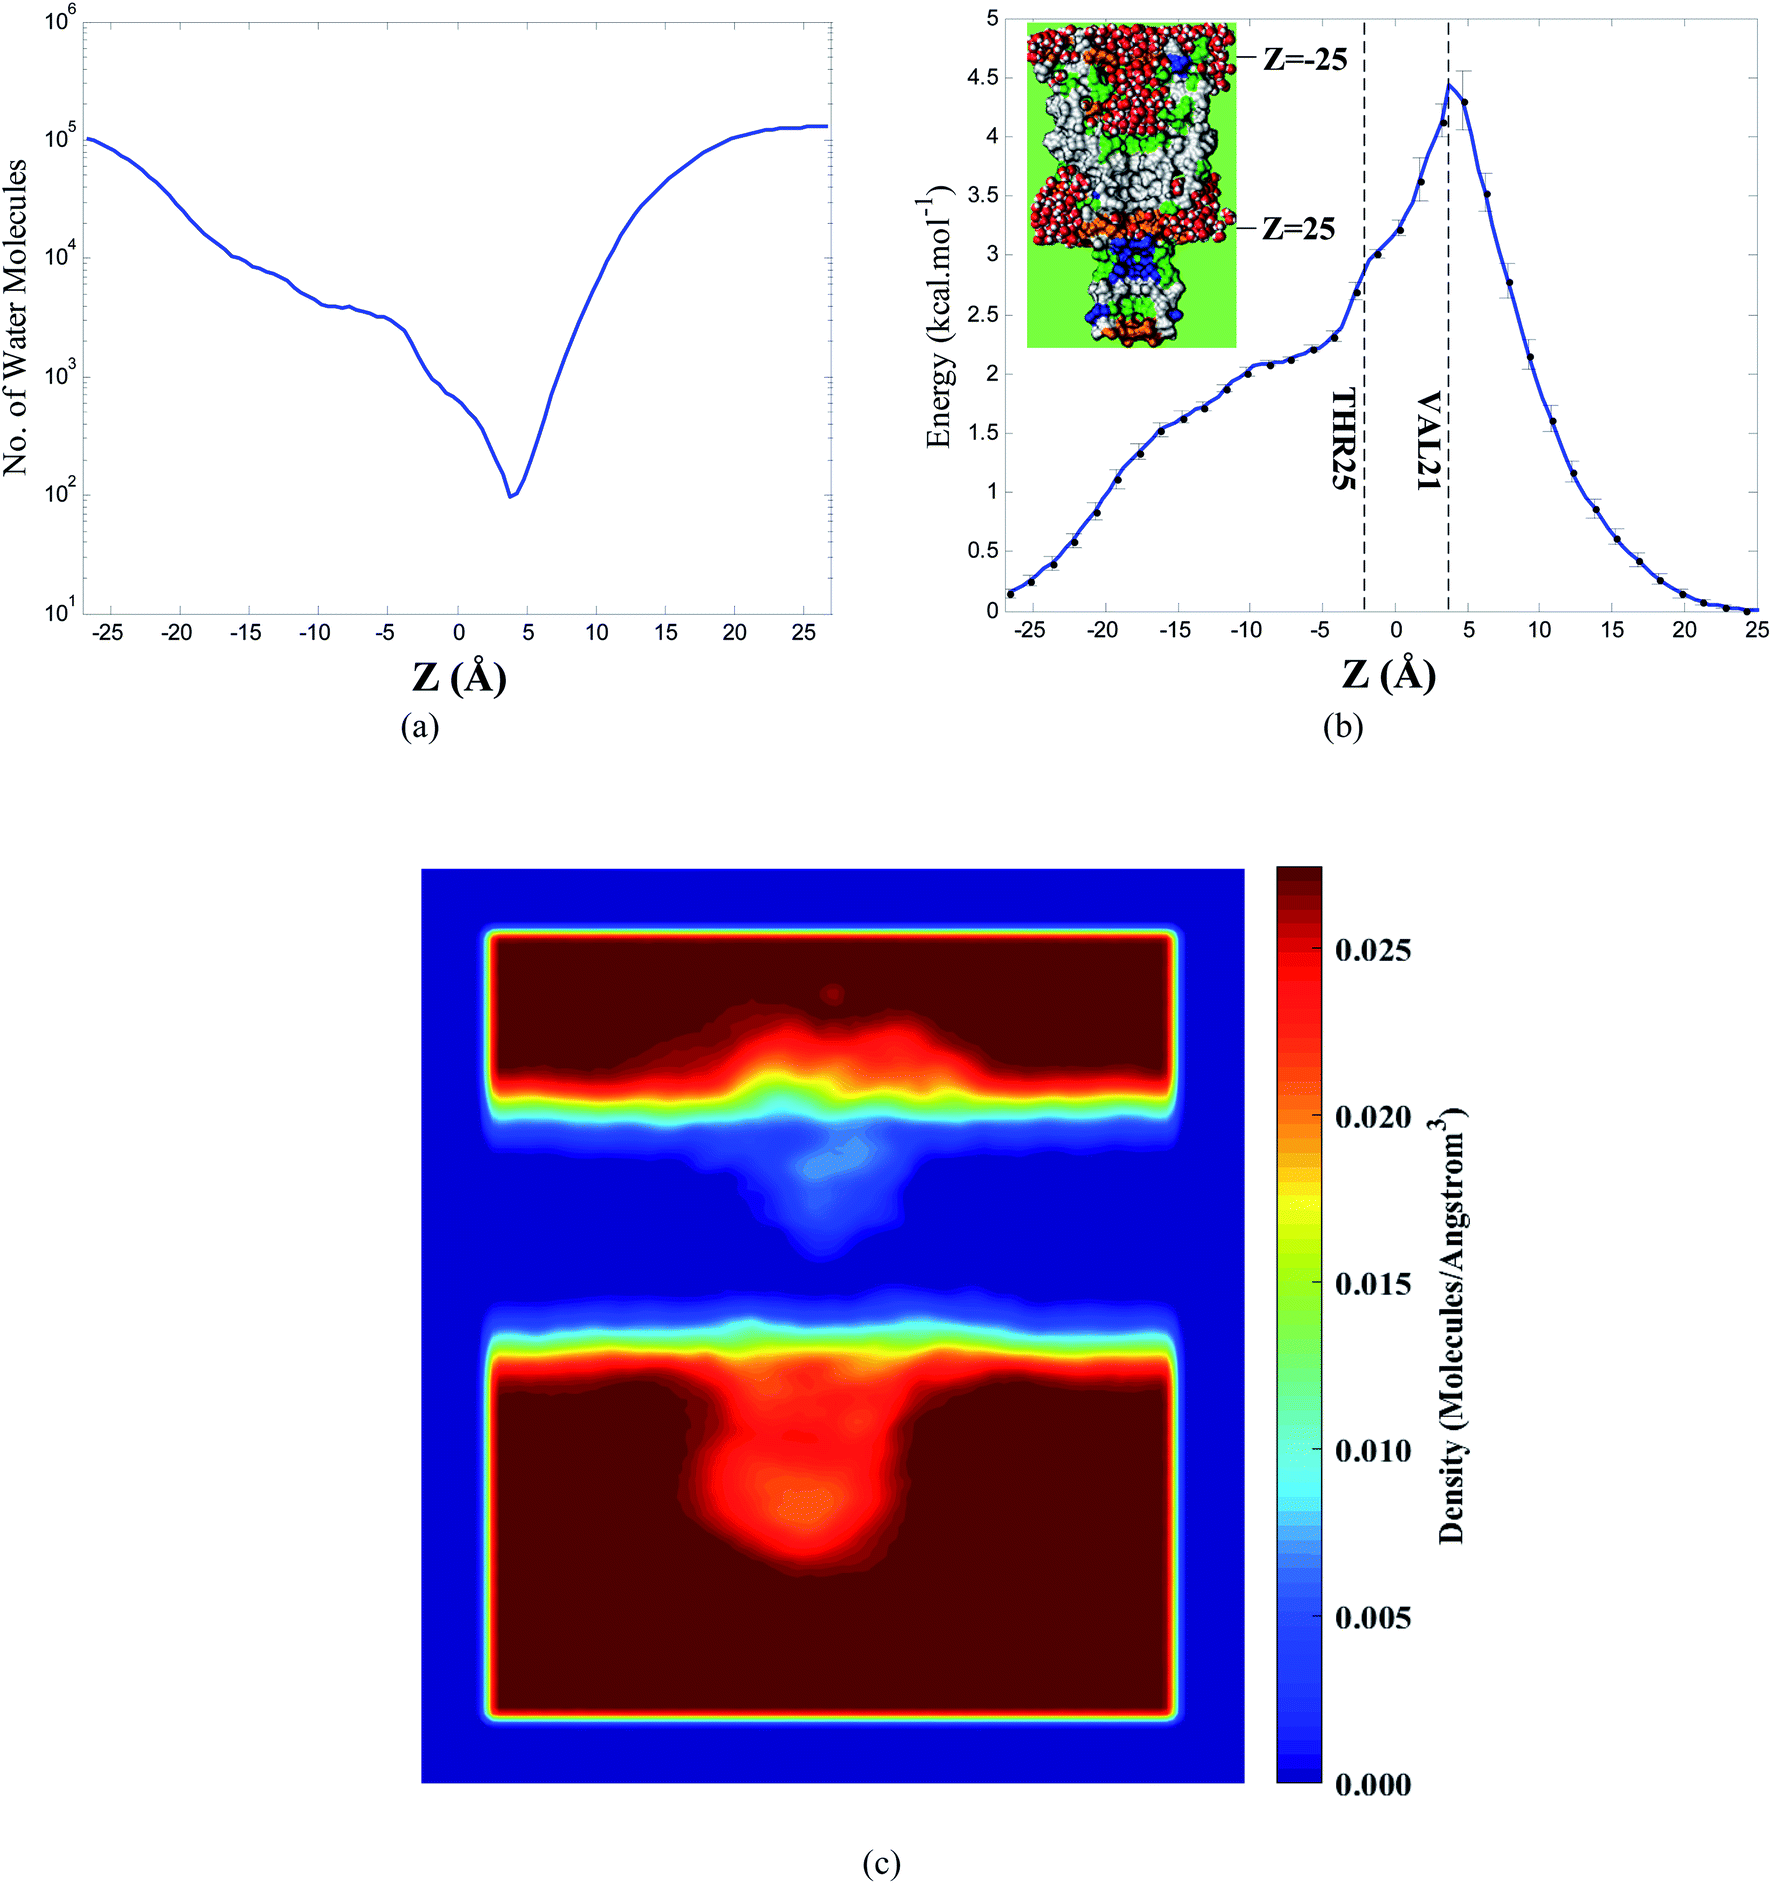 | ||
| Fig. 3 (a) The cumulative number of water molecules in the transmembrane region throughout 100 ns simulation, (b) free energy profile for water molecules in the transmembrane domain (calculated by Boltzmann inversion of the water density number within the pore) for the closed state of Tb-MscL. The vertical lines represent the position of VAL21 and THR25 inside the pore, (c) contour plot of the number density of the oxygen atoms of water molecules in the system. | ||
In Fig. 3c, the contour plot for the number density of the oxygen atoms of water molecules during the simulation time is illustrated. According to Fig. 3c, it is deduced that in the hydrophobic gate of the transmembrane domain, the least amount of water molecules can be detected over the simulation time, which is in agreement with the free energy profile in Fig. 3b. Furthermore, in the hydrophilic domains of the pore, in particular, the hydrophilic domain enclosed by H3 helices, a remarkable density of water molecules is observed.
As previously discussed in Section 3.1, the side chains VAL21 and GLU104 play a pivotal role in the gating sections of the channel. Nevertheless, the above side chains have quite different hydrophilic properties. The distribution heatmap of hydrogen and oxygen atoms of water molecules in the narrow domains enclosed by VAL21 and GLU104 is displayed in Fig. 4. It is inferred from Fig. 4 that due to the hydrophobic nature of VAL21, the distribution of the oxygen and hydrogen atoms of water in the area enclosed by VAL21 side chains does not follow a uniform or homogeneous pattern.
 | ||
| Fig. 4 Panels (a) and (d) represent the top view of VAL21 and GLU104 side chains respectively. Panels (b) and (c) illustrate the distribution heatmap for hydrogen and oxygen atoms of water molecules in the narrow area enclosed by VAL21 side chains. Panels (e) and (f) illustrate the distribution heatmap for hydrogen and oxygen atoms of water molecules in the narrow area enclosed by GLU104 side chains. | ||
Water molecules are generally unlikely to be present or accumulate in the hydrophobic region. As soon as a properly open space is formed between the two adjacent VAL21 chains by a conformational change in the position of TM1 helices relative to each other, water molecules will permeate through the opening. However, as already discussed in Section 3.1, due to the acidic feature and charged headgroups of GLU104, oxygen and hydrogen atoms of water are expected to have a relatively different distribution pattern in the region enclosed by GLU104. Water molecules are distributed more uniformly among the GLU104 side chains than VAL21. In the spatial domain enclosed by GLU104, due to the remarkable interaction between the charged headgroups of GLU104 and water molecules, they are distributed more densely at the corner points close to the side chains than the central point. The distribution heatmap for hydrogen and oxygen atoms of the water molecules is depicted in panels (e) and (f) of Fig. 4.
Moreover, as a result of the attractive electrostatic interaction between the hydrogen atoms of water and the oxygen headgroups in GLU104, the hydrogen atoms of water accumulate in the vicinity of oxygen atoms of GLU104.
In order to determine the orientation of permeating water molecules along the Z-axis, the distribution of the dipole moments for water molecules permeating through the narrow regions enclosed by VAL21 and GLU104 is illustrated in Fig. 5.
 | ||
| Fig. 5 Distribution of the dipole moment of water molecules permeating through the narrow region enclosed by the side chains: (a) VAL21, and (b) GLU104. | ||
As revealed in Fig. 5a, when water permeates through VAL21, the distribution pattern of the dipole moment of water does not follow a specific trend. However, as anticipated in Fig. 5b, when the water molecules permeate through GLU104, the dipole has the highest frequency in the range of 55° < Mz < 80°. It is inferred from Fig. 5 that when the water permeates through the GLU104 side chains, it is oriented toward the side chains from the hydrogen atoms. In this case, the water molecules tend to orient in a way that maintains their relatively strong interaction with GLU104.
3.4. Ion permeation by steered molecular dynamics
As previously denoted in Section 2.2, the SMD process was carried out by applying a variable bias force with an almost constant velocity into the ion to move toward the channel cavity. It makes the time evolution of the position of the particle appear in an almost linear expression. However, considerable interaction between the ion and specific side chains causes a significant deviation from the linear behavior, and consequently, sharp drops occur in the position. The position of the permeating ions and the pulling SMD force was described in more detail in Section S6.†The non-bonded interactions energies between the ions and VAL21 were obtained to investigate the selective function of the VAL21 filter when interacting with different ions. Fig. 6 shows the non-bonded interaction energies between the ions and VAL21 side chains during the permeation process.
 | ||
| Fig. 6 Components of the non-bonded interaction energies in ion permeation through VAL21: (a) electrostatic energy for the ion–VAL21 interaction, (b) van der Waals energy for the ion–VAL21 interaction. | ||
Fig. 6 implies that in the case of pulling the chloride ion, repulsive electrostatic energy exists between the ion and the side chain before permeation. This energy will be altered to attractive as soon as the ion permeates through the side chain. However, for the permeation of K+, the electrostatic energy demonstrates an entirely converse trend than Cl−. Moreover, regarding van der Waals energy, VAL21 interacts similarly with both ions. Both ions experience a repulsive van der Waals interaction during permeation, while the energy barrier for the K+ is higher than Cl−.
In the next step, the secondary structure analysis was carried out by VMD timeline plugin51 for transmembrane helices (TM1 and TM2), Helix 3 (H3), and the cytoplasmic loop to evaluate the structural alterations of the protein during the ion permeation. More details about the frequency of secondary structures in Tb-MscL during the equilibrium and SMD simulations are presented in Section S7.† According to Fig. S7,† although the frequency of secondary structures in H3 and TM2 helices during the equilibrium and ion permeation conditions follows a similar trend, it appears that some of the mentioned helices undergo significant conformational changes during the ion permeation. Thus, we investigate the conformational changes of transmembrane and H3 helices during the ion permeation. The moving average of the angles of TM and H3 helices with vertical direction during the ion permeation is displayed in Fig. 7. On this basis, it is concluded that the angle of TM helices does not change significantly due to the steric constraints applied by the bilayer environment. Nevertheless, despite the relative stability of the secondary structure during ion permeation, the angle of H3 helices with the Z-axis reaches twice that of its equilibrium value. It is important to note that if the conformational changes in the channel occur utilizing a tensile force in the membrane, the TM helices will have as much space as possible to change their angle with the Z direction.22
 | ||
| Fig. 7 Conformational changes in transmembrane and cytoplasmic domains. (a) Schematic representation of the angles θ1 (between TM1 helices and vertical direction), θ2 (between TM2 helices and vertical direction), and θ3 (between H3 helices and vertical direction), panels (b) and (c) represent the average value of the mentioned angles in panel (a) over the simulation time in cases of Cl− and K+ permeation respectively. | ||
In most cases, instead of exiting through the distal pore, ions or water molecules exit through the side openings of the cytoplasmic domain.43 The formation of a side opening can occur due to reshaping or breaking a salt bridge in the protein structure. Subsequently, the salt bridges in the protein structures are searched and identified by VMD.51 When the water molecules permeate through a side opening in the cytoplasmic domain, breaking a salt bridge between Lys100 and Glu102 causes a local deformation in the Tb-MscL structure leading to the opening. The salt bridge breakage is illustrated in Fig. 8. The structural deformation in this domain occurs so that the average distance between Lys100 and Glu102 reaches almost three times its initial level, and the salt bridge is broken.
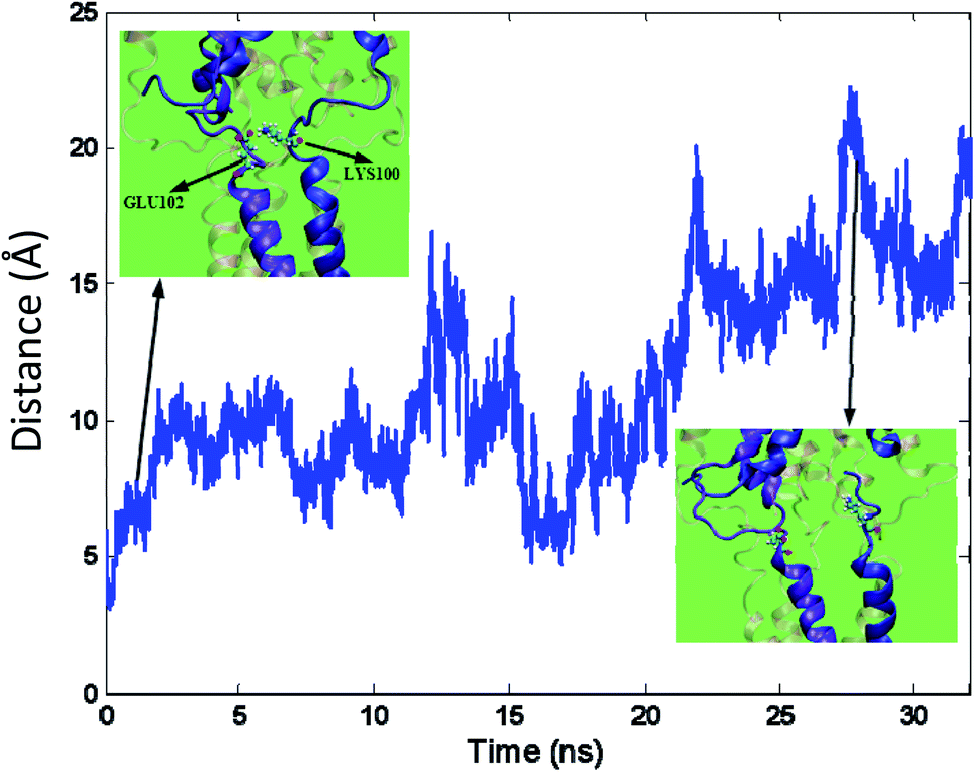 | ||
| Fig. 8 Salt bridge breakage, time variation of the distance between GLU102 and LYS100, transparent rendering for other helices (the inset figures demonstrate the position of the mentioned side chains in initial steps of simulation and after salt bridge breakage respectively). | ||
3.5. External electric field
In this section, the results associated with applying an external electric field to the system are presented. Initially, alterations of the electrostatic potential heatmap of the system due to the external electric field are investigated, and afterward, the possibility of electrowetting in the presence of the electric field will be evaluated over a specific period. Finally, putative changes in the ion density distribution in the presence of the electric field will be discussed.The electrostatic potential heatmap for the equilibrated system and the system under the influence of the electric field is shown in Fig. 9. The maximum inhomogeneity in electrostatic potential occurs at the interface layer between the solvent and the bilayer/protein. Additionally, the electrostatic potential heatmap in hydrophobic lipid tails demonstrates a positive homogeneous level in this domain, while the potential in the domains occupied by the solvent is moderately inhomogeneous and negative. In this case, the potential pattern is in agreement with the dipole potential of the membrane provoked by interfacial dipoles. Nevertheless, by inducing a transmembrane voltage difference, the electrostatic potential distribution in the solvent transforms from a rather inhomogeneous state to a highly non-homogeneous pattern with completely separable levels. By applying the external electric field, the range of electrostatic potential of the system will increase from ∼10 V to ∼14.2 V. It also seems that the electric field decreases the thickness of the membrane partly.
 | ||
| Fig. 9 Electrostatic potential heatmap as determined by VMD51 in (a) equilibrium simulation, (b) presence of the external electric field. | ||
In Fig. 10, the position of the water molecules and ions within the channel pore in the presence of the external electric field over the simulation time is shown. As demonstrated by Fig. 10, inducing a remarkable voltage difference across the lipid bilayer leads to forming a single file of water molecules in the hydrophobic narrow section of the channel in some time intervals such as 8 < t < 11 ns. By applying the electric field along the Z-axis, the dipoles of the water molecules orient in the same direction as the electric field, and electrowetting occurs in the mentioned time interval.
 | ||
| Fig. 10 Time variations of the position of water molecules and ions within the channel in presence of the external electric field. | ||
Unlike chlorine ions, the external electric field makes the potassium ions diffuse in the interior pore by applying a force to the ions in the same direction of the field vector (the Z-axis). As shown in Fig. 10, potassium ions demonstrate an apparent tendency to permeate through the channel under the voltage gradient compared to the equilibrium state.
In Fig. 11, the density heatmap of Cl− and K+ over the simulation time under equilibrium conditions and applying the external electric field is illustrated. According to Fig. 11b, the applied force to chloride ions in the opposite direction of the Z-axis make the ions accumulate in the vicinity of the positively charged side chains ARG98, ARG11, and lower headgroups of the membrane leading to an increase in the density of Cl− in these regions. Based on Fig. 11e, the accumulation of potassium ions is evident in the adjacent domains of ASP108 and GLU116 side chains.
 | ||
| Fig. 11 (a) Graphical representation of ARG11 and ARG98 side chains. Panels (b) and (c) demonstrate the average density heatmap of Cl− over the simulation time under equilibrium and applying the external electric field conditions respectively. (d) Graphical representation of ASP108 and GLU116 side chains. Panels (e) and (f) demonstrate the average density heatmap of potassium ions over the simulation time under equilibrium and applying the external electric field conditions respectively. | ||
ASP108 and GLU116 are located inside the pore and on the acidic domain of H3 helices. The mentioned side chains interact with potassium ions by their negatively charged oxygen headgroups, and as a result, potassium ions aggregate in the vicinity of the oxygen headgroups. The density of potassium ions decreases in the adjacent domains of the mentioned residues due to the force applied to potassium ions in the Z direction by the external electric field. Instead, the potassium ions aggregate near the upper headgroups of the bilayer so that a portion of them are trapped in the upper part of the membrane.
4. Concluding remarks
The acquired results of this study represent the role of the determinant factors on the permeation of water and ions through a mechanosensitive channel of large conductance. We utilized biophysical parameters to investigate the different events during water and ion permeation at the atomic scale. In this regard, the pore-lining residues of Tb-MscL were identified. Afterward, the hydration procedure in the hydrophobic transmembrane gate of Tb-MscL and the ion permeation were investigated using steered molecular dynamics simulation. Finally, an assessment was accomplished on how the water and ion permeation and the electrostatic potential are affected by inducing a remarkable voltage difference to the system. The results of pore size analysis for closed, expanded, and open conformations of E. coli-MscL illustrated that the pore size of the channel in the open state would increase by approximately six times as much as the size of the hydrophobic gate in the closed and expanded states. The pivotal role of VAL21 side chains, as the gating filters of the transmembrane region, and GLU104 side chains in the cytoplasmic domain, in water and ion permeation, was scrutinized, and the results were in agreement with previous studies.46 It was also indicated that the weak interaction between the extracellular loops and the membrane compared to transmembrane helices increased the RMSD level for the loops. It was identified by time evolution for the position of water and ion in the transmembrane domain of the pore that ionic conductance does not occur in the closed structure of Tb-MscL under equilibrium conditions. However, during some time intervals of equilibrium simulation, the hydration of the hydrophobic gate was detected. The water molecules in the hydrophobic gate enclosed by VAL21 side chains have the minimum level of accumulation over simulation time, and naturally, the maximum free energy barrier (∼4.5 kcal mol−1). The distribution heatmaps for water molecules in the domain enclosed by VAL21 and GLU104 side chains are entirely different, and this is related to the nature of the hydrophobic sidechain of VAL21 and the charged residue GLU104. In order to explore the orientation of water molecules during interaction with the mentioned side chains, the distribution of the dipole moment of water molecules was calculated.In the next step, the ions were conducted into the channel pore in a constant velocity by applying a pulling force to Cl− and K+ individually. The pore-lining side chains with the highest interaction with the ions were identified by calculating the pulling force obtained by SMD simulation. The SMD force illustrated that THR115 interacts with K+ much stronger than Cl−. However, the negatively charged ion required a higher SMD force to permeate through the acidic side chains of Glu104 than the positive one. The selective function of the non-polar side chain VAL21 was investigated, and it was demonstrated that the mentioned side chain interacts with oppositely charged ions distinctly. The secondary structure analysis demonstrated that during the ion permeation, in comparison with the equilibrium state, the inner transmembrane helices partially lose their alpha-helix structure, while the secondary structures of the outer transmembrane helices and H3 helices are remarkably preserved. Although their secondary structure is retained during the ion permeation, H3 helices undergo a severe conformational change resulting in a significant change in their angles to the Z-axis.
In the next stage, a large external electric field was applied to the system to explore the field influence on permeability and ionic conductance. By evaluating the heatmap of electrostatic potential for the system, it was determined that the electric field not only turns the solvent electric potential to a heterogeneous pattern but also modifies the potential distribution in the membrane. Inducing the external electric field, in addition to altering the degree of wettability of the channel, will distinctly change the ionic density in the system.
Needless to say, the conclusions derived in this study focused on the interaction of water molecules and oppositely charged ions with pore-lining side chains of the channel. We can neither declare to have determined the minimum pathway for the opening of the channel nor reject the possibility of designing an even more comprehensive paradigm to provide an insight into details of permeation procedure in ion channels. Nonetheless, we can express that, through the methods that emphasize the nature of the factors affecting the functional state of the ion channel, our general method makes it possible to investigate the permeation procedure in ion channels in an efficient manner.
Conflicts of interest
The authors declare that they have no conflict of interest.References
- R. Wan, H. Lu, J. Li, J. Bao, J. Hu and H. Fang, Phys. Chem. Chem. Phys., 2009, 11, 9898–9902 RSC.
- J. Köfinger, G. Hummer and C. Dellago, Phys. Chem. Chem. Phys., 2011, 13, 15403–15417 RSC.
- J. Chen, X.-Z. Li, Q. Zhang, A. Michaelides and E. Wang, Phys. Chem. Chem. Phys., 2013, 15, 6344–6349 RSC.
- P. Pedersen and P. Nissen, Biochim. Biophys. Acta, Gen. Subj., 2015, 1850(3), 447–448 CrossRef PubMed.
- V. Fadaei Naeini, M. Foroutan, M. Maddah, Y. Rémond and M. Baniassadi, Biochim. Biophys. Acta, Gen. Subj., 2018, 1862, 2815–2823 CrossRef CAS PubMed.
- A. R. Ednie, J. M. Harper and E. S. Bennett, Biochim. Biophys. Acta, Gen. Subj., 2015, 1850, 307–317 CrossRef CAS PubMed.
- H. Sackin, Annu. Rev. Physiol., 1995, 57, 333–353 CrossRef CAS PubMed.
- P. G. Gillespie and R. G. Walker, Nature, 2001, 413, 194–202 CrossRef CAS PubMed.
- P. Blount and P. C. Moe, Trends Microbiol, 1999, 7, 420–424 CrossRef CAS PubMed.
- T. Feng, S. Kalyaanamoorthy, A. Ganesan and K. Barakat, Biochim. Biophys. Acta, Gen. Subj., 2019, 1863(6), 1116–1126 CrossRef CAS PubMed.
- H. Zhang, J. Ma, J. Shen, Y. Lan, L. Ding, S. Qian, W. Xia, C. Cheng and P. K. Chu, Rsc Adv., 2018, 8, 21139–21149 RSC.
- T. Sindhu and P. Srinivasan, RSC Adv., 2015, 5, 14202–14213 RSC.
- S. I. Sukharev, W. J. Sigurdson, C. Kung and F. Sachs, J. Gen. Physiol., 1999, 113, 525–540 CrossRef CAS PubMed.
- X. Kong, Z. Li, D. Lu, Z. Liu and J. Wu, RSC Adv., 2014, 4, 37592–37599 RSC.
- D. Shanmugarajan, P. Prabitha, B. R. P. Kumar and B. Suresh, RSC Adv, 2020, 10, 31385–31399 RSC.
- O. Beckstein, K. Tai and M. S. P. Sansom, J. Am. Chem. Soc., 2004, 126, 14694–14695 CrossRef CAS PubMed.
- S. Sukharev, S. R. Durell and H. R. Guy, Biophys. J., 2001, 81, 917–936 CrossRef CAS PubMed.
- D. E. Elmore and D. A. Dougherty, Biophys. J., 2001, 81, 1345–1359 CrossRef CAS PubMed.
- J. Gullingsrud, D. Kosztin and K. Schulten, Biophys. J., 2001, 80, 2074–2081 CrossRef CAS.
- G. Colombo, S. J. Marrink and A. E. Mark, Biophys. J., 2003, 84, 2331–2337 CrossRef CAS PubMed.
- L. E. Bilston and K. Mylvaganam, FEBS Lett., 2002, 512, 185–190 CrossRef CAS PubMed.
- J. Gullingsrud and K. Schulten, Biophys. J., 2003, 85, 2087–2099 CrossRef CAS PubMed.
- J. Jeon and G. A. Voth, Biophys. J., 2008, 94, 3497–3511 CrossRef CAS PubMed.
- A. Anishkin, V. Gendel, N. A. Sharifi, C.-S. Chiang, L. Shirinian, H. R. Guy and S. Sukharev, J. Gen. Physiol., 2003, 121, 227–244 CrossRef CAS PubMed.
- Y. Sawada, M. Murase and M. Sokabe, Channels, 2012, 6, 317–331 CrossRef CAS PubMed.
- C. A. Haselwandter and R. Phillips, Europhys. Lett., 2013, 101, 68002 CrossRef PubMed.
- P. Moe and P. Blount, Biochemistry, 2005, 44, 12239–12244 CrossRef CAS PubMed.
- C. Koshy and C. Ziegler, Biochim. Biophys. Acta, Gen. Subj., 2015, 1850, 476–487 CrossRef CAS PubMed.
- D. E. Elmore and D. A. Dougherty, Biophys. J., 2003, 85, 1512–1524 CrossRef CAS PubMed.
- G. Debret, H. Valadié, A. M. Stadler and C. Etchebest, Proteins Struct. Funct. Genet., 2008, 71, 1183–1196 CrossRef CAS PubMed.
- J. Gullingsrud and K. Schulten, Biophys. J., 2004, 86, 3496–3509 CrossRef CAS PubMed.
- P. Wiggins and R. Phillips, Biophys. J., 2005, 88, 880–902 CrossRef CAS PubMed.
- M. Bialecka-Fornal, H. J. Lee, H. A. DeBerg, C. S. Gandhi and R. Phillips, PLoS One, 2012, 7, e33077 CrossRef CAS PubMed.
- M. Bialecka-Fornal, H. J. Lee and R. Phillips, J. Bacteriol., 2015, 197, 231–237 CrossRef PubMed.
- B. Corry and D. Jayatilaka, Biophys. J., 2008, 95, 2711–2721 CrossRef CAS PubMed.
- C. Bae, F. Sachs and P. A. Gottlieb, Biochemistry, 2011, 50, 6295–6300 CrossRef CAS PubMed.
- M. Moradi, G. Enkavi and E. Tajkhorshid, Nat. Commun., 2015, 6, 8393 CrossRef CAS PubMed.
- M. Moradi and E. Tajkhorshid, Proc. Natl. Acad. Sci. U.S.A., 2013, 110, 18916–18921 CrossRef CAS PubMed.
- G. Hummer and A. Szabo, Proc. Natl. Acad. Sci. U.S.A., 2001, 98, 3658–3661 CrossRef CAS PubMed.
- S. Park, F. Khalili-Araghi, E. Tajkhorshid and K. Schulten, J. Chem. Phys., 2003, 119, 3559–3566 CrossRef CAS.
- M. Ø. Jensen, S. Park, E. Tajkhorshid and K. Schulten, Proc. Natl. Acad. Sci. U.S.A., 2002, 99, 6731–6736 CrossRef CAS PubMed.
- B. Ilan, E. Tajkhorshid, K. Schulten and G. A. Voth, Proteins Struct. Funct. Bioinf., 2004, 55, 223–228 CrossRef CAS PubMed.
- R. Gamini, M. Sotomayor, C. Chipot and K. Schulten, Biophys. J., 2011, 101, 80–89 CrossRef CAS PubMed.
- J. Gumbart and K. Schulten, Biochemistry, 2007, 46, 11147–11157 CrossRef CAS PubMed.
- J. S. Najem, I. Rowe, A. Anishkin, D. J. Leo and S. Sukharev, Sci. Rep., 2018, 8, 1–12 CAS.
- G. Chang, R. H. Spencer, A. T. Lee, M. T. Barclay and D. C. Rees, Science, 1998, 282, 2220–2226 CrossRef CAS PubMed.
- C. C. Häse, R. F. Minchin, A. Kloda and B. Martinac, Biochem. Biophys. Res. Commun., 1997, 232, 777–782 CrossRef PubMed.
- P. Blount, S. I. Sukharev, P. C. Moe, M. J. Schroeder, H. R. Guy and C. Kung, EMBO J., 1996, 15, 4798–4805 CrossRef CAS PubMed.
- M. Schleyer, R. Schmid and E. P. Bakker, Arch. Microbiol., 1993, 160, 424–431 CrossRef CAS PubMed.
- P. C. Moe, P. Blount and C. Kung, Mol. Microbiol., 1998, 28, 583–592 CrossRef CAS PubMed.
- W. Humphrey, A. Dalke and K. Schulten, J. Mol. Graph., 1996, 14, 33–38 CrossRef CAS PubMed.
- E. Perozo, A. Kloda, D. M. Cortes and B. Martinac, J. Gen. Physiol., 2001, 118, 193–206 CrossRef CAS PubMed.
- J. C. Phillips, R. Braun, W. Wang, J. Gumbart, E. Tajkhorshid, E. Villa, C. Chipot, R. D. Skeel, L. Kale and K. Schulten, J. Comput. Chem., 2005, 26, 1781–1802 CrossRef CAS PubMed.
- S. E. Feller, Y. Zhang, R. W. Pastor and B. R. Brooks, J. Chem. Phys., 1995, 103, 4613–4621 CrossRef CAS.
- M. Schlenkrich, J. Brickmann, A. D. MacKerell and M. Karplus, in Biological Membranes, Springer, 1996, pp. 31–81 Search PubMed.
- S. E. Feller, D. Yin, R. W. Pastor and A. D. MacKerell, Biophys. J., 1997, 73, 2269–2279 CrossRef CAS PubMed.
- A. D. MacKerell, D. Bashford, M. Bellott, R. L. Dunbrack, M. J. Field, S. Fischer, J. Gao, H. Guo, S. Ha and D. Joseph, FASEB J., 1992, 6(1), A143–A143 Search PubMed.
- A. D. MacKerell, D. Bashford, M. Bellott, R. L. Dunbrack, J. D. Evanseck, M. J. Field, S. Fischer, J. Gao, H. Guo, S. Ha, D. Joseph-McCarthy, L. Kuchnir, K. Kuczera, F. T. K. Lau, C. Mattos, S. Michnick, T. Ngo, D. T. Nguyen, B. Prodhom, W. E. Reiher, B. Roux, M. Schlenkrich, J. C. Smith, R. Stote, J. Straub, M. Watanabe, J. Wiórkiewicz-Kuczera, D. Yin and M. Karplus, J. Phys. Chem. B, 1998, 102, 3586–3616 CrossRef CAS PubMed.
- T. Darden, D. York and L. Pedersen, J. Chem. Phys., 1993, 98, 10089–10092 CrossRef CAS.
- J.-P. Ryckaert, G. Ciccotti and H. J. C. Berendsen, J. Comput. Phys., 1977, 23, 327–341 CrossRef CAS.
- J. L. Trick, S. Chelvaniththilan, G. Klesse, P. Aryal, E. J. Wallace, S. J. Tucker and M. S. P. Sansom, Structure, 2016, 24, 2207–2216 CrossRef CAS PubMed.
- S. Sukharev, M. Betanzos, C. S. Chiang and H. Robert Guy, Nature, 2001, 409, 720–724 CrossRef CAS PubMed.
- O. Beckstein and M. S. P. Sansom, Phys. Biol., 2004, 1, 42 CrossRef CAS PubMed.
Footnote |
| † Electronic supplementary information (ESI) available. See https://doi.org/10.1039/d2ra02284b |
| This journal is © The Royal Society of Chemistry 2022 |