DOI:
10.1039/D2RA02278H
(Paper)
RSC Adv., 2022,
12, 14127-14136
Investigation on the thermo-electric-electrochemical characteristics of retired LFP batteries for echelon applications
Received
8th April 2022
, Accepted 27th April 2022
First published on 11th May 2022
Abstract
Electric vehicles (EVs) have been developed to alleviate environmental pollution and climate change, but they leave behind a large amount of retired lithium-ion batteries (LIBs). Since the replacement of LIBs from EVs will lead to considerable waste generation, improving the echelon utilization of retired LIBs is becoming increasingly critical. In this paper, we studied the thermo-electric-electrochemical performance of retired LiFePO4 (LFP) batteries using traditional methods, and found that the remaining capacity of retired LFP batteries has a strong correlation with their internal resistance. This result helped us to propose a rapid and elementary classification method for the calibration of the remaining capacity, and to then formulate a test protocol seeking to balance the time spent and the test cost. Besides, the cut-off voltage and charge–discharge current density have a significant impact on the calibration of the remaining capacity, especially for retired LFP batteries with low residual capacity. In the cycle life test and temperature reliability evaluation process, the results demonstrate that the retired LFP batteries have a good service life when under a lower current of charge/discharge, and the capacity reductions were 2.3%, 11.2% and 4.8% for retired LFP batteries with 80% state of health (SOH), 70% SOH and 60% SOH, respectively, after 500 cycles. Finally, considering the temperature reliability, voltage consistency and large current cycling performance of retired LFP batteries, there are still many challenges in their future echelon utilization.
1 Introduction
In order to alleviate the fossil fuel and environmental pressures and promote the sustainable development of the transportation sector, EVs offer an attractive, environmental friendly and high-energy-efficient solution.1,2 Moreover, in order to address the challenge of global warming, the sale of fossil fuel vehicles will be stopped in countries around the world in the coming years; for instance, in the next 5 to 10 years in certain developed countries.3,4 LIBs are the best energy storage and power supply system of choice for EVs because of their long cycle life, high energy density, high voltage and low self-discharge.5–7
The service life of LIBs is approximately 5 to 8 years due to the degradation of their capacity and cycle life.8 Therefore, LIBs in EVs need to be replaced before the remaining capacity fades to 70–80% of the original level9 to avoid unexpected driving malfunctions or safety risks.10 In other words, the first batch of LIBs from EVs are quickly reaching the end of their lives, and it is inevitable that more and more retired LIBs will be generated in the near future.11 Retired LFP batteries will particularly be obtained in large amounts since they are so widely used due to their low cost and high safety. Furthermore, the amount of retired LIBs could reach 70.8 × 10⁴ tons in China by 2030,12 which will create some serious challenges for reducing battery costs and avoiding environmental pollution. If retired LIBs are not properly disposed, the toxic electrolytes, acid and alkali of the electrode material can lead to soil and water pollution as well as threats to human health.13 Therefore, a high efficiency and sustainable utilization strategy has been sought by numerous researchers, in which the echelon application of retired LIBs is considered as one of the most promising ways to reduce the manufacturing cost and extend the service life.14 Retired LIBs still have at least 70% capacity, sufficient to meet the demands of low energy storage devices, e.g., in home energy storage, portable power sources, and distributed energy systems.
In prior investigations, many research groups have aimed to develop recycling technology with high efficiency and economics for retired LIBs, which can be divided into two main technical routes.15,16 Firstly, retired LIBs can be used to recycle precious metal materials and relieve the shortage of valuable metals, e.g., Li, Co, Ni, Cu, and Al metals. According to the U.S. Geological Survey, Co reserves are limited to approximately 7 million tons,17 which has led to a sharp increase in the price of Co in recent years. However, these recycling processes have some disadvantages, such as (i) large energy consumption, (ii) large investments and costs, and (iii) environmental impact and pollutant emissions. Therefore, a second technical route is considered the most feasible and cost-effective by battery manufacturers and governments, which is involves recycling the valuable materials of retired LIBs when its completed the gradient utilization after.18,19 Although it is generally viewed that the application of retired batteries for energy storage is a good idea, there are a lot of key technical issues that need to be resolved, such as estimating the remaining capacity,20,21 predicting the state of health (SOH) of the battery,22 cycle life, and the safety.23 Different user behaviors and operating conditions can lead to different battery aging degrees, resulting in battery inconsistency and more sensitivity. To explore the feasibility of the echelon utilization of retired batteries, Tong et al.24 reported the application of retired batteries in an off-grid photovoltaic vehicle charging system, and the results showed that the cycle life reached 1400 cycles at 1C charge/discharge and 80% discharge of depth; Omar et al.25 studied the cycle life of batteries with 80% SOH under a test protocol of charging at 1C and discharging at 2C, and the results displayed that the remaining life of the retired battery was still more than 1000 cycle times. Although the retired battery showed a good cycle life, the remaining capacity and consistency evaluation is more important for potential applications, especially in energy storage. For assessing the remaining capacity, the most commonly used modeling methods include semi-empirical, equivalent circuit, mechanism, and data-driven models, which focus on accuracy, speed, and adaptability. Lai et al.20 reported a novel simple and efficient battery testing strategy, which was based on a support vector machine (SVM) algorithm to realize the large-scale rapid capacity estimation of retired LIBs. Ni et al.21 reported that using mechanism and data-driven models can offer a fast and accurate evaluation of the remaining capacity of retired batteries. Zhou et al.26 proposed a rapid classification method based on the internal resistance and voltage curves in charge/discharge, in which this method only needed 5 min compared with the traditional method and it had a maximum error within 4.2%. Lai et al.27 studied a rapid sorting and reasonable regrouping method using a Gaussian mixture model based on electrochemical impedance spectroscopy, in which this method only took about 10 min to obtain the capacity of each cell, and the error was within 4%. Despite all that, there are many studies that have reported various technologies, from the sorting technique, capacity evaluation, SOH prediction and cycle life tests for assessing retired batteries.28–30 However, there are few reports investigating the thermo-electrochemical performance of retired batteries, and this is important for assessing how to utilize them in echelon applications.
To address the knowledge gaps, this paper focuses on a study of the thermo-electric-electrochemical performance of retired LFP batteries, and provides a basic and comprehensive understanding of retired batteries. A test protocol for the remaining capacity assessment was systematically investigated, and the results implied that the influences of the current density and cut-off voltage on the capacity calibration were significant. Furthermore, the remaining capacity of retired LFP batteries was strongly related to the internal resistance, and this result suggested that examining the internal resistance is a rapid and elementary classification method for the remaining capacity assessment and calibration, and it can reduce unnecessary testing for retired LFP batteries. Additionally, the voltage consistency, cycle life, and temperature reliability of retired LFP batteries were also studied, and the results contributed to the development of a helpful strategy for the echelon utilization of retired LFP batteries. Finally, the micro-characteristics analysis of the electrode and separators materials showed that the degeneration of the battery capacity could be caused by the collapse of the material structure and the disappearance of holes.
2 Experimental
2.1 Retired LFP batteries
The retired batteries used in this work were donated by Shenzhen OptimumNano Energy Co., Ltd, amounting to a total of 800 batteries. These were normal commercially available 32650 LiFePO4 batteries with a capacity of 5.5 A h and internal resistance of approximately 7 mΩ (more detailed parameters are shown in Table 1). In the normal charging and discharging process, the cut-off voltages were 3.65 and 2.0 V, respectively.
Table 1 Parameters of retired LFP batteries
| Parameter |
Value |
| Rated voltage (V) |
3.2 |
| Rated capacity (A h) |
5.5 |
| Diameter (mm) |
32.5 |
| High (mm) |
65.0 |
| Copper connector high (mm) |
5.0 |
| Rated resistance (mΩ) |
7.0 |
| Mass (g) |
145 ± 2 |
| Cut-off voltage (V) |
2.0–3.65 |
2.2 Screening methods
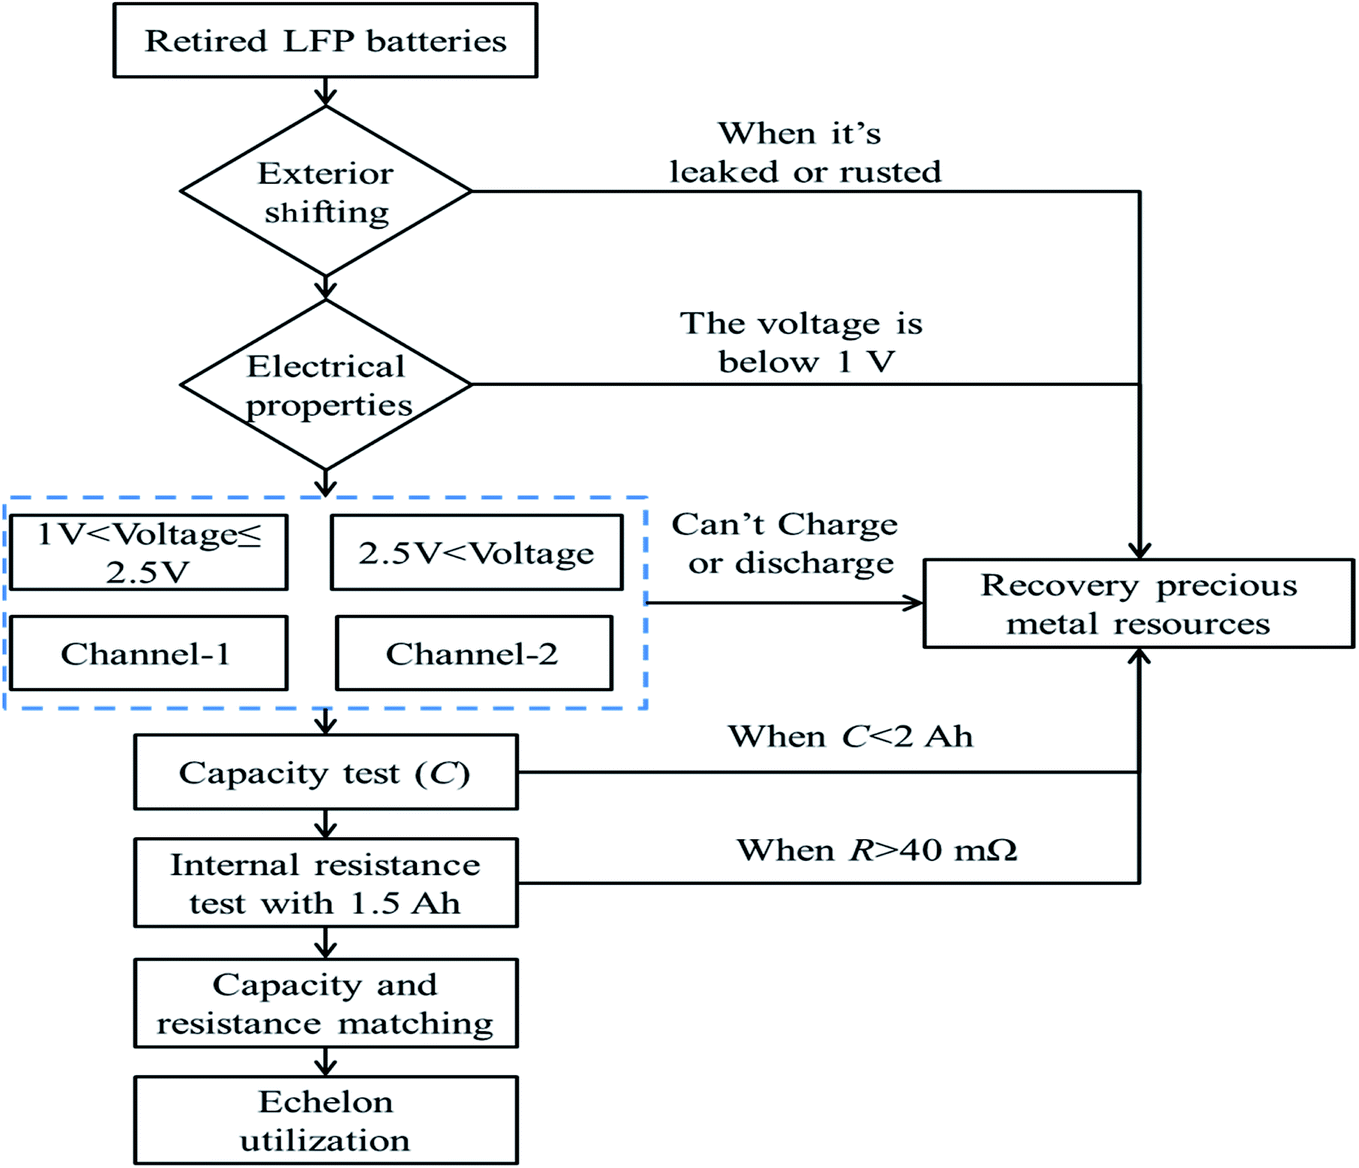
In order to explore the availability of the retired LFP batteries, all the batteries needed to be screened, as shown in Fig. 1 and as described in the following. First, if a retired battery showed rust, leakage, or the voltage was below 1.0 V, then it was directly recycled. Second, if the voltage of a retired battery was between 1.0 and 2.5 V, it was tested by adopting a constant-current and constant-voltage (CC–CV) protocol charge at 2.5 A, until the cut-off current was below 0.2 A. Subsequently, the retired battery was discharged at 2.5 A until the voltage was below 2.5 V. After that, the battery was tested again using the same test protocol. Furthermore, when the voltage of the battery was greater than 2.5 V, the battery was discharged at 2.5 A until the voltage was below 2.5 V, and then the battery was tested once again according to the above-mentioned charge–discharge test protocol. At the same time, any batteries without a charge–discharge capability were entered into resources recycling treatment. Next, the average of three discharge capacities was considered as the remaining capacity and the same test protocol as above was applied. If the capacity was below 2 A h, the retired battery also entered into resources recycling treatment. Finally, all the retired batteries underwent internal resistance testing after completing the remaining capacity assessment, and if the internal resistance was greater than 40 mΩ, the retired battery entered into resources recycling treatment. However, before echelon application, all retired LFP batteries must be graded and matched according to the remaining capacity and internal resistance, and to ensure they have a good consistency and safe reliability. After completing all the above-mentioned screening processes, only 57.3% of the retired LFP batteries were considered feasible for echelon utilization. These results implied that the batteries suffered different aging progresses before retiring, and this inconsistent aging was further aggravated when the retired LFP batteries were stored.
 |
| | Fig. 1 Screening process for retired LFP batteries. | |
2.3 Experimental platform
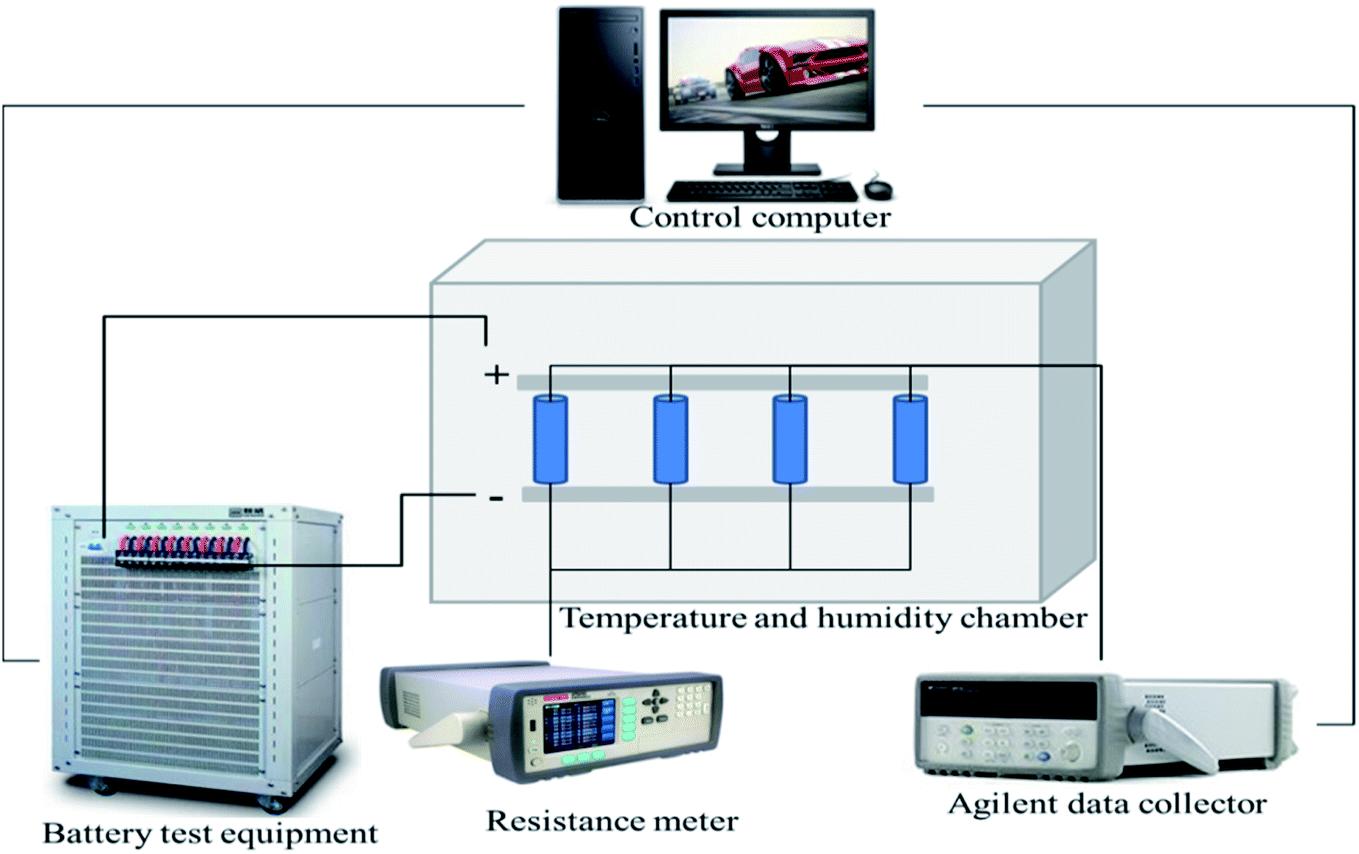
The thermo-electric-electrochemical performance of the retired LFP batteries was evaluated, as shown in Fig. 2. All the batteries were placed in an oven (Dongguan Sailham Instrument Co., Ltd.) at a constant temperature of 25 ± 0.5 °C, and the battery performance tests equipment was employed with 8 channels (BTS-4008T-5V30A, Shenzhen Neware Technology Co., Ltd.) to test the remaining capacity and cycle life. To evaluate the internal resistance (R) of the retired LFP batteries, resistance test equipment (AT5210, Changzhou Anbai Precision Instrument Co., Ltd.) was used. A T-type thermocouple wire (TC-TFF, 2 × 0.25 × 1000 mm, accuracy of ±0.1C, USA) was mounted on the middle of battery surface, and an Agilent data collector (USA, 34970A) was used to collect the data.
 |
| | Fig. 2 Test experimental platform for the retired LFP batteries. | |
3 Results and discussion
3.1 Electrochemical characteristics tests
Basis on Section 2.2, the remaining capacity of all the retired LFP batteries that have a feasibility for echelon utilization needed to be recalibrated. The average of three discharge capacities was used as the calibration for the remaining capacity, and the standard test protocol used is shown in Table 2.
Table 2 The detailed parameters of the standard cycling experiments
| Steps |
Projects |
Values |
| 1 |
CC–CV |
2.5 A |
| Upper cut-off voltage |
3.65 V |
| Cut-off current |
0.2 A |
| 2 |
Rest time |
10 min |
| 3 |
Constant-current discharge |
2.5 A |
| Cut-off voltage |
2.5 V |
| 4 |
Rest time |
10 min |
| 5 |
Cycle three times from 1 to 4 |
|
| 6 |
Constant-current charge |
2.5 A |
| Cut-off capacity |
1.5 A h |
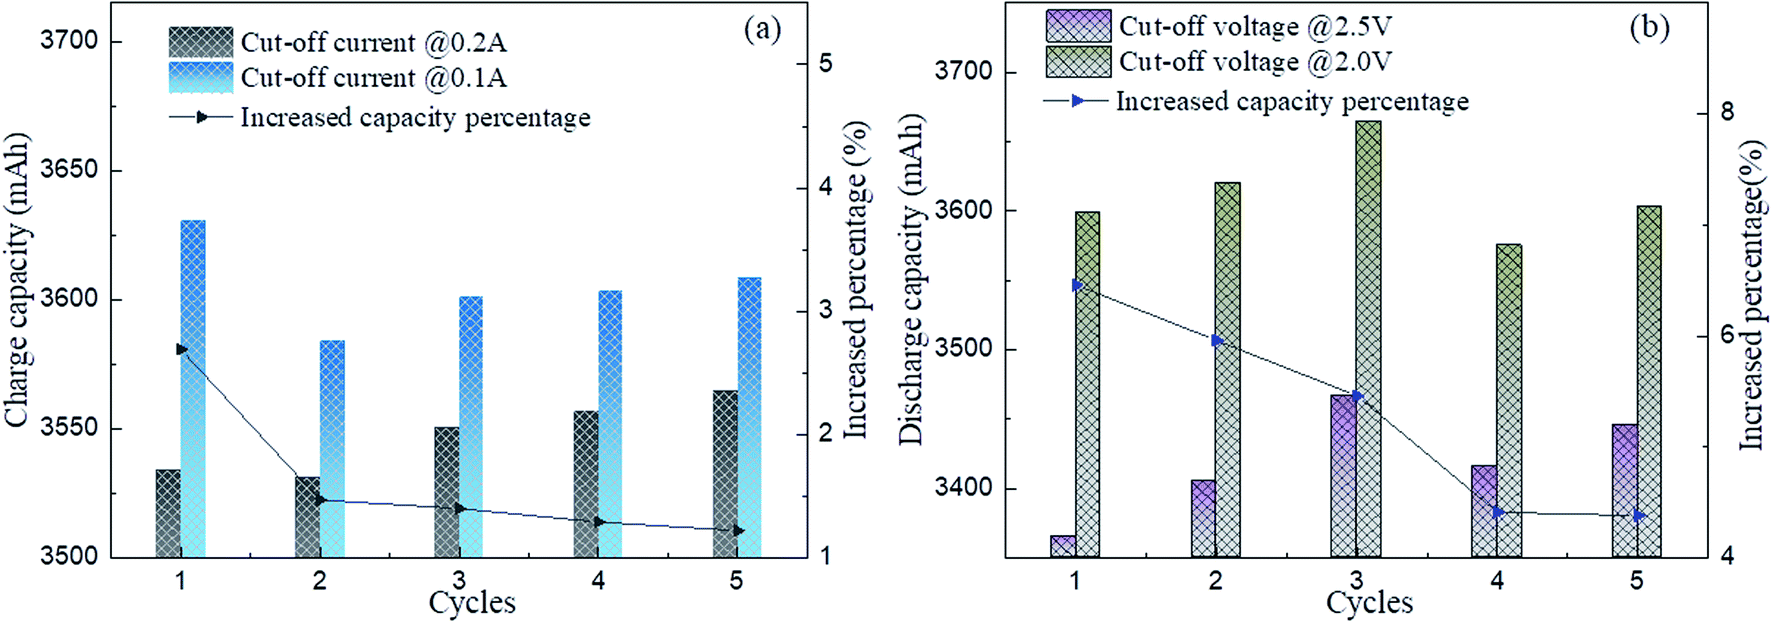
3.1.1 Influence of the test protocol. The influences on the remaining capacity of the cut-off current and cut-off voltage during the capacity tests process are displayed in Fig. 3. In these tests, the retired LFP batteries were cycled 5 times using different charge–discharge protocols. It can be seen from Fig. 3a that the charging capacity value showed a small change when the cut-off current declined from 0.2 A to 0.1 A. The average charge capacity increased 50 mA h, and the percentage increase was less than 2%. However, the average test time was extended by 20 min because of the lower cut-off current, which adds to the time spent on the tests and the test costs. Fig. 3b depicts the cut-off voltage influences on the discharging capacity tests, and the results clearly indicated that the discharge capacity undulation was significantly affected by the cut-off voltage. When the cut-off voltage was reduced from 2.5 V to 2.0 V, the average difference in the discharge capacity was 192.8 mA h and its average percentage of total capacity was over 4.5%. These results demonstrated that the cut-off voltage significantly influenced more than the cut-off current during the remaining capacity test process. Although employing a lower cut-off voltage could increase the detection value of the remaining capacity of the retired LFP batteries, the safety and tests cost of the retired LFP batteries must be taken into consideration. Therefore, in the following calibrated testing of the remaining capacity of the retired LFP batteries, the values of the cut-off current and voltage were 0.2 A and 2.5 V, respectively.
 |
| | Fig. 3 Influence of the different cut-off current and the voltage test protocol for the test capacity: (a) cut-off current and (b) cut-off voltage. | |
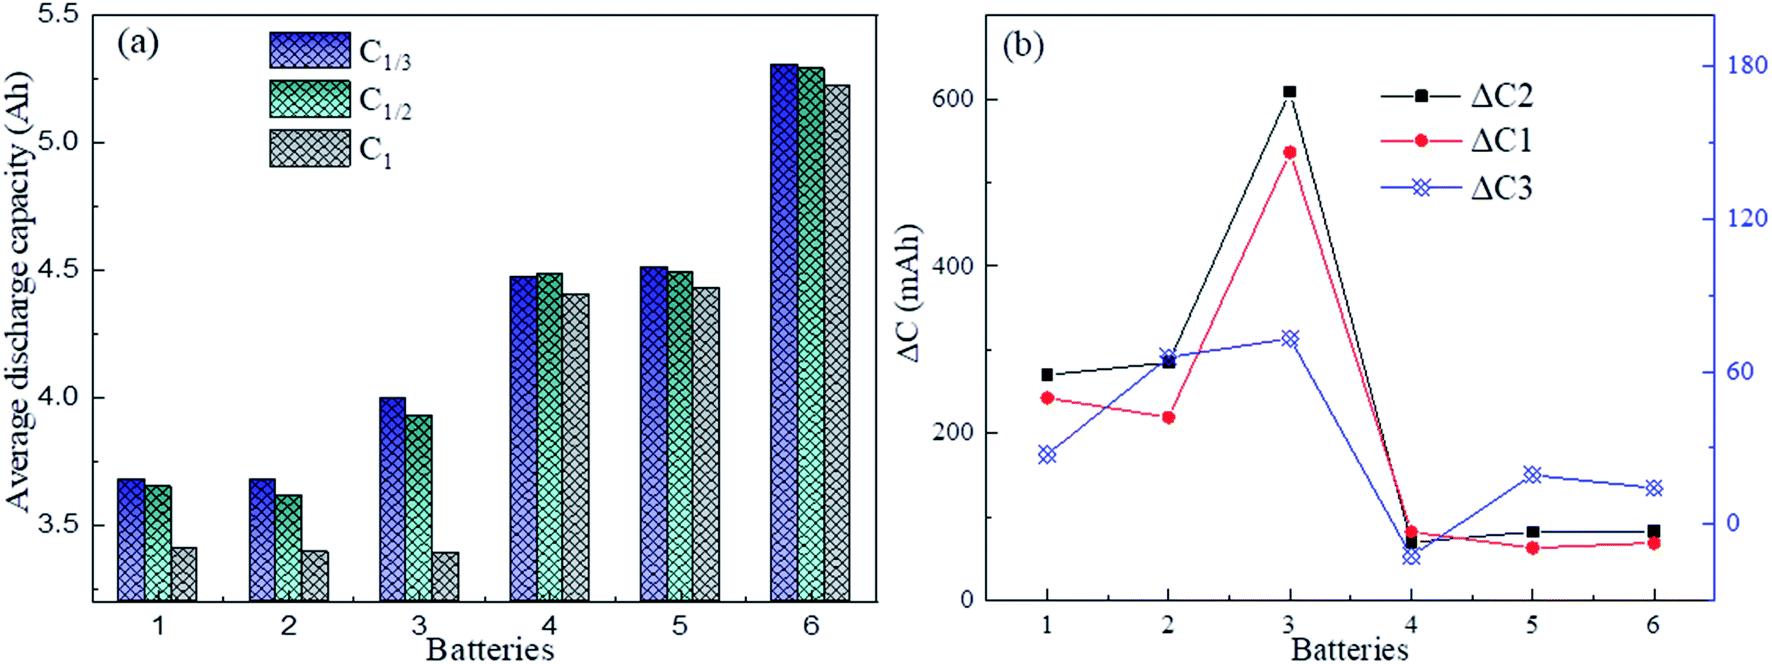
Fig. 4 shows the influence of different charge–discharge rates on the capacity, where it can be seen that the retired LFP batteries with lower remaining capacity were most significantly influenced by the charge–discharge rate. Here, ΔC1, ΔC2, and ΔC3 are defined as the average difference in the remaining capacity of the discharge between C1 and C1/2, C1 and C1/3 and C1/2 and C1/3, respectively. Here, C1, C1/2, and C1/3 represent the values the retired LFP batteries will adopt when the charge–discharge current is 5.5, 2.5, and 1.83 A, respectively. In Fig. 4b, ΔC1 and ΔC2 were over 220 mA h when the SOH of retired LFP batteries was less than 80% and the max peak values approximated to 600 mA h. In contrast, ΔC1 and ΔC2 were only 80 mA h when the SOH exceeded 80%, which shows a decline by about 2 times. Furthermore, ΔC3 showed similar trends, whereby it approached 60 mA h when the SOH was lower than 80%, and the difference fell below 30 mA h when the SOH was higher than 80%. Therefore, the results implied that the capacity calibration of retired LFP batteries sensitively undulated for the large charge–discharge current density, especially in retired LFP batteries with a lower SOH. In addition, the values of ΔC3 demonstrated that the remaining capacity did not significantly increase with the lower current density test protocol, and the test time was prolonged.
 |
| | Fig. 4 Influence of different charge–discharge rates on the test capacity: (a) different charge–discharge currents, (b) average difference of discharge capacity. | |
3.1.2 Distribution of capacity and resistance. The remaining capacity and internal resistance test results of all the retired LFP batteries are shown in Fig. 5, respectively. The capacities of all the retired LFP batteries were recalibrated using the above-mentioned standard test protocol, and the average discharge capacity of three cycles was used as the remaining capacity. In order to classify and manage the retired LFP batteries, they were divided based on their residual capacity into 7 groups (Fig. 5a). Fig. 5a shows that the retired LFP batteries underwent different abuses, which led to an inconsistent degeneration of the capacity, whereby the capacity fade showed a sinusoidal wave variation. Furthermore, 50% of the initial capacity was adopted as a screen criterion, and only 55% of the retired LFP batteries qualified. The internal resistance distribution of the retired LFP batteries is shown in Fig. 5b, where it can be obviously seen that the internal resistance greatly increased as the remaining capacity of the retired LFP batteries declined. Therefore, the results implied that the remaining capacity of the retired LPF batteries could be preliminarily determined by examining their internal resistance. The initial internal resistance average was only 7.1 mΩ and the amplitude of the fluctuation was very small. Whereas, when the SOH of the retired LFP batteries declined to 80%, 70%, and 60%, the average of internal resistance increased by 1.4, 1.8, and 2.2 times and so rose to 9.6, 12.5, and 15.8 mΩ, respectively. The results confirmed that the retired LFP batteries displayed a prominent inconsistency, which implies an inevitable increase in assembly costs and a reduction in energy conversion efficiency.
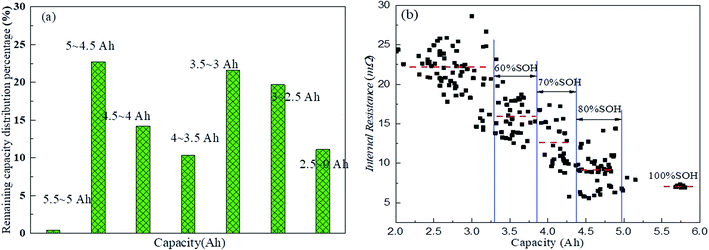 |
| | Fig. 5 The remaining capacity and internal resistance distribution of retired LFP batteries: (a) capacity and (b) internal resistance. | |
3.2 Electrical characteristics
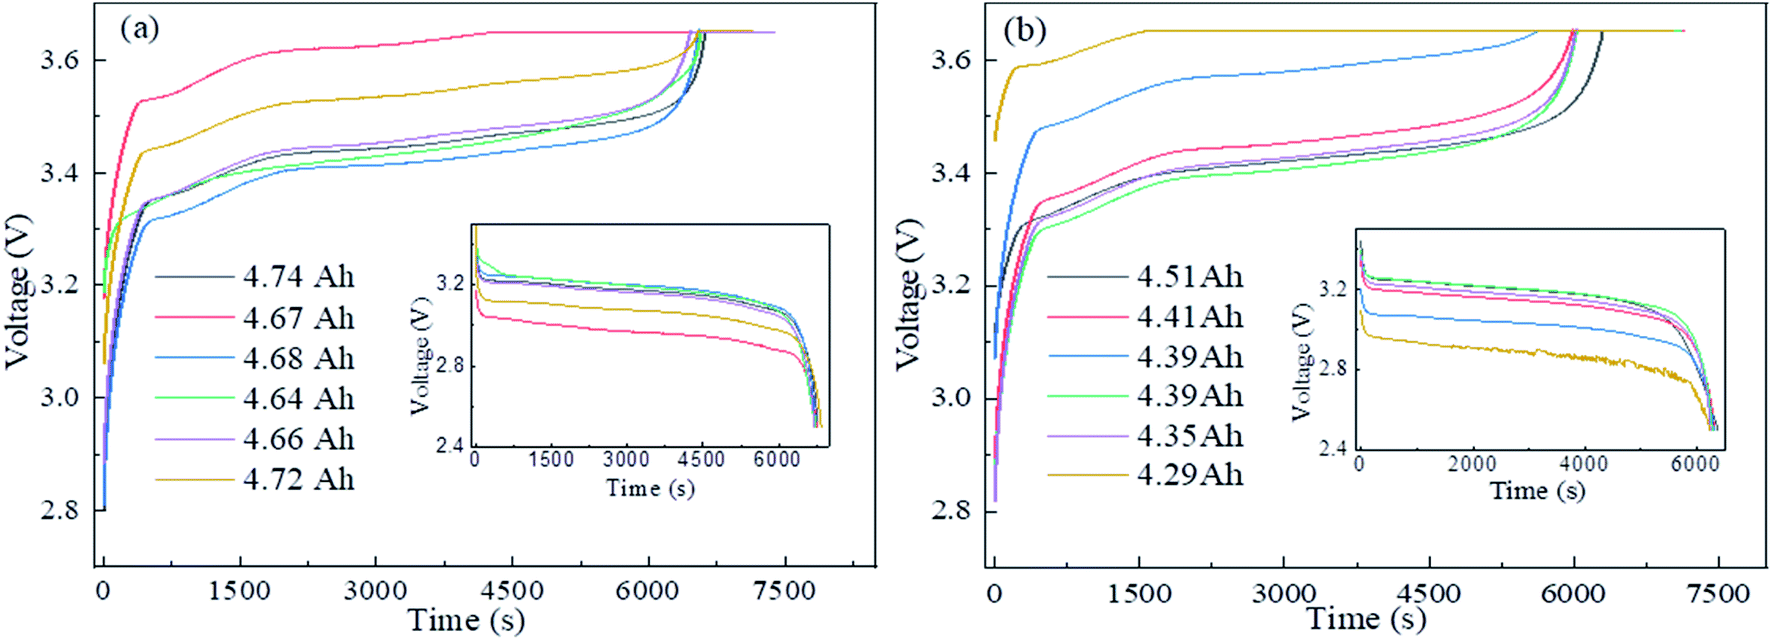
3.2.1 Voltage inconsistency. The voltage curve for charge–discharge is a significant performance evaluation parameter. Fig. 6 shows the voltage response curves during charging and discharging at different SOHs of the retired LFP batteries. In all the batteries tested, we chose the deviation values of the remaining capacity and internal resistance within 5% for the 80% SOH and 70% SOH, respectively. In Fig. 6a, all the tested batteries adopted the same CC–CV protocol, and it can be clearly seen that the voltage response curves exhibited an obvious inhomogeneity, even when the retired LFP batteries had a high consistency of capacity and resistance. At the same time, the inconsistent phenomenon became more serious with the decrease in SOH (as shown in Fig. 6b). The voltage inconsistency showed a typical characteristic, in which the charge voltage tended to rapidly climb to the upper limit voltage of 3.65 V and the discharge voltage showed an accelerated fall compared with a normal battery. As is well known, an energy storage system consists of a certain number battery modules, and a single battery module consists of numerous individual batteries; thus, the overall performance of a system or module can be significantly affected by a single battery. Therefore, the inhomogeneous voltage of a battery module could accelerate shortening the service life.31 This can even lead to an increased potential risk that the overcharge or overdischarge could induce thermal runaway accidents.
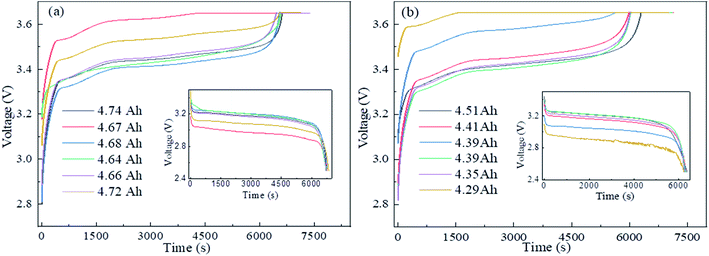 |
| | Fig. 6 The voltage response versus time of different SOHs of retired LFP batteries during charge–discharge processes: (a) 80% SOH and (b) 70% SOH. | |
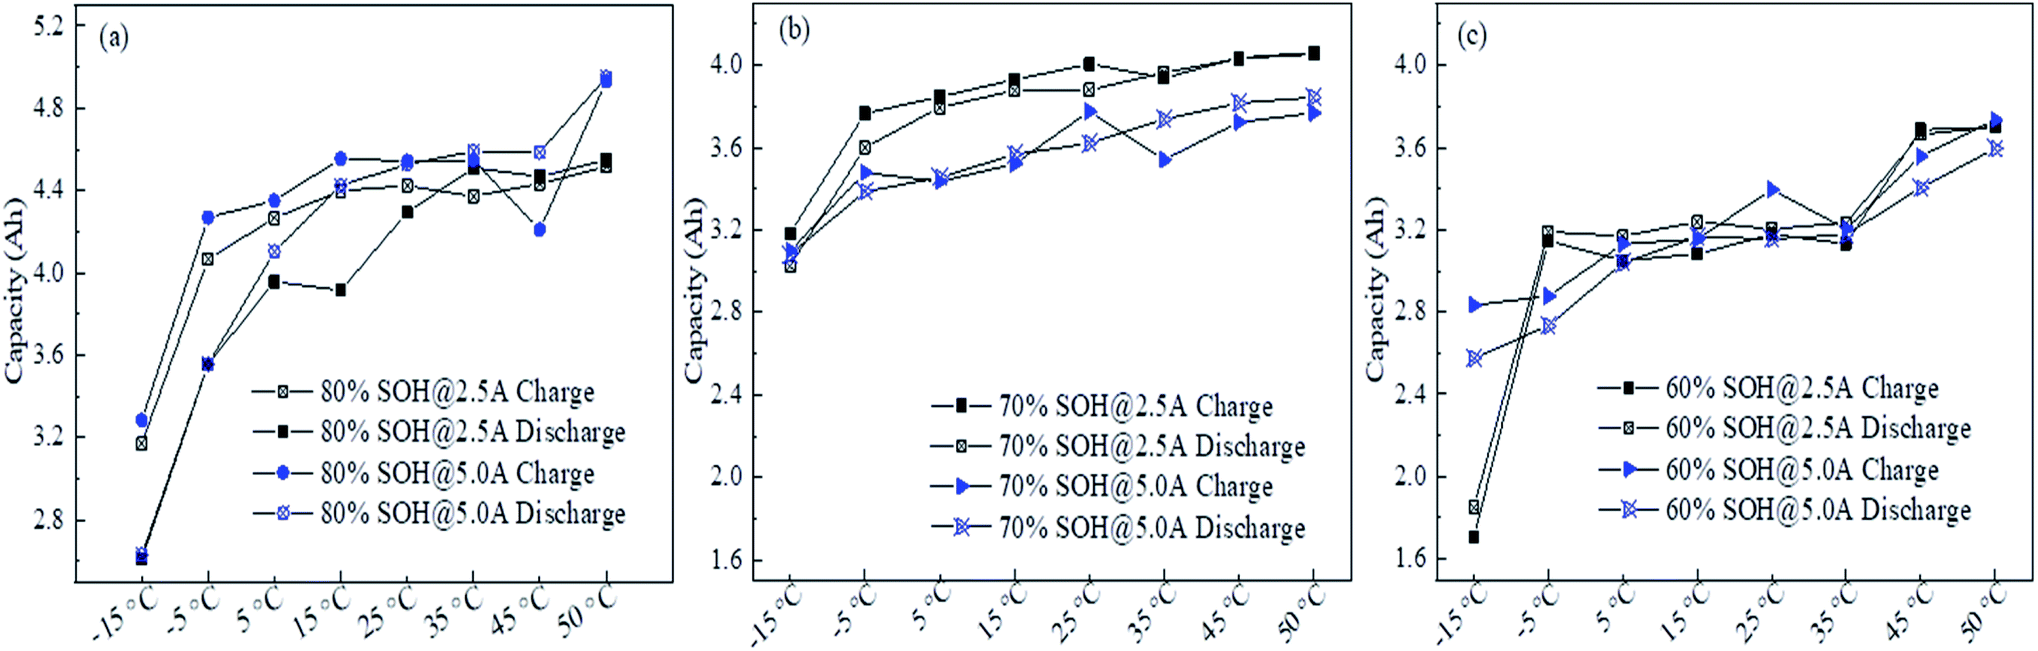
3.2.2 Temperature influences on the retired battery performance. To examine the impact of temperature on the electrochemical performance, the retired LFP batteries were tested under different temperature conditions ranging from −15 °C to 50 °C, and the capacity changes for charge/discharge under 2.5 A and 5.0 A are shown in Fig. 7. The charge/discharge capacity increased with the ambient temperature increase for different SOHs of the retired LFP batteries. In Fig. 7a, the retired LFP battery with 80% SOH showed an excellent consistency for charge capacity within the temperature range 5 °C to 45 °C, and the available capacity was closed to 4.4 A h even under a large current of 5.0 A. However, it could be obviously seen that the 70% SOH retired LFP battery revealed serious inconsistencies in the available capacity when the temperature increased from −15 °C to 50 °C, and the available capacity further declined at 5.0 A (as shown in Fig. 7b). When the SOH decreased to 60%, the available charge and discharge capacity of the retired LFP battery showed a good consistency in the temperature range from 5 °C to 35 °C, and the available charge and discharge capacity was not affected by the large current density (Fig. 7c). Moreover, the capacity charge/discharge of retired LFP batteries showed a slightly rise under high ambient temperature. This phenomenon could be attributed to the fact that an appropriate increase in temperature could stimulate the electrochemical performance of the electrode material within the battery. At the same time, a lower temperature was also found to affect the electrochemical performance of the electrode material. The charge capacities at 3.17, 3.18, and 1.71 A h were raised to 4.07, 3.76, and 3.15 A h for the 80%, 70%, and 60% SOH retired batteries when the temperature increased from −15 °C to −5 °C at a current of 2.5 A, respectively, which is a very beneficial capacity recovery. This result suggests that the retired LFP batteries would not meet the requirements for low temperature applications. Hence, an efficient and reasonable thermal management technology should be established to improve the temperature issue and avoid the failure of retired LFP batteries.32,33
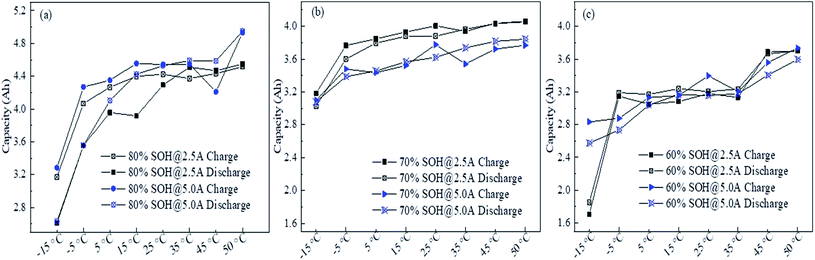 |
| | Fig. 7 The charge/discharge capacity tests under different ambient temperatures: (a) 80% SOH, (b) 70% SOH and (c) 60% SOH. | |
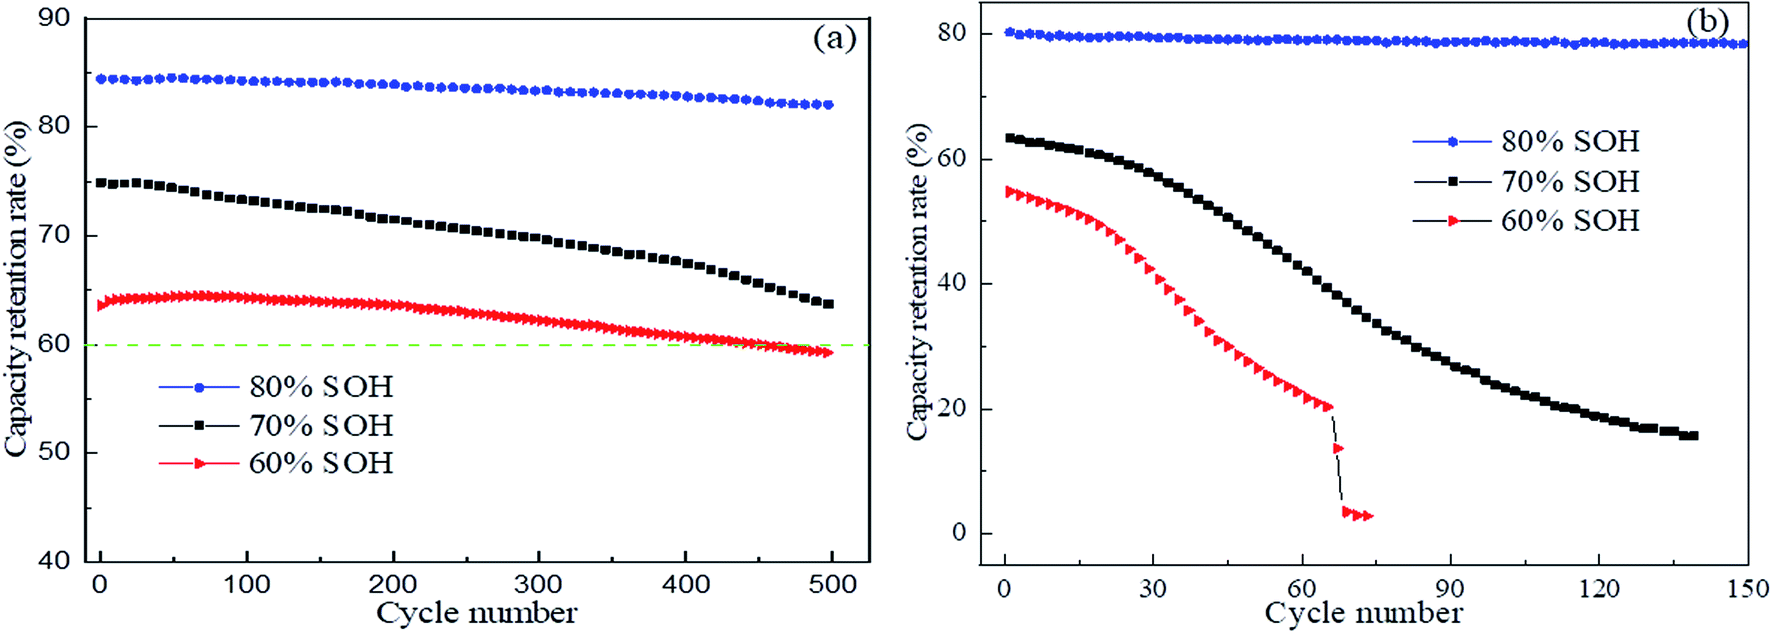
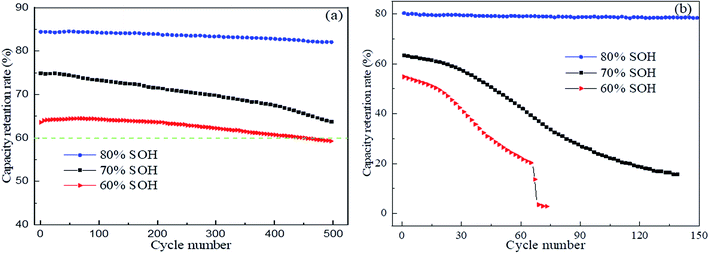
3.2.3 Cycle life tests. According to China's national battery testing standards for electric vehicles (GB/T 31484-2015), after 1000 times the power battery must show a capacity retention of no less than 80%. However, the retired LFP batteries capacity retention usually could be less than 80%, thus evaluating the remaining cycle life of retired LFP batteries is an important indicator for application in an energy storage system. In an energy storage system, the typical operating conditions are a small charge/discharge current and large depth of discharge. The cycle life test of different SOHs of the retired LFP batteries is displayed in Fig. 8. Fig. 8a shows the battery cycle life test with a charge and discharge current at 2.5 A, where it can be seen that the retired battery with an 80% SOH still had a high capacity retention ratio, as well as after cycle 500 times. However, the capacity retention continuously dropped for the retired batteries with a 70% and 60% SOH, respectively. The capacity fade was 2.3%, 11.2%, and 4.8% for the retired LFP batteries with 80% SOH, 70% SOH, and 60% SOH when cycled for 500 times afterward, respectively. This result implied that the retired LFP batteries exhibited a good cycle life under a small charge/discharge current. Fig. 8b shows the retired battery cycle tests for 150 times with a current of 5.0 A. The retired LFP battery with 80% SOH showed a stabilized capacity retention ability, but the capacity rapidly dropped during the high current charge/discharge process for the 70% and 60% SOHs retired LFP batteries. Compared with the small charge/discharge rate, the cycle life and capacity fade of the retired LFP batteries sharply deteriorated when increasing the large C rate, especially for the lower SOH batteries. The cycle life and capacity decay rate suggest that the retired LFP battery would not meet the requirements for high power gradient utilization.
 |
| | Fig. 8 Cycle tests of different SOHs of retired LFP batteries: (a) at 2.5 A and (b) at 5.0 A. | |
3.3 Micro-characteristic analyses of the retired LFP batteries
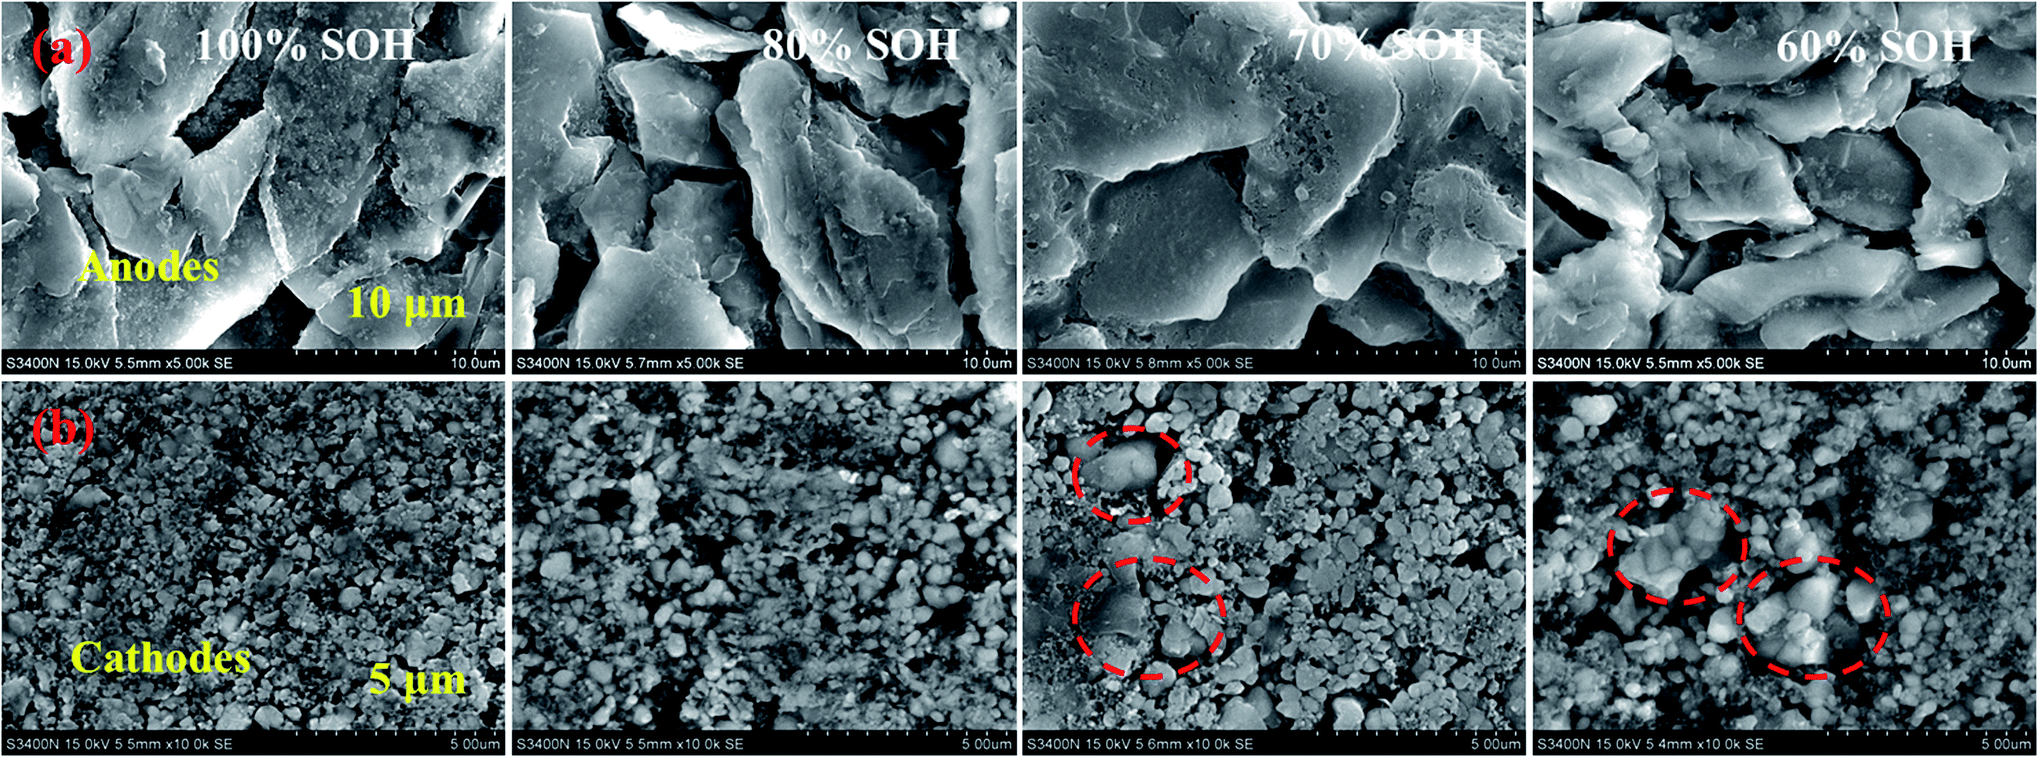
3.3.1 Electrode materials. To further explore the electrochemical performance degradation of the retired LFP batteries, SEM images of the anodes and cathodes materials with different SOHs were obtained, as shown in Fig. 9. In the anode materials (magnification 5k, scale is 1 μm), we can clearly see an obvious distribution of the stack holes in the reference LFP with 100% SOH (Fig. 9a). However, the graphite stacking holes gradually disappeared in the other retired LFP batteries, especially in the 60% SOH retired LFP battery, and the scattered sheets of graphite became integrated blocks due to the stack structure collapsing. It is well known that stack holes can imbed Li+ and provide a storage layer, which tends to influence the Li+ imbedding speed. In other words, when the holes are reduced, the storage capacity of the anode materials will show accelerated degradation. Furthermore, SEM images of the cathode materials with different SOHs were also obtained, as shown in Fig. 9b (magnification 10k, scale is 0.5 μm). In the reference battery, the LFP particles were uniformly dispersed without aggregation, which implied that the cathode materials demonstrated an excellent de-intercalation efficiency for Li+. Whereas, serious particle aggregation was observed in the cathode materials when the SOH declined, and the particle aggregation diameter sizes were 0.5, 1.25, and 2.5 μm for the 80% SOH, 70% SOH, and 60% SOH retired LFP batteries, respectively. These results imply that the particle aggregate size grows when the retired LFP has a lower SOH. The changes in the microstructure of the cathode and anode materials may be one of the reasons for the capacity decline of the retired LFP batteries.
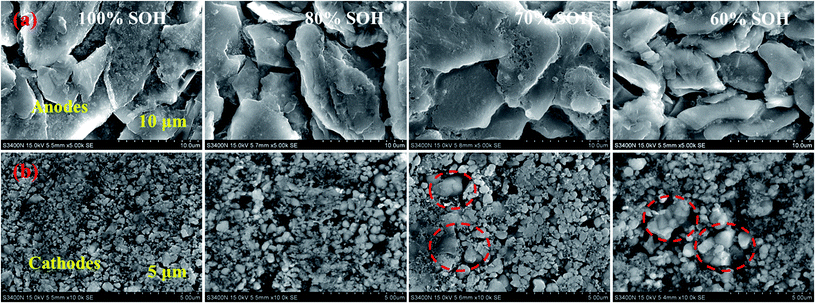 |
| | Fig. 9 SEM images of the cathode and anode materials with different SOHs: (a) anode materials and (b) cathode materials. | |
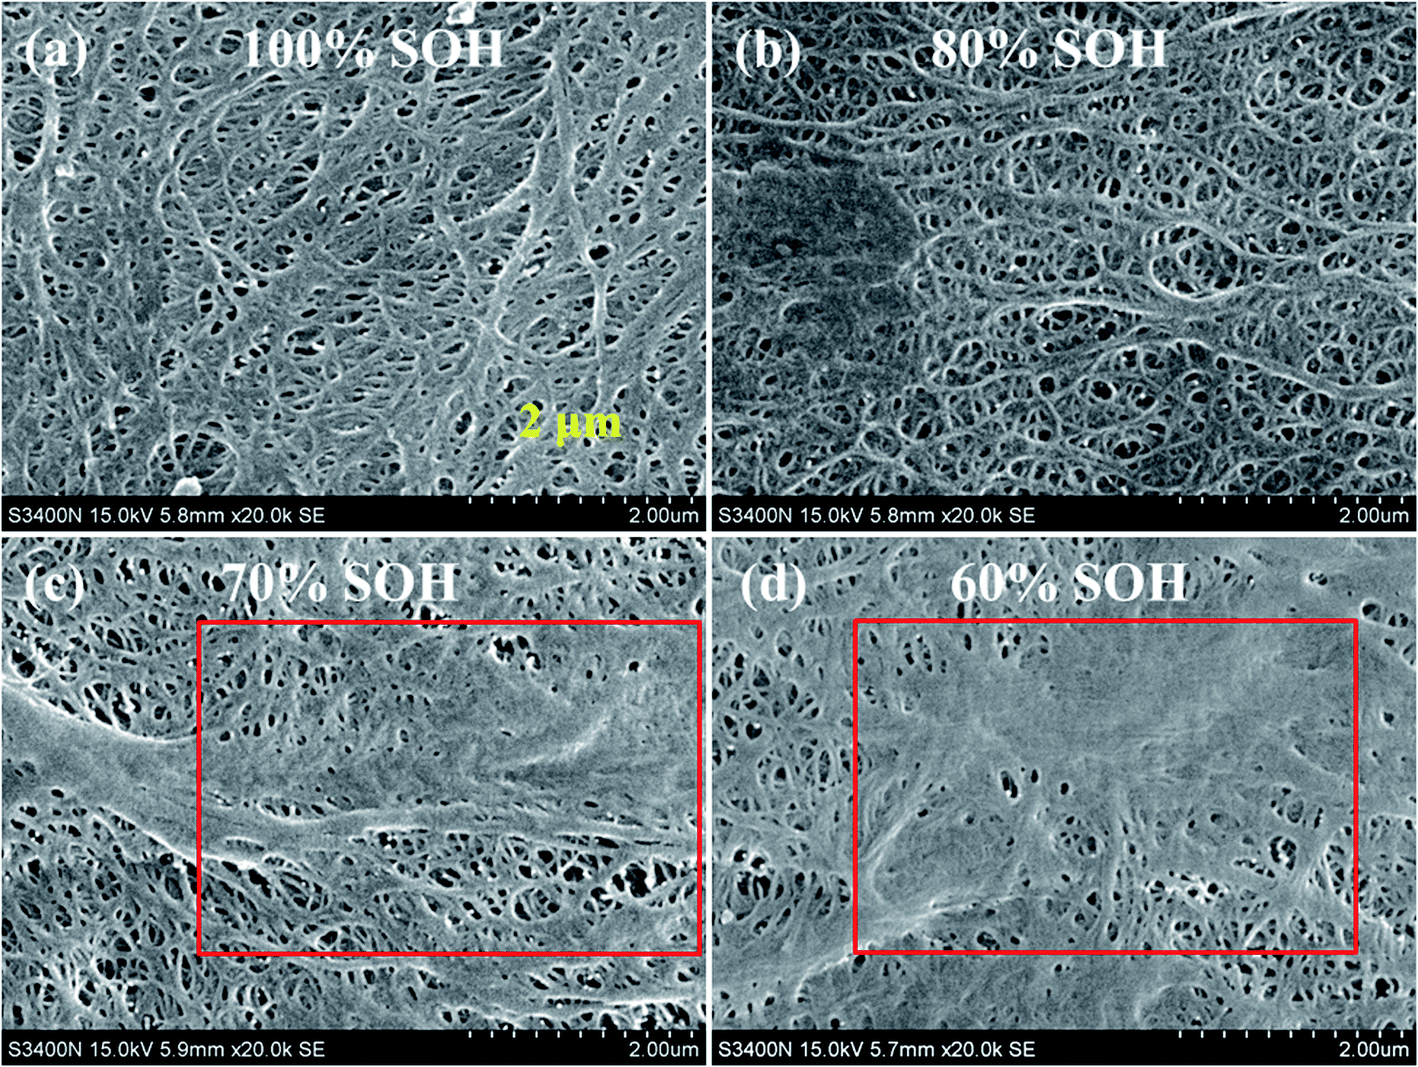
3.3.2 Separator characterization. The separator is another important component within a battery, and it can affect the diffusion rate of Li+ ions during the charging and discharging process. To further explore how the microstructure of separators change with the different SOHs, SEM images of the separator materials were also obtained, as shown in Fig. 10 (magnification 20k, scale is 0.2 μm). It can be clearly seen that numerous continuous pores were distributed in the separators from the SEM images (Fig. 10a), and these holes allowed Li+ to shuttle back and forth between the anode and cathode electrodes. However, the holes disappeared with a lower SOH of the retired LFP batteries. In Fig. 10c and d, it can be seen that the holes were clearly reduced in the separator, and dissolution began in the separator to become an integrated thin layer (as seen in the red wireframe). This result indicated that a separator without holes tends to impede ion diffusion in the electrolyte, as well as reduces the ion-diffusion speed. Based on the above-mentioned electrical characteristics findings, the retired LFP batteries showed a low rate of charge and discharge characterization, which may be caused by the closed pores of the separator.
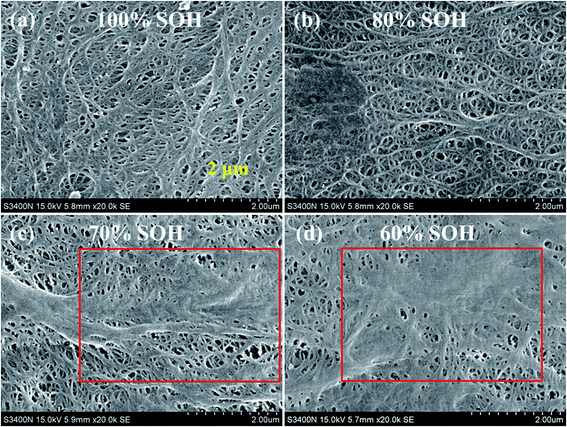 |
| | Fig. 10 SEM images of separators with different SOHs: (a) 100% SOH, (b) 80% SOH, (c) 70% SOH and (d) 60% SOH. | |
4 Conclusions
The utilization of these retired batteries is highly desirable from an economic and environmental viewpoint. However, the biggest challenge to the echelon application of retired power batteries is how to quickly and efficiently detect their remaining capacity, cycle life, charge–discharge performance, and temperature reliability. Herein, we systematically investigated the thermo-electric-electrochemical performance of retired LFP batteries, and the results that need to be considered are summarized in the following:
(1) The internal resistance of the retired LFP batteries showed a strong correlation with the remaining capacity. Therefore, we could quickly detect the internal resistance of the retired LFP batteries to roughly classify them, so as to develop different test processes to save testing time and cost.
(2) The evaluation of the remaining capacity of the retired LFP batteries was significantly affected by the test protocol, which implied that the test protocol should adopt a small test current and cut-off voltage.
(3) The retired LFP batteries showed a good cycle life under a lower charge/discharge rate, implying that they could feasibly meet the low power requirement for energy storage. Nevertheless, according to the effects of ambient temperature and voltage inconsistency, echelon utilization may potentially require more costs.
(4) The capacity fade and internal resistance increase of the retired LFP batteries may be attributed to the electrode material structure failure and separator dissolution. Eventually, the Li+-ion diffusion and de-intercalation rate rapidly declined during the charging/discharging process within the battery.
Author contributions
Youfu Lv: writing-review & editing, visualization, investigation, supervision, project administration. Weiming Luo: writing-original draft, experimental, data-processing, software. Ya Mo: experimental, data-processing. Guoqing Zhang: project administration, visualization.
Conflicts of interest
The authors declare that they have no known competing financial interests or personal relationships that could have appeared to influence the work reported in this paper.
Acknowledgements
This work was supported by the Science and Technology Project of Education Department of Hunan Province (20C0044), Guangdong Provincial Key Laboratory of Distributed Energy Systems (No. 2020B1212060075) and National Natural Science Foundation of China (NNSFC, 21875046).
References
- H. Byun, J. Shin and C.-Y. Lee, Energy, 2018, 144, 312–321 CrossRef.
- C. M. Costa, J. C. Barbosa, H. Castro, R. Gonçalves and S. Lanceros-Méndez, Renewable Sustainable Energy Rev., 2021, 151, 111548 CrossRef.
- K. Osieczko, D. Zimon, E. Placzek and I. Prokopiuk, J. Environ. Manage., 2021, 296, 113177 CrossRef PubMed.
- D. Burchart-Korol, S. Jursova, P. Folęga and P. Pustejovska, J. Cleaner Prod., 2020, 257, 120476 CrossRef.
- G. Zhong, K. Qu, C. Ren, Y. Su, B. Fu, M. Zi, L. Dai, Q. Xiao, J. Xu, X. Zhong, F. An, M. Ye, S. Ke, S. Xie, J. Wang, P. Gao and J. Li, Nano Energy, 2020, 74, 104876 CrossRef CAS.
- X. Wang, Y. Li, P. Das, S. Zheng, F. Zhou and Z.-S. Wu, Energy Storage Mater., 2020, 31, 156–163 CrossRef.
- Z. Su, C. Zhou, X. Gao, R. Cao, S. Yang and X. Liu, Rare Met., 2022, 41, 14–20 CrossRef.
- Y. Tang, Q. Zhang, Y. Li, H. Li, X. Pan and B. McLellan, Appl. Energy, 2019, 251, 113313 CrossRef.
- S. Saxena, C. Le Floch, J. MacDonald and S. Moura, J. Power Sources, 2015, 282, 265–276 CrossRef CAS.
- R. Planteu, A. W. Golubkov, P. Krohn, B. Rasch, B. Brunnsteiner, A. Thalera and V. Hacker, RSC Adv., 2018, 8, 40172–40186 RSC.
- X. Lai, Y. Huang, C. Deng, H. Gu, X. Han, Y. Zheng and M. Ouyang, Renewable Sustainable Energy Rev., 2021, 146, 111162 CrossRef CAS.
- R. Jing, J. Wang, N. Shah and M. Guo, Advances in Applied Energy, 2021, 1, 100002 CrossRef.
- Y. Hua, S. Zhou, Y. Huang, X. Liu, H. Ling, X. Zhou, C. Zhang and S. Yang, J. Power Sources, 2020, 478, 228753 CrossRef CAS.
- S. Chen, A. Ran, S. Zhang, S. Liu, Z. Zhou, P. Nie, K. Qian, L. Fang, S. Zhao, B. Li, F. Kang, X. Zhou, H. Sun, X. Zhang and G. Wei, RSC Adv., 2020, 10, 19117–19123 RSC.
- F. A. Kayakool, B. Gangaja, S. Nair and D. Santhanagopalan, Sustainable Mater. Technol., 2021, 28, e00262 CrossRef CAS.
- S. Windisch-Kern, E. Gerold, T. Nigl, A. Jandric, M. Altendorfer, B. Rutrecht, S. Scherhaufer, H. Raupenstrauch, R. Pomberger, H. Antrekowitsch and F. Part, Waste Manage., 2022, 138, 125–139 CrossRef CAS PubMed.
- E. Fan, L. Li, Z. Wang, J. Lin, Y. Huang, Y. Yao, R. Chen and F. Wu, Chem. Rev., 2020, 120, 7020–7063 CrossRef CAS PubMed.
- T. Yang, L. Li and Z. Li, RSC Adv., 2021, 11, 24132–24136 RSC.
- Y. Zhang, Y. Li, Y. Tao, J. Ye, A. Pan, X. Li, Q. Liao and Z. Wang, Energy, 2020, 193, 116555 CrossRef.
- X. Lai, C. Deng, J. Li, Z. Zhu, X. Han and Y. Zheng, IEEE Trans. Veh. Technol., 2021, 70, 1246–1254 Search PubMed.
- Y. Ni, J. Xu, C. Zhu and L. Pei, Appl. Energy, 2022, 305, 117922 CrossRef CAS.
- N. Yan, H. Zhao, T. Yan and S. Ma, Energy Rep., 2020, 6, 1106–1113 CrossRef.
- Y. Jiang, J. Jiang, C. Zhang, W. Zhang, Y. Gao and N. Li, J. Cleaner Prod., 2018, 205, 754–762 CrossRef CAS.
- S. J. Tong, A. Same, M. A. Kootstra and J. W. Park, Appl. Energy, 2013, 104, 740–750 CrossRef CAS.
- N. Omar, M. A. Monem, Y. Firouz, J. Salminen, J. Smekens, O. Hegazy, H. Gaulous, G. Mulder, P. Van den Bossche, T. Coosemans and J. Van Mierlo, Appl. Energy, 2014, 113, 1575–1585 CrossRef CAS.
- P. Zhou, Z. He, T. Han, X. Li, X. Lai, L. Yan, T. Lv, J. Xie and Y. Zheng, Energy Rep., 2020, 6, 672–683 CrossRef.
- X. Lai, C. Deng, X. Tang, F. Gao, X. Han and Y. Zheng, J. Cleaner Prod., 2022, 339, 130786 CrossRef CAS.
- Z. Xu, J. Wang, P. D. Lund, Q. Fan, T. Dong, Y. Liang and J. Hong, J. Energy Storage, 2020, 29, 101303 CrossRef.
- Q. Yu, R. Xiong, R. Yang and M. G. Pecht, Appl. Energy, 2019, 255, 113817 CrossRef.
- Z. Zhou, A. Ran, S. Chen, X. Zhang, G. Wei, B. Li, F. Kang, X. Zhou and H. Sun, J. Energy Storage, 2020, 31, 101739 CrossRef.
- S. Yang, R. He, Z. Zhang, Y. Cao, X. Gao and X. Liu, Matter, 2020, 3, 27–41 CrossRef.
- W. Wu, S. Wang, W. Wu, K. Chen, S. Hong and Y. Lai, Energy Convers. Manage., 2019, 182, 262–281 CrossRef.
- C. Wu, Z. Wang, Y. Bao, J. Zhao and Z. Rao, J. Energy Storage, 2021, 41, 102882 CrossRef.
|
| This journal is © The Royal Society of Chemistry 2022 |
Click here to see how this site uses Cookies. View our privacy policy here. 
 Open Access Article
 This Open Access Article is licensed under a Creative Commons Attribution-Non Commercial 3.0 Unported Licence