
 Open Access Article
 This Open Access Article is licensed under a Creative Commons Attribution-Non Commercial 3.0 Unported Licence
Effects of Ti-doping amount and annealing temperature on electrochromic performance of sol–gel derived WO3†
Hee Sung Parkab,
Sunghyeok Park ac,
Seung Han Songab,
Thuy Thi Daoac,
Hung Van Tranac,
Seok In Leead,
Chi-Hwan Han*a,
Churl Hee Cho*b and
Sungjun Hong*a
ac,
Seung Han Songab,
Thuy Thi Daoac,
Hung Van Tranac,
Seok In Leead,
Chi-Hwan Han*a,
Churl Hee Cho*b and
Sungjun Hong*a
aPhotovoltaic Laboratory, New and Renewable Energy Research, Korea Institute of Energy Research, 152 Gajeong-ro, Yuseong-gu, Daejeon 34125, Republic of Korea. E-mail: hanchi@kier.re.kr; jjunnii@kier.re.kr
bDepartment of Energy Science and Technology, Chungnam National University, 99 Daehak-ro, Yuseong-gu, Daejeon 35015, Republic of Korea. E-mail: choch@cnu.ac.kr
cRenewable Energy Engineering, University of Science and Technology, 217, Gajeoung-ro, Yuseong-gu, Daejeon 34113, Republic of Korea
dDepartment of Chemistry, Korea University, Seoul 02741, Republic of Korea
First published on 13th June 2022
Abstract
Fine control of structural and morphological features in electrochromic materials is of paramount importance for realizing practical electrochromic devices (ECDs), which can dynamically adjust indoor light and temperature of buildings. To this end, herein we investigate impacts of two variants such as Ti-doping amount and the annealing temperature on physical and chemical properties of sol–gel derived electrochromic WO3 films. We use a wide range of titanium coupling agents (TCAs) as Ti-dopants ranging from 0 wt% to 20 wt% and vary the annealing temperature between 200 °C and 400 °C with 50 °C interval. Both variants greatly influence the physical properties of the resulting WO3 films, resulting in different crystallinities and morphologies. Through complementary analytical techniques, we find that the WO3 film featuring an amorphous phase with nano-porous morphology enhances the electrochemical and electrochromic performances. The specific TCA used in this study helps stabilize the amorphous WO3 structure and generate the nano-pores during the following thermal treatment via its thermal decomposition. As a result, the WO3 film having an optimal 8 wt% TCA annealed at 300 °C shows a high optical density of 73.78% in visible light (400–780 nm), rapid switching speed (tc = 5.12 s and tb = 4.74 s), and high coloration efficiency of 52.58 cm2 C−1 along with a superior cyclic stability. Thus, understanding a structure–property relationship is of paramount importance in engineering the advanced electrochromic WO3 for use in practical ECDs and other optoelectronic applications.
1. Introduction
Electrochromism1,2 is a phenomenon in which optical characteristics such as transmittance and reflectivity are reversibly modulated by inducing an electrochemical reaction of a material through the application of an external potential or current. Electrochromic materials can be mainly divided into two categories depending on their color change mechanism:3 cathodically coloring materials that cause coloration during a reduction reaction and anodically coloring materials that induce coloration during an oxidation reaction. Among various electrochromic materials, inorganic metal oxides have received intense interest due to their high electrochemical and thermal stability.4–6 The transition metal oxides including tungsten,7 titanium,8,9 molybdenum,10 and niobium11,12 have been widely employed as cathodic electrochromic materials while nickel13 and iridium-based metal oxides14 have been extensively investigated as anodic counterparts. Tungsten oxide (WO3) has been considered as one of the prototypical cathodic electrochromic materials owing to its highest coloration efficiency, lowest price, and chemical stability.7,15 The coloration process of WO3 can be denoted as the reaction equation below.16| WO3 (transparent) + xM+ + xe− ↔ MxWO3 (dark blue) | (1) |
Doping has been extensively exploited to improve the electrochromic characteristics of the WO3 film formed by the sol–gel method.36–39 Among various dopants, titanium (Ti) has been frequently used as dopant in WO3 lattice.25,40–44 For example, K. Paipitak et al. doped WO3 with Ti to increase the d-spacing of WO3 and also decreased its crystallinity, thereby inducing the improvement of the reversibility as well as the electrochromic characteristics of WO3.45 It is also well known that porous morphologies of the electrochromic materials could help improve the reaction rate and coloration efficiency by promoting electrolyte penetration and shortening the ion diffusion path within the host materials.3,20,28,46 Recently, we demonstrated that 8 wt% TCA (titanium coupling agent) doped WO3 formed a porous WO3 film via a decomposition of TCA under thermal treatment above at 250 °C.25 Moreover, we also found that TCA helped retard the crystallization of WO3, thus enhancing diffusion of Li ions and electrons in the WO3 lattice.
In this study, we aimed to further optimize the amount of TCA dopant by varying its concentration in a much wider range from 0 to 20 wt% and by more finely controlling thermal treatment temperatures between 200 and 400 °C at 50 °C intervals, and investigated their combined effects on the morphologies and crystallinities as well as the electrochromic properties of the resulting WO3 films. It was found that the 8 wt% TCA-doped WO3 annealed at 300 °C showed the best electrochromic performances with fast switching rates (coloring time of 5.12 s/bleaching time of 4.74 s), and a coloration efficiency of 52.58 cm2 C−1, along with a superior cyclic stability. These electrochromic results are well-correlated with its beneficial structural and morphological features induced by the optimal TCA concentration and thermal treatment, resulting in both almost balanced charge capacity and charge transfer kinetics during electrochemical reaction. The use of unoptimized TCA concentration and thermal treatment yielded the WO3 films with inferior electrochromic performances. The WO3 films having TCA less than the optimized concentration showed the less pore density with an increased tendency to be crystallized at higher annealing temperature, resulting in reduced charge capacity and charging rate. In contrast, the WO3 films having TCA beyond the optimized concentration showed the comparable or even higher charge capacity compared with the optimized one, but never reached to the balanced charging rate, leading to poor cyclic stability. Thus, the present findings demonstrate a simple way in finely controlling physical and chemical properties of the sol–gel derived electrochromic WO3 films via a judicious selection of dopant concentration and thermal treatment condition. More importantly, understanding a structure–property relationship of electrochromic materials is critical in advancing electrochromic technology toward real application.
2. Experimental section
2.1 Materials
Hydrogen peroxide (H2O2, 34.5%), glacial acetic acid (C2H4O2, 99.75%) were purchased from Samcheon Chemical. Tungsten powder (monocrystalline, 0.6–1 μm) (W, 99.9%, 510106), lithium perchlorate battery grade, dry LiClO4 (99.99%, 634565), propylene carbonate (C2H6O3, 99.7%, anhydrous) were purchased from Sigma-Aldrich (Korea). Ethanol, absolute for analysis (C2H6O, ACS, ISO, Reag. Ph Eur, 100983) was purchased from Merck (Germany). Tetraisopropyl-di(dioctylphosphate)titanate (KH-401) (C44H98O10P2Ti, 29310000) was purchased from TiLink (China). Fluorine doped tin oxide (FTO) glass was purchased from Pilkington (UK).2.2 Synthesis of acetylated-peroxotungstic acid (A-PTA)
In a 1000 mL round bottom flask, 100 mL of 34.5 wt% hydrogen peroxide was mixed with 10 mL of de-ionized water and was cooled to 0 °C with stirring. After cooling, 16 g of tungsten metal powder (99.9%, Sigma-Aldrich) were added in a small portion by solid dispenser to keep the reaction temperature under 5 °C due to the exothermic reaction. The clear yellow solution was obtained after 24 h stirring. The mixture was filtered to eliminate any unreacted tungsten powder. The filtrates was mixed with 100 mL glacial acetic acid and heated at 55 °C for 12 h in a flask with a reflux condenser. After that, the solutions were turned to transparent. After removing the solvent by a rotary evaporator at 60 °C, a white solid was obtained. The 100 g of the product was dissolved 1000 mL of anhydrous ethanol and stirred at room temperature for 3 days and filtered again. In the end, the solvent was removed by rotary evaporation at 40 °C to yield A-PTA.2.3 Deposition of WO3 film
10 g of A-PTA was dissolved in 30 mL of anhydrous ethanol solvent and stirred for 1 h at room temperature. The solution was pale yellow solution, called as reference solution for WO3 film. Titanate coupling agent (KH-401, TCA) was added to the reference solution at different ratios (0–20 wt%). The mixture was stirred for 2 h. The solution changed from pale yellow to orange color. The FTO substrates were cut into 2.5 cm × 2.5 cm size and cleaned by sonication in deionized water, ethanol and acetone, sequentially. The cleaned substrates were dried in a dry oven at 100 °C for 30 min. The TCA non-doped or doped WO3 precursor solutions were spin-coated on the cleaned FTO substrates at 2000 rpm for 30 s and subjected to predried at 100 °C for 30 min. Finally, the films were annealed at 200, 250, 300, 350 and 400 °C at the rate of 5 °C min−1 for 1 h.2.4 Characterization of the WO3 films
The thickness and morphology of the WO3 films were analyzed by scanning electron microscope (SEM, Hitachi, S-4800). The crystal structure was evaluated by X-ray diffraction (XRD, Rigaku Japan, D/MAX-2500 with a CuKα, radiation source, λ = 1.5406 Å, at 40 kV, 100 mA, 5° min−1 of scan speed). The elemental composition of the WO3 films were investigated by energy dispersive X-ray spectrometer (EDS, Bruker Quantax 200). Electrochemical properties were measured with a three-electrode electrochemical cell using Potentiostat (BioLogic, VSP). 1.0 M LiClO4 in propylene carbonate was used as an electrolyte and as-deposited films on FTO, Ag/AgCl, and Pt wire were used as working, reference, and counter electrode, respectively. Cyclic voltammetry (CV) measurements were performed at various scan rate (10, 20, 30, 40 and 50 mV s−1) and the voltage range was −1 V to 0.8 V. The optical properties of the WO3 films were investigated by using a UV-vis spectrophotometer (Ocean Optics, DH-2000-BAL) while measuring 20 cycles chronoamperometry (CA) with 30 s for coloring (−1.0 V) and 30 s for bleaching (+0.8 V). In addition, 100 CA cycles were conducted under the same conditions for long-term stability evaluation.3. Results and discussion
To investigate the effects of added amounts of TCA and heat treatment temperature on the morphologies of the resultant WO3 films, we performed scanning electron microcopy (SEM) measurements. The surfaces and cross-sectional SEM images of various WO3 films are shown in Fig. 1 and S1 in ESI.† Hereinafter, the sample names are denoted like xTi-WO3-y in which x refers to the weight percent of TCA added and y refers to the annealing temperature. For example, the 0Ti-WO3-200 means the neat WO3 film without TCA annealed at 200 °C. Fig. 1a shows SEM images of the 0Ti-WO3-200 film, which reveals homogeneous and dense morphology with a thickness of 372 nm without any noticeable crystalline particles. This morphological feature remains almost unchanged up to 250 °C. As the annealing temperature increased above 250 °C, the gradual morphological changes in 0Ti-WO3 films were observed. As shown in Fig. 1c, the 0Ti-WO3-300 exhibits an appearance of sub-grains along with the amorphous phase. When the annealing temperature was further increased to 350 °C as shown in Fig. 1d, the 0Ti-WO3-350 sample was transformed to crystalline phase with clear grain boundary. The sizes of grains increase as the temperature increases. These results are in line with our previous finding that the neat WO3 underwent the gradual transformation from amorphous to crystalline phase as the annealing temperature increased.25 The addition of different amounts of TCA markedly influenced the morphologies of the resulting WO3 films. The 4Ti-WO3 shows almost similar behaviors to those of 0Ti-WO3 in all investigated annealing temperatures as shown in Fig. S1† (see the top low) except for the slight increase for initiating the crystallization of WO3 above 300 °C and generation of porous structure at higher temperature. As the amounts of TCA dopants increased above 8 wt%, we clearly noticed the formation of porous morphologies in WO3 films in particular at 250 °C annealing temperature, where the size and distribution of the pore increased as the amounts of TCA increased (see Fig. 1 and S1†). This porous network promotes ion migration during electrochemical reaction, thereby improving the electrochromic properties of the WO3 films. Pore formation in TCA-doped WO3 films is closely related with the thermal decomposition of TCA around at 260 °C.47 When the annealing temperature raised to 300 °C, pores were removed and the loosely-connected and bumpy-like surface was observed in all of WO3 films containing more than 8 wt% TCA. At 350 °C annealing temperature, the 8 or 12Ti-WO3-350 films clearly showed the small particles on the surfaces, indicating formation of crystalline WO3 nanoparticles, which were absent when TCA was increased over 12 wt%. The size of crystalline WO3 nanoparticles in 8Ti-WO3 was enlarged at 400 °C annealing temperature. This result indicates the beneficial effect of Ti-doping on inhibiting the crystallization of WO3. However, adding excess Ti-dopant caused the adverse impact on the WO3 morphology such as cracks observed in xTi-WO3 (x ≥ 12) when subjected to thermal treatment above 350 °C. Hence, fine controls of Ti-dopant amounts and the thermal treatment condition are very critical in generating desired electrochromic films via sol–gel route.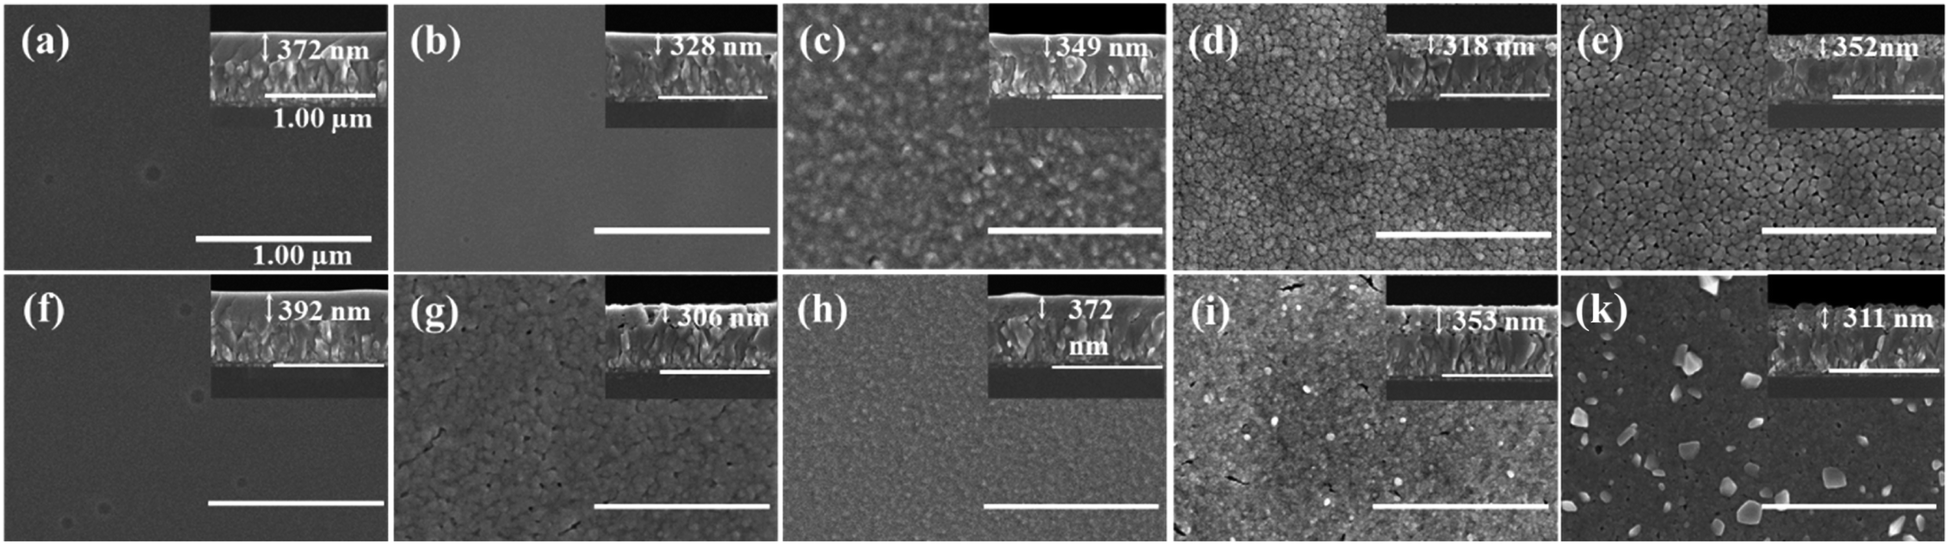 | ||
| Fig. 1 SEM surface and cross-sectional images of (top) 0Ti-WO3 and (bottom) 8Ti-WO3 films annealed at 200, 250, 300, 350 and 400 °C from left to right, respectively. | ||
To investigate the effects of TCA amounts and annealing temperatures on the crystalline properties of the WO3 films, X-ray diffraction (XRD) analyses were performed. Fig. 2 displays the XRD patterns of various WO3 films annealed at 200, 300 and 400 °C, while the others are shown in Fig. S2.† As shown in Fig. 2 and S2,† the 0Ti-WO3 films remain as amorphous phase up to 250 °C without any discernible diffraction peaks except for peaks from FTO substrate. Upon further increase of annealing temperature to 300 °C, the 0Ti-WO3 was crystallized with the clearly observable diffraction peaks at 2θ = 23.1°, 23.58°, and 24.32°, which could be indexed as (002), (020), and (200) plane of monoclinic WO3 (JCPDS no. 83-0950).25,48 The intensities of these peaks increase with the annealing temperature. Accordingly, we calculated the crystallite sizes by Scherrer equation; 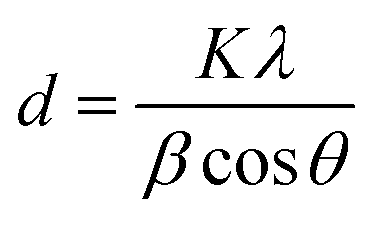 , where d is crystallite size (nm), K is Scherrer constant, β is the full width of the peak at half maximum intensity (FWHM), λ is the wavelength of X-ray (nm) and θ is the diffraction angle. The calculated crystallite size at the most intense peak at 2θ = 22.3° is 42.46 nm for 0Ti-WO3-300, 44.12 nm for 0Ti-WO3-350 and 47.34 nm for 0Ti-WO3-400, supporting the linear dependence of grain sizes of the WO3 on the annealing temperature. With incremental addition of TCA dopants, the crystallization temperature of WO3 films also increases. The crystallization temperature was found to be 350 and 400 °C for 4Ti-WO3 and 8Ti-WO3, respectively. At above 8 wt% of TCA, all WO3 films retain amorphous phases regardless of the annealing temperatures investigated in this study. These results reinforce our previous finding that Ti-doping effectively retarded the crystallization of WO3 frameworks.25 To understand the compositional variation of the WO3 films with TCA amounts, EDS analyses for xTi-WO3-300 samples were conducted considering that the thermal decomposition temperature of TCA is about 260 °C. As shown in Fig. S3,† the atomic ratio of P to W linearly increased as the TCA amount. Interestingly, Ti species were only observed above 16 wt% TCA. These results can be ascribed to the preferential migration of P species containing in TCA to the surface of the WO3 film during the annealing process, which obscured the detection of Ti species. That is, the Ti species would be mainly located in the bulk WO3. This result is consistent with our previous report.25
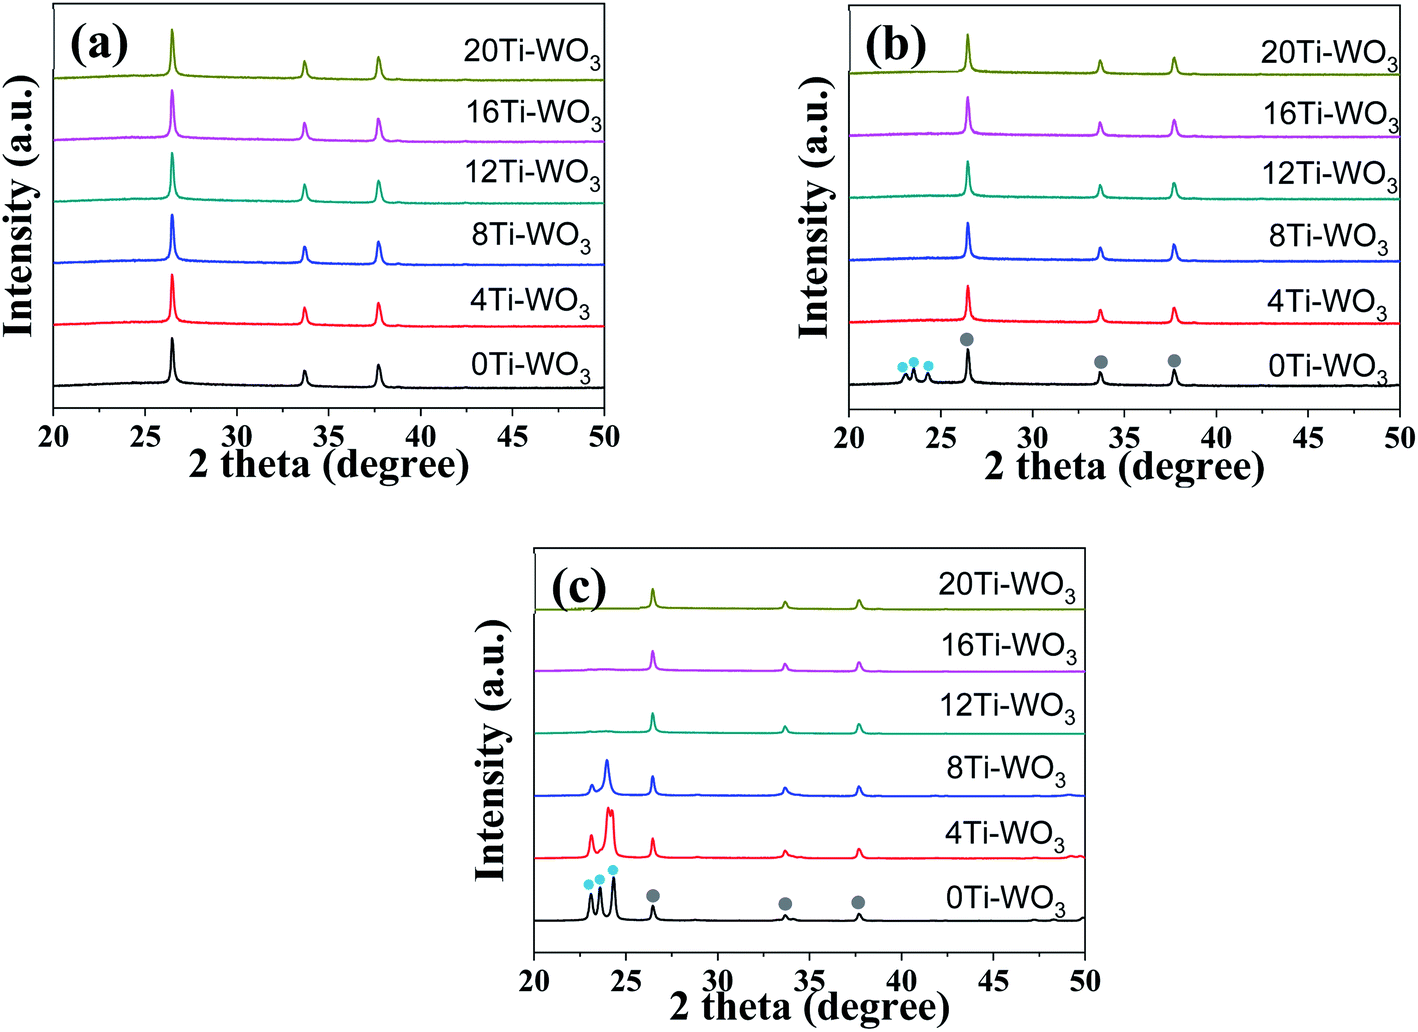 | ||
| Fig. 2 XRD patterns of neat and respective TCA doped WO3 films annealed at (a) 200, (b) 300, and (c) 400 °C. (The light blue and grey circles refer to monoclinic WO3 and FTO substrate, respectively.) | ||
In order to understand how the changes of morphological and crystalline properties of different WO3 films induced by TCA amounts and the annealing temperature affect their electrochemical performances, CV measurements were conducted at a scan rate of 10 mV s−1 in a voltage range of −1.0 to 0.8 V. While the representative cyclic voltammograms of WO3 films annealed at different temperatures are shown in Fig. S4,† the extracted charge densities and their ratios are presented in Fig. 3. All WO3 films show the good charge density ratios between 0.90 and 0.984. However, the absolute charge densities and their variations are significantly influenced depending on TCA amounts and annealing temperatures. The 0Ti-WO3 films show the charge density values between 7.45 and 20.86 mC cm−2, which are significantly lower compared with other TCA-doped WO3 films, indicating the poor electrochemical activities of neat WO3 films. With addition of TCA additives, all WO3 films reach the highest charge density values between 300 and 350 °C annealing temperature. Among WO3 films, the 8Ti-WO3-300 has the highest inserted (qin) and extracted (qout) charge density value of 46.7 and 45.1 mC cm−2.
 | ||
| Fig. 3 Calculated charge densities during insertion (qin) and extraction (qout) as well as charge density ratio (i.e. qout/qin) for (a) 0Ti-WO3, (b) 4Ti-WO3, (c) 8Ti-WO3, (d) 12Ti-WO3, (e) 16Ti-WO3, and (f) 20Ti-WO3, respectively. | ||
At the same annealing temperature of 300 °C, further increases in the amount of TCA above 8 wt% led to partial loss in the charge density to around 40 mC cm−2. For the 4Ti-WO3 and 8Ti-WO3 films, the annealing temperature above 300 °C resulted in the rapid decrease in the charge density, which might be associated with the partial crystallization of WO3 (see Fig. 2 and S2†). Although the WO3 films remained as amorphous phases beyond 8 wt% TCA at all invested annealing temperature as mentioned previously, the charge density values at 400 °C annealing temperature increased. This probably originated from the cracks formed at this temperature (see Fig. S1†).
To gain more insights on the different electrochemical behaviors of various WO3 films, we calculated the diffusion coefficient values during insertion and extraction processes. Anodic and cathodic peak current density (jpa and jpc) show a linear dependence on the square root of the scan rate (v1/2) as shown in Fig. S5,† indicating that the insertion and extraction of lithium ion in and out of the WO3 films is controlled by infinite diffusion process according to Randles–Sevcik equation.49
| ip = 2.69 × 10⁵C0D1/2n3/2ν1/2 | (2) |
Then, we investigated how the electrochemical properties of the WO3 films were reflected in their electrochromic performances. To this end, the in situ transmittance variations of the WO3 films were monitored while recording CV measurements at a scan rate of 50 mV s−1 in a voltage range of −1.0 to 0.8 V. The Fig. 4 shows the results measured during the bleaching processes after the xTi-WO3-300 films were colored at −1.0 V. The results for the WO3 films annealed at different temperatures are shown in Fig. S7–S10.† We also presented the UV-vis spectra of the WO3 films measured before any external voltages were applied (called as pristine state), which were shown in Fig. S11.† All of the TCA doped WO3 films at their pristine states have a lower transmittance value between 400 and 700 nm compared with that of the non-doped WO3 films, in particular when annealed below at 300 °C, presumably due to the pink-colored TCA dopants. Increasing the annealing temperature above 300 °C greatly enhances the transmittance in this region, supporting the thermal decomposition of TCA dopants.
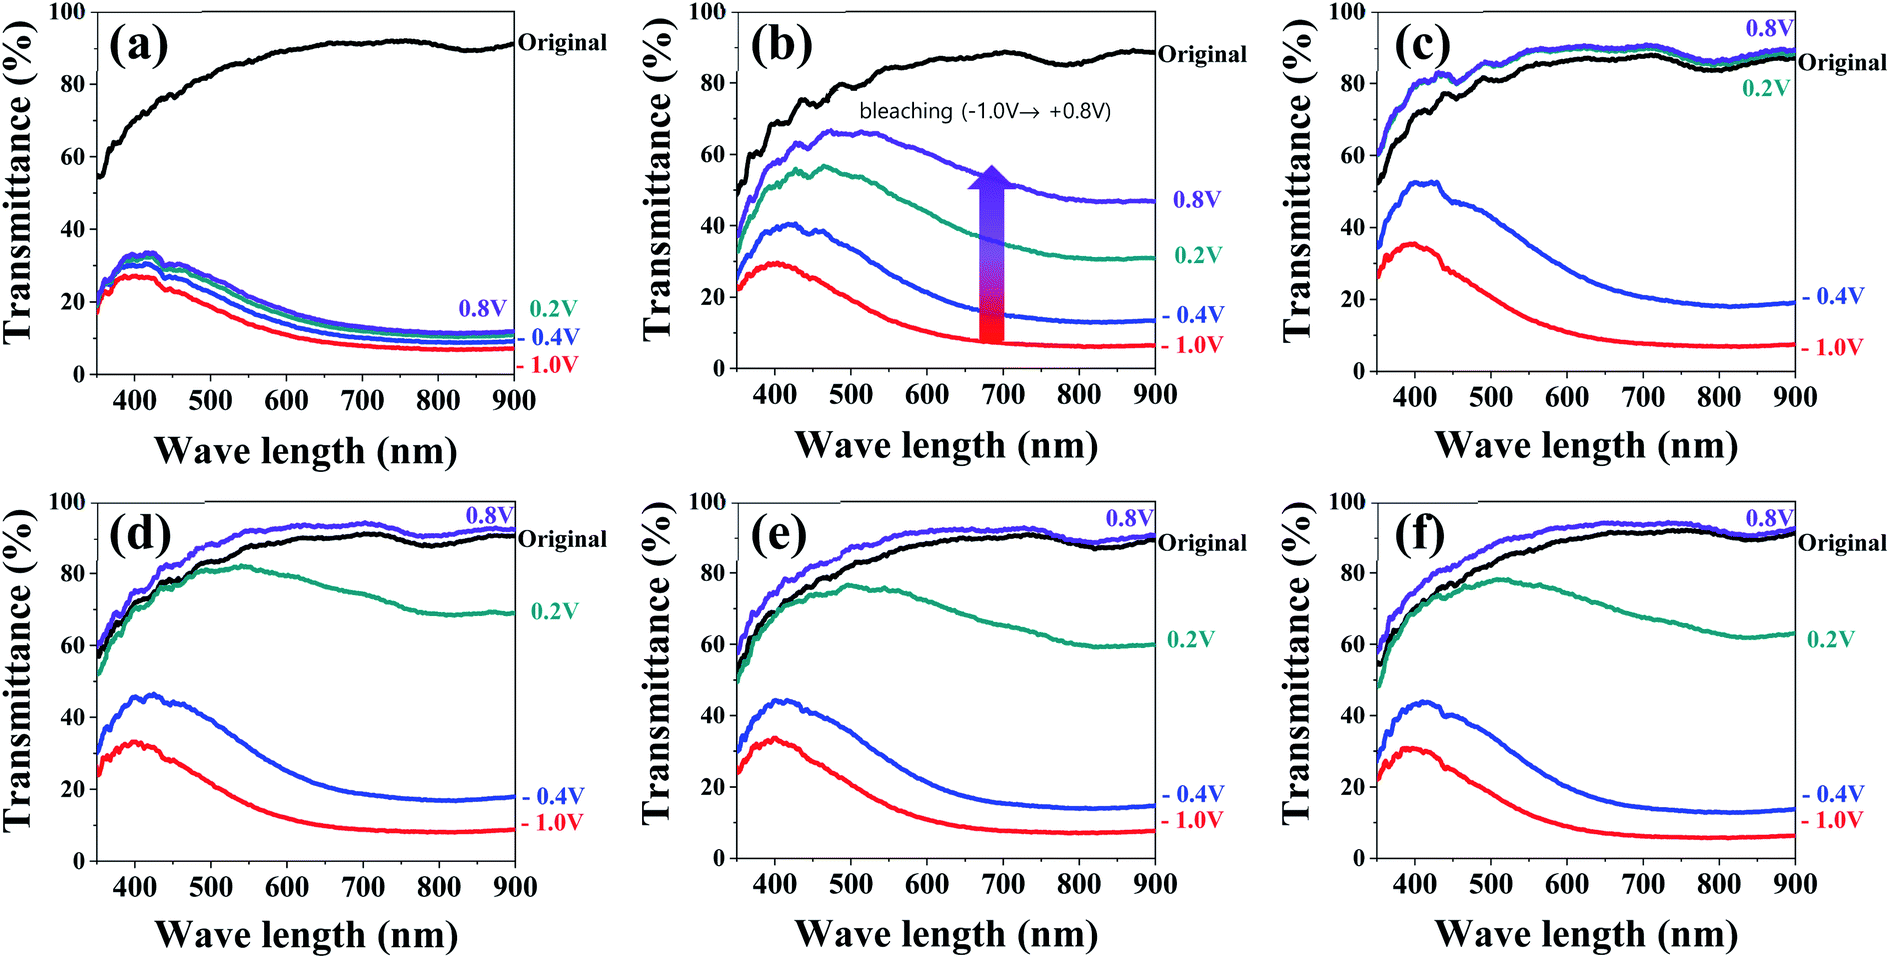 | ||
| Fig. 4 In situ UV-visible transmittance variations during bleaching processes of xTi-WO3-300 after fully colored at −1.0 V for (a) 0Ti-WO3-300, (b) 4Ti-WO3-300, (c) 8Ti-WO3-300, (d) 12Ti-WO3-300, (e) 16Ti-WO3-300, and (f) 20Ti-WO3-300, respectively. | ||
As shown in Fig. 4a, the 0Ti-WO3 shows the comparable transmittance variation during coloring process with 72.68 and 83.7% of ΔT(Tp − Tc) at 550 and 800 nm in which Tp and Tc refer to the transmittance value at the pristine and colored state with those of TCA doped WO3 films. However, it exhibits the poorest reversibility with only 7.54 and 4.7% of ΔT(Tb − Tc) at the identical wavelengths (Tb denotes the transmittance value at the bleached state), suggesting that a significant amounts of inserted charges were trapped in WO3 matrix or the sluggish reaction kinetic of lithium diffusion inhibited the full extraction of inserted ions (five time faster scan rate of 50 mV s−1 was used for in situ transmittance measurement compared to 10 mV s−1 used in CV measurements, see Fig. 3). The addition of TCA greatly improved the optical reversibility of the WO3 films. The WO3 films having more than 8 wt% TCA fully recover their original transmittance values during the bleaching process. More importantly, the 8Ti-WO3-300 already reached its pristine state even at +0.2 V, which is significantly lower than the applied voltage of +0.8 V required in the WO3 films having the larger amount of TCA. This result originates from the highest diffusion coefficient of the 8Ti-WO3-300 (see Fig. S6†). Increasing the annealing temperature above 300 °C deteriorates the performance of the 8Ti-WO3-300 as shown in Fig. S9 and S10,† which might be associated with the crystallization-induced decrease of diffusion coefficient. In contrast, the WO3 films having TCA dopants more than 8 wt% still show reasonable optical variation and reversibility even at higher annealing temperatures. These results can be ascribed to the reduced crystallization and the increased crack formation, simultaneously promoting the charge transfer and electrolyte infiltration.
The coloration and bleaching speed of WO3 films also showed different dependence on the morphological and structural properties of the WO3 films. The switching times that can be defined as the times required to reach 90% of the maximum transmittance change, were investigated by monitoring the in situ transmittance modulation at 550 nm under the potential range between −1.0 and 0.8 V for 60 s interval with chronoamperometry (CA). The resulting transmittance variations at 550 nm were presented in Fig. S12† and the calculated switching times are shown in Fig. 5.
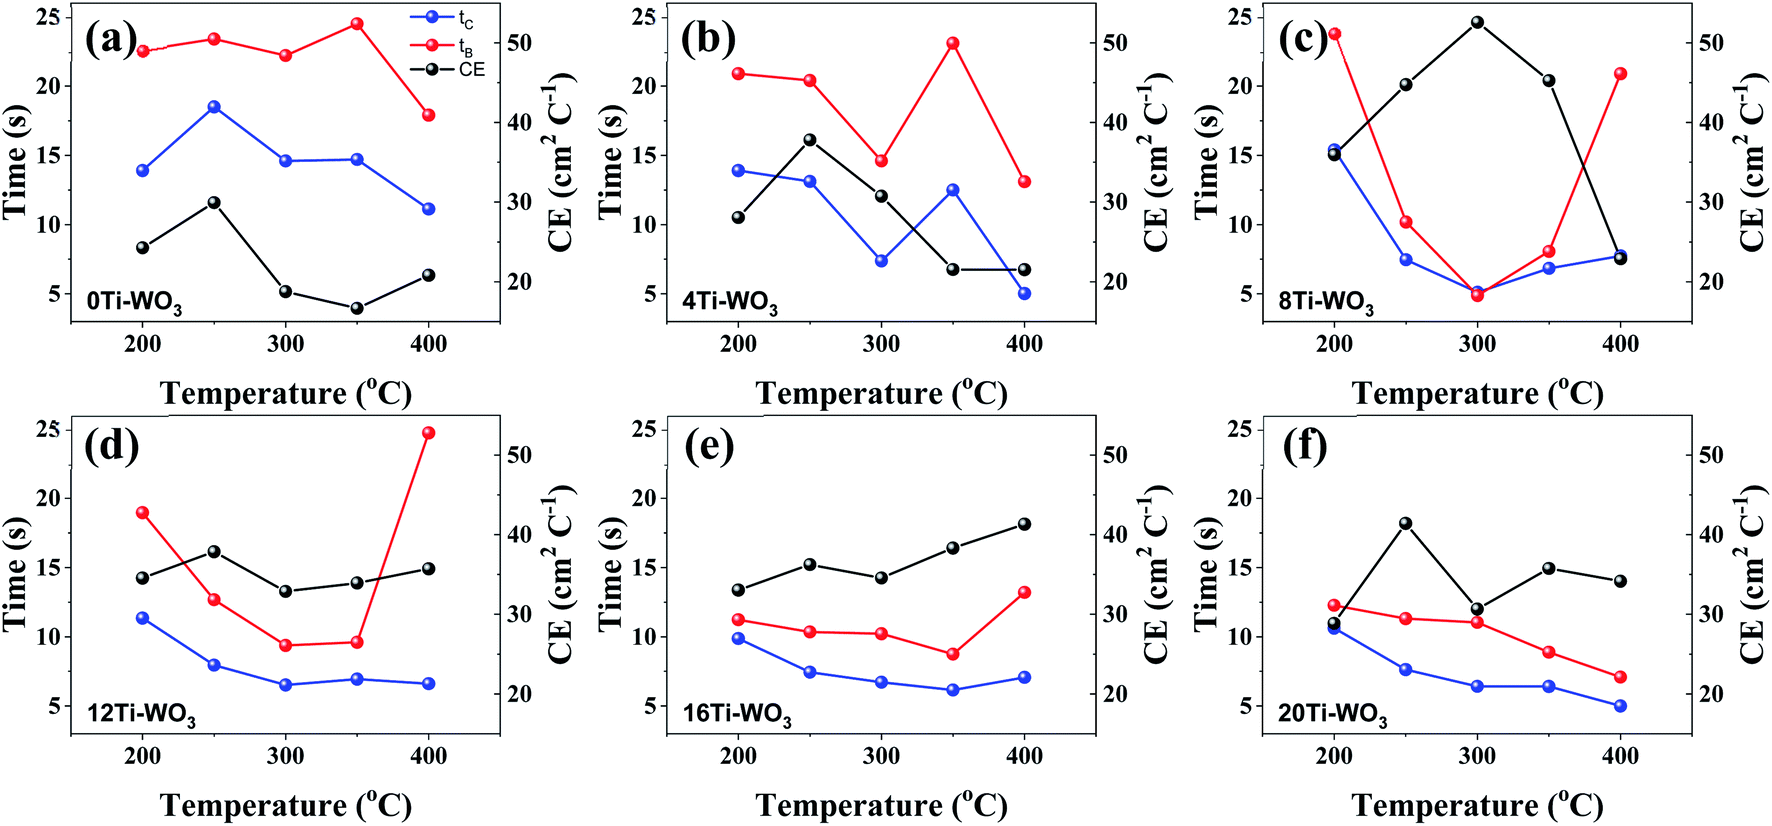 | ||
| Fig. 5 Annealing temperature dependent variations of switching times for coloring and bleaching processes measured at 550 nm as well as the corresponding coloration efficiencies. (a) 0Ti-WO3, (b) 4Ti-WO3, (c) 8Ti-WO3, (d) 12Ti-WO3, (e) 16Ti-WO3, and (f) 20Ti-WO3. | ||
Both coloring (tc) and bleaching (tb) times of the 8Ti-WO3-300 rapidly decrease as the annealing temperatures increase from 200 to 300 °C, with an almost identical tc and tb value of 5.12 and 4.87 s at 300 °C, respectively. At 400 °C annealing temperature, the bleaching time of the 8Ti-WO3 quickly increases to 20.9 s while its coloring time slightly increases to 7.73 s. According to these kinetic features, it can be understood why the 8Ti-WO3-300 had the largest optical modulation and reversibility, and increasing temperature above 300 °C deteriorated the electrochromic performances of the 8Ti-WO3. Again, this is due to the most favorable morphological and structural properties of the 8Ti-WO3-300. Interestingly, except for the 8Ti-WO3-300, the addition of TCA more than 16 wt% led to better performance than the 8Ti-WO3 at all annealing temperature. As mentioned previously (see Fig. 1 and S1†), the degrees of pore formation linearly increased with TCA amounts with annealing temperatures up to 300 °C, which improving the switching kinetics of the 16 and 20Ti-WO3 films. The better switching kinetics of 16 and 20Ti-WO3 films at higher annealing temperature than 300 °C relative to those of the 8Ti-WO3 might be related with the crack formation of the formers. Another important criterion used to determine electrochromic characteristics is coloration efficiency (CE). CE is defined as the change in optical density (ΔOD) measured at the wavelength λ per unit of charge (ΔQ) inserted into (or extracted from) the electrochromic layers and can be calculated using the following equations.3
 | (3) |
 | (4) |
Fig. S13† shows the curves of OD at a wavelength of 550 nm as a function of intercalation charge density under a potential of −1.0 and 0.8 V. The CE can be calculated from the slope of the linear region of the curves. The extracted CE values are depicted in Fig. 5 (black lines). The 8Ti-WO3 films show a clear correlation of CE with the switching time, having the largest CE of 52.58 cm2 C−1 at 300 °C.
Long-term stability is another critical factor in determining practical application of electrochromic materials. Considering the previous results, we decided to monitor the coloration–bleaching cycles of the 8Ti-, 16Ti- and 20Ti-WO3-films at 550 nm among various WO3 films by applying a voltage window switched between −1.0 and 0.8 V with one cycle duty of 60 s. While the results for the 8Ti-, 16Ti- and 20Ti-WO3-300 films were depicted in Fig. 6, the others annealed at different temperatures were shown in Fig. S14.† Fig. 6 shows excellent cycle stability of 8Ti-WO3 at 100 cycles at 300 °C. Among the 8Ti-, 16Ti- and 20Ti-WO3-films, the 8Ti-WO3-300 showed the best performance both in optical density variation and cyclic stability, which could be originated from the optimized structural/morphological properties as well as the balanced charge transfer kinetic features. The further increase of the annealing temperature to 400 °C greatly deteriorated the performance of the corresponding 8Ti-WO3-400 (see Fig. S14†) due to its partial transformation to crystalline phase.
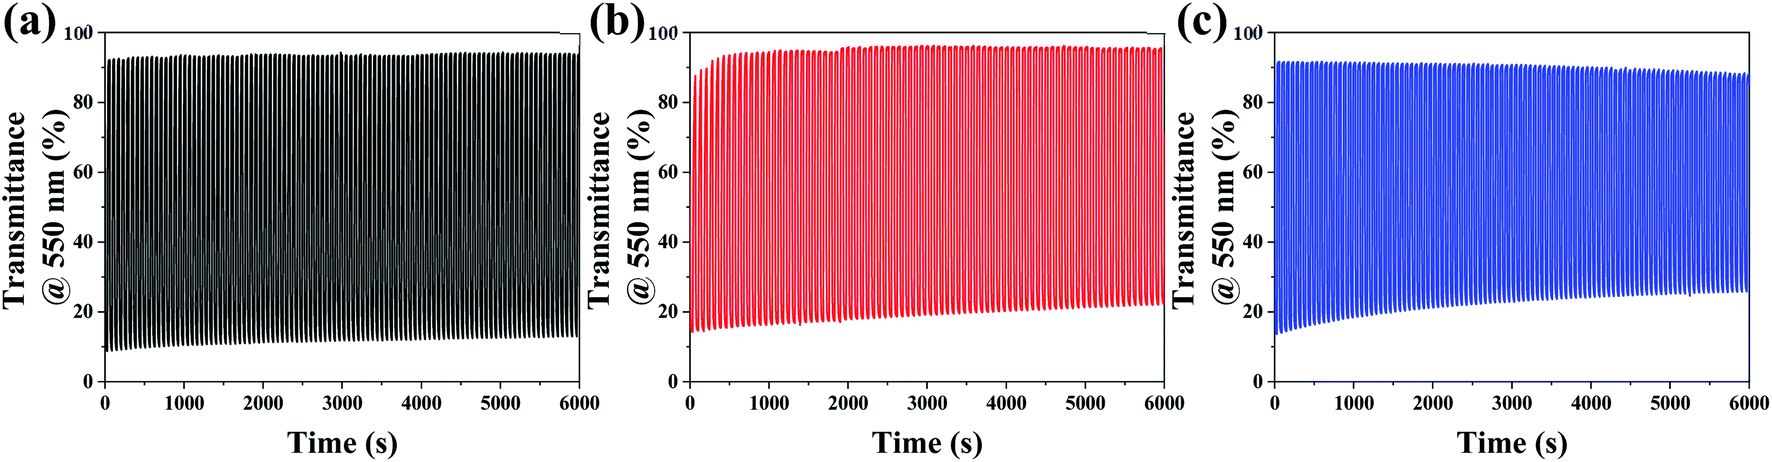 | ||
| Fig. 6 In situ transmittance variation at λ = 550 nm during cyclic tests for the (a) 8Ti-, (b) 16Ti- and (c) 20Ti-WO3-300. | ||
4. Conclusion
The present work presents how the amounts of Ti-dopants and annealing temperature variation affect structural and morphological properties of sol–gel derived electrochromic WO3 films. Through complementary characterization techniques, both parameters are critical in controlling physical and chemical properties of WO3 films. For TCA as Ti-dopant, we find that the Ti-dopant acts as a crystallization inhibitor of WO3 framework and also induces the formation of pores via its thermal decomposition during the subsequent annealing procedure. In the investigated ranges of TCA amounts ranging from 0 wt% to 20 wt%, we demonstrate that the 8 wt% TCA is an optimal amount, yielding amorphous WO3 films with smooth and nanoporous morphologies under suitable annealing conditions. According to the thermal decomposition temperature of TCA around at 260 °C, the annealing temperature also influences the physical properties of the resulting WO3 films. All of the WO3 films show the smooth and compact morphology at 200 °C annealing temperature regardless of TCA amounts, leading to inferior electrochemical performance. The annealing temperature between 250 and 300 °C induces the TCA decomposition, forming a porous structure with a linearly increases in density with the amount of TCA. Moreover, while the neat WO3 is crystallized at 250 °C, the addition of TCA inhibits the crystallization of WO3 with incremental increase of its crystallization temperature. Combining all results, the 8Ti-WO3-300 with optimized structural and morphological features shows a highest charge density and fastest charge transfer kinetics, resulting in outstanding electrochromic performances such as large optical density of 73.78% in the visible light (400–780 nm), rapid switching speed (tc = 5.12 s and tb = 4.74 s), and high coloration efficiency of 52.58 cm2 C−1. In addition, the 8Ti-WO3-300 exhibits the superior cyclic performance, highlighting the importance in finely controlling the structural and morphological features of electrochromic WO3 via a simple additive engineering and thermal treatment condition. Hence, the present work would offer more opportunities towards engineered electrochromic materials for use in optoelectronic devices and beyond.Conflicts of interest
There are no conflicts of interest to declare.Acknowledgements
This work was conducted under the framework of the Research and Development Program of the Korea Institute of Energy Research (KIER) (C2-2448).References
- C. G. Granqvist, Handbook of Inorganic Electrochromic Materials, Elsevier, 1995 Search PubMed.
- R. J. Mortimer, Annu. Rev. Mater. Res., 2011, 41, 241–268 CrossRef CAS.
- X. Li, K. Perera, J. He, A. Gumyusenge and J. Mei, J. Mater. Chem. C, 2019, 7, 12761–12789 RSC.
- C. G. Granqvist, Thin Solid Films, 2014, 564, 1–38 CrossRef CAS.
- C.-G. Granqvist, Electrochromic Mater. Devices, 2015, 1, 3 Search PubMed.
- G. A. Niklasson and C. G. Granqvist, J. Mater. Chem., 2007, 17, 127–156 RSC.
- C. G. Granqvist, Sol. Energy Mater. Sol. Cells, 2000, 60, 201–262 CrossRef CAS.
- R. Cinnsealach, G. Boschloo, S. Nagaraja Rao and D. Fitzmaurice, Sol. Energy Mater. Sol. Cells, 1999, 57, 107–125 CrossRef CAS.
- A. Ghicov, H. Tsuchiya, R. Hahn, J. M. Macak, A. G. Muñoz and P. Schmuki, Electrochem. Commun., 2006, 8, 528–532 CrossRef CAS.
- F. Ferreira, Solid State Ionics, 2000, 136–137, 357–363 CrossRef CAS.
- R. Romero, E. A. Dalchiele, F. Martín, D. Leinen and J. R. Ramos-Barrado, Sol. Energy Mater. Sol. Cells, 2009, 93, 222–229 CrossRef CAS.
- N. Özer, D.-G. Chen and C. M. Lampert, Thin Solid Films, 1996, 277, 162–168 CrossRef.
- D. A. Wruck and M. Rubin, J. Electrochem. Soc., 1993, 140, 1097–1104 CrossRef CAS.
- J. D. E. McIntyre, S. Basu, W. F. Peck, W. L. Brown and W. M. Augustyniak, Solid State Ionics, 1981, 5, 359–362 CrossRef CAS.
- S. Cong, F. Geng and Z. Zhao, Adv. Mater., 2016, 28, 10518–10528 CrossRef CAS PubMed.
- C. C. Mardare and A. W. Hassel, Phys. Status Solidi A, 2019, 216, 1900047 CrossRef.
- H. Li, C. J. Firby and A. Y. Elezzabi, Joule, 2019, 3, 2268–2278 CrossRef CAS.
- C. Ge, M. Wang, S. Hussain, Z. Xu, G. Liu and G. Qiao, Thin Solid Films, 2018, 653, 119–125 CrossRef CAS.
- S. Sallard, T. Brezesinski and B. M. Smarsly, J. Phys. Chem. C, 2007, 111, 7200–7206 CrossRef CAS.
- F. Zheng, W. Man, M. Guo, M. Zhang and Q. Zhen, CrystEngComm, 2015, 17, 5440–5450 RSC.
- W. Cheng, J. He, K. E. Dettelbach, N. J. J. Johnson, R. S. Sherbo and C. P. Berlinguette, Chem, 2018, 4, 821–832 CAS.
- T. Maruyama and S. Arai, J. Electrochem. Soc., 1994, 141, 1021–1024 CrossRef CAS.
- S. H. Lee, R. Deshpande, P. A. Parilla, K. M. Jones, B. To, A. H. Mahan and A. C. Dillon, Adv. Mater., 2006, 18, 763–766 CrossRef CAS.
- S. Lee, Solid State Ionics, 2003, 156, 447–452 CrossRef CAS.
- S. Park, D. T. Thuy, S. Sarwar, H. V. Tran, S. I. Lee, H. S. Park, S. H. Song, C.-H. Han and S. Hong, J. Mater. Chem. C, 2020, 8, 17245–17253 RSC.
- X. Sun, H. Cao, Z. Liu and J. Li, Appl. Surf. Sci., 2009, 255, 8629–8633 CrossRef CAS.
- D. Işık, M. Ak and C. Durucan, Thin Solid Films, 2009, 518, 104–111 CrossRef.
- S. Balaji, Y. Djaoued, A.-S. Albert, R. Brüning, N. Beaudoin and J. Robichaud, J. Mater. Chem., 2011, 21, 3940 RSC.
- H. Li, J. Chen, M. Cui, G. Cai, A. L.-S. Eh, P. S. Lee, H. Wang, Q. Zhang and Y. Li, J. Mater. Chem. C, 2016, 4, 33–38 RSC.
- H.-H. Lu, J. Alloys Compd., 2008, 465, 429–435 CrossRef CAS.
- I. Valyukh, S. Green, H. Arwin, G. A. Niklasson, E. Wäckelgård and C. G. Granqvist, Sol. Energy Mater. Sol. Cells, 2010, 94, 724–732 CrossRef CAS.
- J. Gutpa, H. Shaik, K. Naveen Kumar and S. A. Sattar, Mater. Sci. Semicond. Process., 2022, 143, 106534 CrossRef CAS.
- C. M. White, D. T. Gillaspie, E. Whitney, S.-H. Lee and A. C. Dillon, Thin Solid Films, 2009, 517, 3596–3599 CrossRef CAS.
- T. Ye, Y. Xiang, H. Ji, C. Hu and G. Wu, RSC Adv., 2016, 6, 30769–30775 RSC.
- M. Deepa, A. G. Joshi, A. K. Srivastava, S. M. Shivaprasad and S. A. Agnihotry, J. Electrochem. Soc., 2006, 153, C365 CrossRef CAS.
- P. Jittiarporn, S. Badilescu, M. N. Al Sawafta, L. Sikong and V.-V. Truong, J. Sci.: Adv. Mater. Devices, 2017, 2, 286–300 Search PubMed.
- A. Hasani, Q. V. Le, T. P. Nguyen, K. S. Choi, W. Sohn, H. W. Jang and S. Y. Kim, Electrochim. Acta, 2018, 283, 1195–1202 CrossRef CAS.
- Y. Wang, G. Shen, T. Tang, J. Zeng, R. U. R. Sagar, X. Qi and T. Liang, Electrochim. Acta, 2022, 412, 140099 CrossRef CAS.
- S. Zeb, G. Sun, Y. Nie, H. Xu, Y. Cui and X. Jiang, Mater. Adv., 2021, 2, 6839–6884 RSC.
- S. R. Bathe and P. S. Patil, Solid State Ionics, 2008, 179, 314–323 CrossRef CAS.
- G.-F. Cai, X.-L. Wang, D. Zhou, J.-H. Zhang, Q.-Q. Xiong, C.-D. Gu and J.-P. Tu, RSC Adv., 2013, 3, 6896 RSC.
- M. A. Arvizu, C. A. Triana, B. I. Stefanov, C. G. Granqvist and G. A. Niklasson, Sol. Energy Mater. Sol. Cells, 2014, 125, 184–189 CrossRef CAS.
- Y. Zhan, M. R. J. Tan, X. Cheng, W. M. A. Tan, G. F. Cai, J. W. Chen, V. Kumar, S. Magdassi and P. S. Lee, J. Mater. Chem. C, 2017, 5, 9995–10000 RSC.
- H. Li, L. McRae, C. J. Firby and A. Y. Elezzabi, Adv. Mater., 2019, 31, 1807065 CrossRef PubMed.
- K. Paipitak, C. Kahattha, W. Techitdheera, S. Porntheeraphat and W. Pecharapa, Energy Procedia, 2011, 9, 446–451 CrossRef CAS.
- Y. Djaoued, S. Balaji and R. Brüning, J. Nanomater., 2012, 2012, 1–9 CrossRef.
- Z. Wang and X. Hu, Electrochim. Acta, 2001, 46, 1951–1956 CrossRef CAS.
- M. Deepa, T. K. Saxena, D. P. Singh, K. N. Sood and S. A. Agnihotry, Electrochim. Acta, 2006, 51, 1974–1989 CrossRef CAS.
- D. S. Dalavi, R. S. Devan, R. A. Patil, R. S. Patil, Y.-R. Ma, S. B. Sadale, I. Kim, J.-H. Kim and P. S. Patil, J. Mater. Chem. C, 2013, 1, 3722 RSC.
- T. J. Vink, E. P. Boonekamp, R. G. F. A. Verbeek and Y. Tamminga, J. Appl. Phys., 1999, 85, 1540–1544 CrossRef CAS.
Footnote |
| † Electronic supplementary information (ESI) available. See https://doi.org/10.1039/d2ra02247h |
| This journal is © The Royal Society of Chemistry 2022 |